Official URL
https://doi.org/10.1007/978-3-030-28577-7_5
Any correspondence concerning this service should be sent to the repository administrator: [email protected]
This is an author’s version published in: http://oatao.univ-toulouse.fr/26251 Open Archive Toulouse Archive Ouverte
OATAO is an open access repository that collects the work of Toulouse researchers and makes it freely available over the web where possible
To cite this version: Hoang, Thi Bich Ngoc and Mothe, Josiane and
Baillon, Manon TwitCID: a Collection of Data Sets for Studies on
Information Diffusion on Social Networks. (2019) In: Conference and Labs of the Evaluation Forum (CLEF 2019), 9 September 2019 - 12 September 2019 (Lugano, Switzerland).
TwitCID: A Collection of Data Sets
for Studies on Information Diffusion
on Social Networks
Thi Bich Ngoc Hoang1,2(B), Josiane Mothe3, and Manon Baillon4
1
UPS, Universit´e de Toulouse, IRIT, UMR5505 CNRS, Toulouse, France [email protected]
2
University of Economics, The University of Danang, Da Nang, Vietnam
3
ESPE, UT2J, Universit´e de Toulouse, IRIT, UMR5505 CNRS, Toulouse, France [email protected]
4
Universit´e Capitole, Toulouse, France [email protected]
Abstract. Online social networks play a crucial role in spreading infor-mation at a very large scale. Modeling inforinfor-mation propagation on social networks has been attracting a lot of attention from researchers. How-ever, none of the data sets used in past works are made available to the research community, while they would be very useful for comparative studies. In this paper, we detail a collection of tweets composed of five data sets for a total of 18 million tweets that we release, and which is designed to evaluate methods on modeling the information spread, in the case of general information and brands marketing information. In addi-tion to tweet IDs and a script to retrieve the whole tweet in JSON from the Twitter API, we release the values of the 29 extracted features for these data sets. These features consist of user based, content based and temporal based features. Finally, we provide the results of information diffusion prediction models (80% accuracy) which could serve as strong baselines for this research topic.
Keywords: Information diffusion
·
Evaluation collection·
Tweet collection·
Retweets·
Social networks1
Introduction
Predicting information diffusion is an important challenge for many tasks from marketing [6] to information check-worthiness [11]. It has attracted a lot of
attention in social networks research community [1,5,12,18] and which is not yet solved. However, in past studies, the data sets used in the evaluation part of the studies are not made available while it is well acknowledge that benchmark collections are very useful for comparative studies.
In this paper, we introduce the TwitCID collection which consist of a set of five data sets of tweets. In total, there are more than 18 million of tweets in about
_ https://doi.org/10.1007/978-3-030-28577-7 5
“general” information (two data sets) and “brand marketing” information (three data sets), of which million tweets are forwarded hundreds to dozen thousand times. In addition, we include the description of features we extracted from these tweets and release their values for the five data sets. These features cover 29 characteristics related to the users who created the tweets, the content of the tweets and the time the tweets were created. Finally, we provide effectiveness results of two information diffusion prediction models defined respectively by Suh et al. [19] and Hoang et al. [7]. These models reach up to 80% accuracy and could serve as a strong baselines although there is still room for improving these results.
Other researchers can use our released material (data sets, extracted fea-tures, results of strong predictive models) to evaluate their method of predicting information diffusion. The TwitCID collection and the extracted feature values are provided at http://doi.org/10.5281/zenodo.3246705.
The rest of the paper is organized as follows: Sect.2presents the related work. Section3 describes the TwitCID collection, the extracted features along with the descriptive analysis of the most peculiar features. In Sect.4, we report the results of information diffusion prediction models on our collection which could serve as strong baseline for future studies. We conclude the paper in Sect.5.
2
Related Work
While Twitter-based data sets are available for information extraction [2,14], name entity recognition evaluation [15,17], for sentiment analysis evaluation [13,
16,20] and information cascade modeling [3,22], there is no reference data sets to evaluate predicting information diffusion despite the growing interest in this domain [4,5,7,9,19,21].
In the area of predicting the information diffusion on social networks, various studies have been carried on and widely referenced. Guille et al. [5] developed a model to predict the temporal dynamics of information spreading on social networks based on machine learning algorithms and the inference of time depen-dent diffusion probabilities from a multidimensional individual behaviors analy-sis. They evaluated their method on a large data set which includes 467 million Twitter posts. Also using machine learning approach evaluated on a tweet data set, Varshney et al. [21] proposed a model to predict the information diffusion probabilities on social networks. They used a Bayesian network considering user interests and content similarity models. Dong et al. [4] used two data sets of around one million of tweets posted by Sina-Weibo to evaluate their approach on predicting the propagation of natural disaster information while Kafeza et al. [9] used 13,000 tweets related to the Malaysia airline flight 370 disappearance (#MH370) to evaluate their model on predicting the information spread pat-terns. However, none of these data sets have been made available to the research community.
Suh et al. [19] introduced several features that may affect the diffusion of a given message on social networks. Analysing a large scale data set of 74 mil-lion tweets, they showed that the number of followers and followees, the age
of the user account and the number of favourites strongly correlate with the retweetability. Conversely, the total of the user’s past tweets and the presence of hashtag/URL do not highly impact on the number of retweets. Hoang et al. proposed a model to predict whether a tweet is going to be diffused and the level of diffusion using machine learning algorithms. Their model is based on various features including Suh’s that were shown effective for diffusion predic-tion evaluapredic-tion. For this reason, we extract the features proposed in Suh and Hoang studies and release them to the community.
Two twitter-based data sets have been made available on information cas-cade. Domenico et al. [3] distributed a data set that includes about 450 thousand nodes and 15 million edges representing the spreading processes on Twitter, the relationships between friends and followers, between who retweets/replies/m-entions from whom. Xie et al. [22] distributed a data set of 6 million URLs and 540 thousand hashtags extracted from a data flow of 32 millions tweets that they consider as identities of cascades. Each row in the released data set includes one URL/hashtag along with list of anonymized user-timestamp pairs. These two released data sets show which users interact with which users [3], or which users mentioned the same URLs/hashtags in their messages [22] but neither the tweet ID nor related information regarding the users’ profile, the message contents or the time tweets were created which are main objects in a Tweet JSON and which are very crucial in predicting the diffusion of a message on social net-works [9,10]. That make these data sets of limited use for information diffusion prediction evaluation.
In this paper we describe the TwitCID collection consisting of 5 Twitter data sets (around 18M tweets) that we make available for research purposes. It is designed to evaluate studies on predicting information diffusion on social networks. In addition, we provide a set of extracted features corresponding to data sets, along with results of predictive models of 80% accuracy which can be used as a baseline for other works in this area.
3
The TwitCID Collection
3.1 Data Sets on General and Brand Marketing Information
The TwitCID collection consists of five Twitter data sets which were extracted from the 1% of the tweets that Twitter agrees to be collected. The Firstweek and Secondweek data set were collected during the first week and second week of January 2017 while the Iphone, Gucci and Galaxy data sets were collected from 21 September 2015 to 31 May 2017 using the keywords “iphone”, “gucci” and “galaxys” respectively. We designed the TwitCID collection so that it con-tains “general” information (Firstweek and Secondweek data sets) and more “marketing”-oriented information (the three other data sets). In that way, infor-mation diffusion can be studied in different scenario using the TwitCID collec-tion.
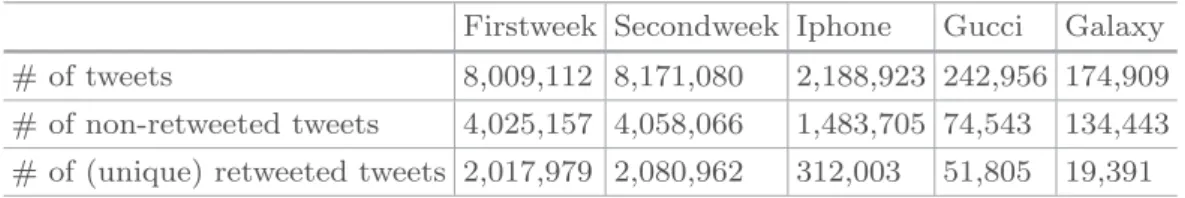
Table1 reports the number of tweets, the number of non-retweeted and the number of unique retweeted tweets for the five data sets. We can see that the
Table 1. The number of tweets and their distribution for our TwitCID collection. Firstweek Secondweek Iphone Gucci Galaxy # of tweets 8,009,112 8,171,080 2,188,923 242,956 174,909 # of non-retweeted tweets 4,025,157 4,058,066 1,483,705 74,543 134,443 # of (unique) retweeted tweets 2,017,979 2,080,962 312,003 51,805 19,391 Table 2.The number of tweets and their distribution according to the level of retweets on the TwitCID collection. Class-0 corresponds to the tweets that are not retweeted, class-1 are retweeted less than 100 times, class-2 from 100 times to 10,000 times, and class-3 more than 10,000 times.
Firstweek Secondweek Iphone Gucci Galaxy Class-0 4,025,157 4,058,066 1,483,705 74,543 134,443 Class-1 1,675,859 1,727,666 271,147 41,752 17,446 Class-2 327,381 339,328 37,355 9,968 1,915
Class-3 14,739 13,905 501 85 30
Fig. 1. Distributions of tweets in classes over our five data sets. Class-0 corresponds to the tweets that are not retweeted, class-1 are retweeted less than 100 times, class-2 from 100 times to 10,000 times, and class-3 more than 10,000 times.
proportion of tweets in each of these classes is about the same for the first and second week data sets, while they differ in the three other data sets.
Table2 presents the distribution of tweets when we consider the level of retweets on the five data sets. In the Table2, class-0 corresponds to the tweets that are not retweeted at all, class-1 are tweets that are retweeted less than 100 times, class-2 from 100 times to 10,000 times, and class-3 are tweets retweeted more than 10,000 times. To make the distribution more visual, we plot it in the Fig.1. FirstWeek and SecondWeek data sets are very similar in terms of class distribution. Moreover, in general, the tweets that are not retweeted are the majority (from 59% to 87% depending on the data sets). The second most populated class is class-1, whatever the data set is and corresponds to from 11% to 33%. Class-2 is from 1% to 8%. Unsurprisingly, there are very few tweets in
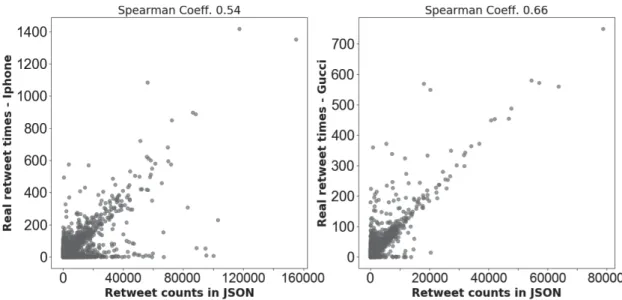
Fig. 2.Spear correlations between the number of times a tweet is retweeted in the data sets and retweet counts in the tweet objects.
class-3, less than 1% for all the data sets. Having data sets with different distri-butions is of interest to be able to evaluate the information diffusion prediction in different contexts.
Since we are using the 1% of tweets from Twitter, it is important to check whether our data sets keeps the original distribution of re-tweets. In Fig.2, we consider the Spearman correlation between the number of times each tweet is retweeted in our data sets and the number of times this tweet is retweeted on Twitter (stored in retweet count field of the tweet object). Spearman coefficient is from 0.5 to 0.7 for our data sets which indicate a good correlation (plots in Fig.2 confirm a strong correlation). This result makes our data sets appropriate to evaluate information diffusion prediction for real world applications.
3.2 Tweet Features
In this section, we shortly describe the features representing a tweet that are released at the same time as the collection and that could be of use for research in the domain of microblog information diffusion. We also briefly present a descrip-tive analysis of the released data sets focusing on features that have been shown to be the most important to predict retweetability [7,19].
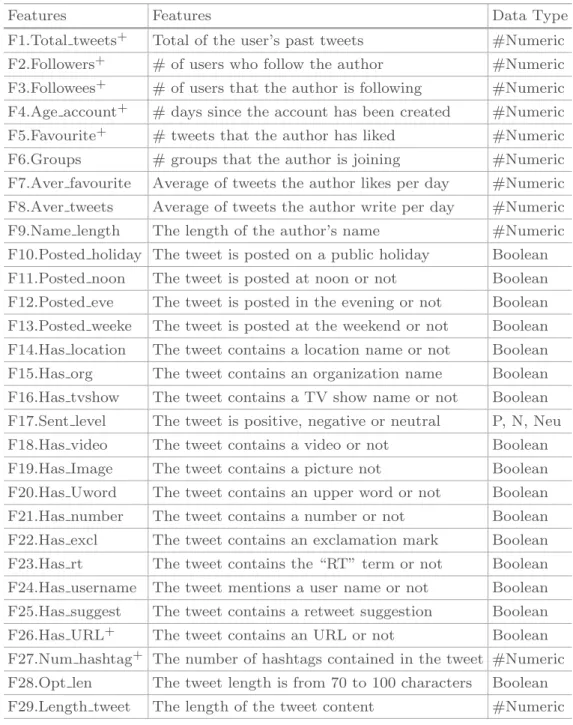
There are three categories of features: related to the tweets’ authors (features F1 to F9), the tweet content (feature F14 to F29) and to the time when the tweet was created (features F10 to F13). Seven features come from [19] (features with a+) and 24 features from [6,7]. Table3 presents a short description of all the
features.
Followers and Followees. In Twitter, followers are people who follow a user and followees are people whom a user follows. These two features have been shown to be important to predict retweetability: the higher the number of fol-lowers and followees, the higher the retweetability [19].
Table 3. The released features which are also used in the baselines for information diffusion prediction. Features with a+ are from Suh et al. [19] while the others are from Hoang et al. [7]
Features Features Data Type
F1.Total tweets+ Total of the user’s past tweets #Numeric
F2.Followers+ # of users who follow the author #Numeric
F3.Followees+ # of users that the author is following #Numeric
F4.Age account+ # days since the account has been created #Numeric
F5.Favourite+ # tweets that the author has liked #Numeric
F6.Groups # groups that the author is joining #Numeric F7.Aver favourite Average of tweets the author likes per day #Numeric F8.Aver tweets Average of tweets the author write per day #Numeric F9.Name length The length of the author’s name #Numeric F10.Posted holiday The tweet is posted on a public holiday Boolean F11.Posted noon The tweet is posted at noon or not Boolean F12.Posted eve The tweet is posted in the evening or not Boolean F13.Posted weeke The tweet is posted at the weekend or not Boolean F14.Has location The tweet contains a location name or not Boolean F15.Has org The tweet contains an organization name Boolean F16.Has tvshow The tweet contains a TV show name or not Boolean F17.Sent level The tweet is positive, negative or neutral P, N, Neu F18.Has video The tweet contains a video or not Boolean F19.Has Image The tweet contains a picture not Boolean F20.Has Uword The tweet contains an upper word or not Boolean F21.Has number The tweet contains a number or not Boolean F22.Has excl The tweet contains an exclamation mark Boolean F23.Has rt The tweet contains the “RT” term or not Boolean F24.Has username The tweet mentions a user name or not Boolean F25.Has suggest The tweet contains a retweet suggestion Boolean F26.Has URL+ The tweet contains an URL or not Boolean
F27.Num hashtag+ The number of hashtags contained in the tweet #Numeric
F28.Opt len The tweet length is from 70 to 100 characters Boolean F29.Length tweet The length of the tweet content #Numeric
In the rest of this section, we briefly present a descriptive analysis of our five data sets considering the most important features to predict retweetability according to [7,19]. Although other features could be developed by researchers in the future, this analysis provides some cues on the features that are related the most to retweetability.
In Fig.3, we present the rate of tweets of which the authors have 1,000 followers or more (called F1000) for TwitCID. The diamond elements present the rate of F1000 tweets from class-0 and the circles present this rate from the
Fig. 3. Rate of tweets from authors who have 1,000 followers or more. Cl-0 represents for tweets that are not retweeted while Cl-RT represents tweets that are retweeted.
class-RT (the union of class-1, class-2 and class-3). As can be seen in this figure, a very large percentage of retweeted-tweets in these data sets are written by authors who have from 1,000 followers. This is shown by the fact that the rate of F1000 tweets from class-RT is very high in all data sets, from 73% to 79%. In addition, there is a low proportion of these F1000 tweets that are not retweeted. The rate of F1000 tweets from class-0 is 19% for the Galaxy data set and 22% for the Iphone data set.
Similarly, for the Followees feature, the rate of tweets created by authors who have 1,000 followees or more (called Fe1000) in class-RT is pretty high, about 34% to 38% depending on the data sets while this rate from class-0 is very low, around 18%. This means tweets created by users who are followed by many other users have a high possibility to be retweeted and low possibility to be non-retweeted.
Groups. Groups denote the number of lists or groups that a Twitter user is a member of. In our five data sets, the number of groups strongly correlate with retweet. We studied the rate of tweets created by authors who are members of at least 50 groups (called Gr50) in each class. This rate is low for class-0 but very high for other classes for all data sets, especially for class-3. For the Galaxy data set, there 34% Gr50 tweets from class-0 but 76% Gr50 tweets from class-2 and 93% from class-3 respectively. For other data sets, the percentage of Gr50 from class-0 is around 20% while this rate is from 39% to 83% for other classes. This result shows that the tweets of authors who join in at least 50 groups have high possibility to be retweeted and there is a high percentage of tweets that are retweeted more than 100 times belong to these users.
Image and Video. The image (resp. video) feature specifies whether a tweet contains an image (resp. video) or not. Figure4 depicts the rate of tweets that contain either an image or a video (called ImVi). Each group of bars corresponds to a data set. Within a data set, each bar corresponds to a class of retweet level. From this figure, we can see that the trend is similar across the data sets. The
Fig. 4. Rate of tweets which contain either an image or a video (a very few contain both) for each data set and each retweet class.
rate of ImVi tweets increases with the class of retweet level; this holds even more for videos than for images. For example, the Firstweek, 12% tweets from class-0 contain a pictures while this percentage is much higher for class-1, class-2 and class-3: 28%, 49% and 55% respectively. The rate of tweets containing a video from class-0 is 0.4%, while this rate for class-1 is ten times more: 4%. This rate for class-2 and class-3 are significantly higher: 15% and 21%.
In Fig.4, we can also observe that the rate of tweets containing an image or a video is generally higher in the “marketing” data sets (Iphone, Gucci and Galaxy) than in the “general” data sets (Firstweek and Secondweek).
Favourite. Favourite is the number of tweets that a user has liked in his time-line. In our collection, the rate of tweets of which the authors have at least 1,000 favourites (called Fav1000) is pretty high: around 50% for the Firstweek, Secondweek and Gucci data sets, and around 30% for the Iphone data set. For the Galaxy data set, although there is only 15% Fav1000 tweets in the whole data set, this rate on class-3 is 77%. The other data sets also have high rate of Fav1000 tweets in class-3: 77% for the Gucci data set and around 60% for the Iphone, Firstweek and Secondweek data sets. This result shows that tweets of authors who have likes at least 1,000 posts on their timeline are highly likely to be retweeted several times.
Age of Account. The Age of an account presents the number of days a user account is registered from.
We analyzed the relationship between the age of the author account and the retweet rate for the data sets of the TwitCID. We found that whatever the data set is, the age of account and retweet rate is linearly strongly correlated (see plot in Fig.5).
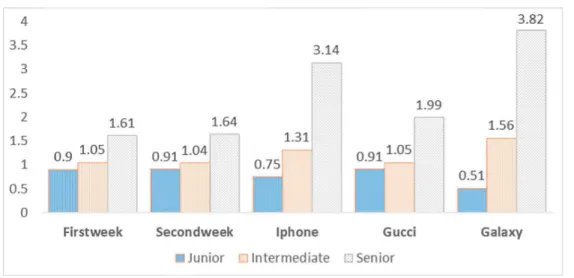
Figure5 presents the normalized retweet rate of different types of users. The junior users: who have registered their account less than 1,000 days, the inter-mediate users: from 1,000 days to 3,000 days and the senior users: greater than 3,000 days. In this figure, the retweet rate represents a normalized ratio of the
Fig. 5.Retweet rate vs Age of account on the five data sets. Junior are users who have created their account less than 1,000 days; Intermediate: from 1,000 days to 3,000 days; Senior: greater than 3,000 days.
number of retweeted tweets to the number of tweets. For example, the first bar in Fig.5 presents the retweet rate of junior users’ tweets for the Firstweek data set. We first divided the total of retweeted tweets of juniors (765,125 tweets) by the total of tweets of juniors (2,534,102 tweets). We then normalized this rate by a factor so that a value of 1.0 represents the average retweet rate. This nor-malization factor is calculated by the total of tweets (6,043,136) over the total of retweeted tweets in the whole data set (2,017,979).
Figure5 shows a very strong relationship between the age of the account and the retweet rate for all data sets. Interestingly, the retweet rate of tweets from senior users for the “marketing” data sets is much higher than the one for the “general” data sets. For the Galaxy data set for example, the retweet rate for senior users is 3.82, for intermediate users it is 1.56 and for junior users it is 0.51 while this rate for senior, intermediate and junior for the Firstweek is 1.61, 1.05 and 0.9 respectively.
Our collection includes a large number of tweets in which million tweets are retweeted hundreds to dozen thousand times. In addition, this collection covers several important features regarding user profile, the content and the time the tweet is posted. Thus it is appropriate for studies on predicting information diffusion on social networks.
3.3 Released Data
Being compliant with Twitter developer agreement and policy1, we publish our TwitCID collection on behalf of our academic institution IRIT 2for the sole
purpose of non commercial research, under the licence CC BYNCSA (Attribution
-1
https://developer.twitter.com/en/developer-terms/agreement-and-policyid34.
2
NonCommercial - ShareAlike). For each data set, we release all tweet IDs accom-panied by a script so that researchers can retrieve the tweets in JSON from the Twitter API. We also provide extracted features described in the Table3 cor-responding to each data set in arff form. All these materials are available at
http://doi.org/10.5281/zenodo.3246705
4
Baseline for Information Diffusion Prediction
In this section, we briefly describe a model for predicting information diffusion on social networks proposed in [7] evaluated on the TwitCID collection considering two sets of features as defined in [19] and [7]. Given a tweet, the model predicts whether this tweet is going to be diffused or not and the level of diffusion.
In [7], the authors considered the prediction of retweetability either as a binary classification problem or as a multi-class classification one like Hong et al.did [8]. For a binary problem, tweets are classified into two classes: class-0 and class-RT. For multi-class problem, tweets are categorized into the four classes as we presented before (class-0 for non retweeted, class-1 to -3 depending on the level of retweet).
The predictive model proposed by Hoang et al. [7] uses Random Forest (RF) implemented on Java Weka library3. The authors showed that RF consistently
outperforms the other machine learning methods on this task; we thus report the results obtained by this model. The results of this model considering the features presented in the Table3 We also report the result Hoang et al.’s model on Suh et al.’s features (features with a+ in the Table3).
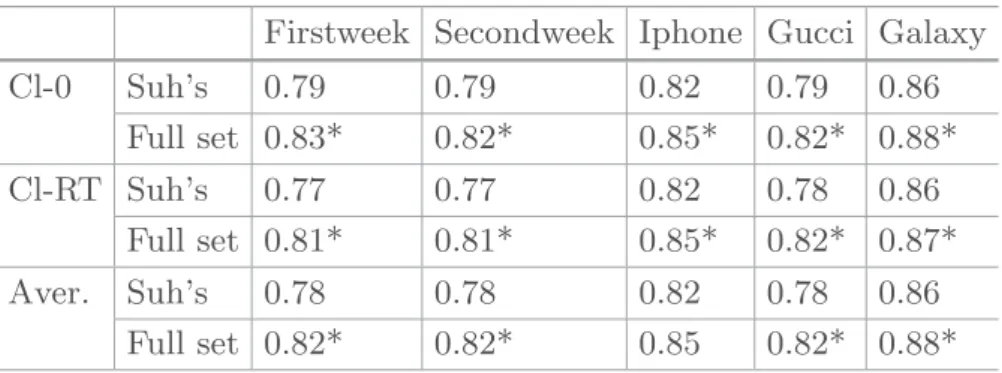
Table 4.Averaged -measure over the sub-sets for each data set - Binary prediction on retweet on the TwitCID collections; * indicates statistically significant differences by Student’s t-test with p-value < 0.05 between Suh and full feature set.
Firstweek Secondweek Iphone Gucci Galaxy
Cl-0 Suh’s 0.79 0.79 0.82 0.79 0.86 Full set 0.83* 0.82* 0.85* 0.82* 0.88* Cl-RT Suh’s 0.77 0.77 0.82 0.78 0.86 Full set 0.81* 0.81* 0.85* 0.82* 0.87* Aver. Suh’s 0.78 0.78 0.82 0.78 0.86 Full set 0.82* 0.82* 0.85 0.82* 0.88*
Since the number of tweets in classes are highly different, the data was bal-anced during the classification process by: (a) each data set was divided into several subsets where the tweets from minor classes (class-1 to 3) are kept the same for all subsets and the tweets from major class (class-0) are divided into
3
subsets so that the number of tweets from major class are approximated to the number of tweet from minor class. (b) SMOTE4 technique is used the to
synthetic minority over sampling.
From the Table4, we can see that using the full set of features remarkably increases the F-measure on each class and on average compared to when using the reduced feature set for all the data sets both for binary classification.
On average, the complete model improves the F-measure by 4% (from 0.78 to 0.82) for the Firstweek, Secondweek and the Gucci data sets; by 3% (from 0.82 to 0.85) for the Iphone and by 2% (from 0.86 to 0.88) for the Galaxy data set compared to the reduced model. All these improvement are statistically significant. One interesting point is that the improvement on class-RT is equal or higher than on class-0 although the number of tweets in class-RT is smaller than the number of tweets in class-0. For the Gucci data set, F-measure is increased by 3% on class-0 while this increase is by 4% on class-RT. The complete model also achieved higher improvement on class-RT than on class-0 for the Galaxy data set that the reduced one (Table4).
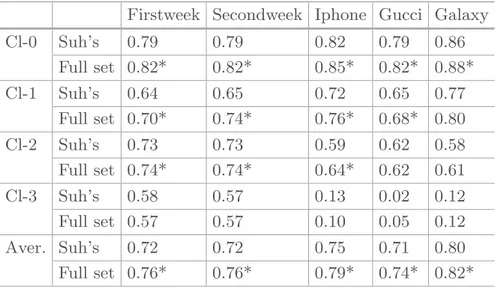
Table 5.F-measure of the model when predicting the level of retweet on the TwitCID collection. * indicates statistically significant differences when using Student’s t-test with p-value < 0.05 when comparing the full set of features and the Suh’s subset.
Firstweek Secondweek Iphone Gucci Galaxy
Cl-0 Suh’s 0.79 0.79 0.82 0.79 0.86 Full set 0.82* 0.82* 0.85* 0.82* 0.88* Cl-1 Suh’s 0.64 0.65 0.72 0.65 0.77 Full set 0.70* 0.74* 0.76* 0.68* 0.80 Cl-2 Suh’s 0.73 0.73 0.59 0.62 0.58 Full set 0.74* 0.74* 0.64* 0.62 0.61 Cl-3 Suh’s 0.58 0.57 0.13 0.02 0.12 Full set 0.57 0.57 0.10 0.05 0.12 Aver. Suh’s 0.72 0.72 0.75 0.71 0.80 Full set 0.76* 0.76* 0.79* 0.74* 0.82*
Similarly to the case of binary classification, the complete model increases the F-measure on average and on every class compared to the reduced model for all the data sets for multi-class classification. On average, F-measure is increased by 4% for the Firstweek, Secondweek and Iphone data sets, by 3% for the Gucci data set and by 2% for the Galaxy data set compared to the reduced model. All these improvements are significantly different.
When considering each class, the complete model obtains higher F-measure on class-0, class-1 and class-2 but lower F-measure on class-3 compared to the
4
This algorithm creates synthetic observations based upon the existing minority observations.
reduced model. The reason may be the number of tweets from class-3 which is extremely small compared to those from the other classes (see Table2). For the Gucci data set, the complete model achieves 0.79, 0.65 and 0.62 (F-measure) on class-1, class-2 and class-3 respectively but only 0.02 on class-3. The highest F-measure is obtained on class-0 and class-1 for the Iphone data set which are 0.85 and 0.76 respectively.
5
Conclusions
In this paper, we introduced the TwitCID collection of 18 million tweets that is designed to evaluate studies on predicting information diffusion on social net-works, both for ’general’ information and ’marketing’ information. We also vide extracted features corresponding to each data set regarding the user pro-file, tweet content and temporal information. In addition, we report results of information diffusion prediction models evaluated on our collection (around 80% accuracy) which could be strong baselines for comparative studies.
References
1. Bakshy, E., Rosenn, I., Marlow, C., Adamic, L.: The role of social networks in information diffusion. In: Conference on World Wide Web, pp. 519–528. ACM (2012)
2. Cano Basave, A.E., Varga, A., Rowe, M., Stankovic, M., Dadzie, A.-S.: Making sense of microposts (# MSM2013) concept extraction challenge. In: #MSM, pp. 1–15 (2013)
3. De Domenico, M., Lima, A., Mougel, P., Musolesi, M.: The Anatomy of a Scientific Rumor. (Nature Open Access) Scientific Reports 3, 2980 (2013)
4. Dong, R., Li, L., Zhang, Q., Cai, G.: Information diffusion on social media during natural disasters. IEEE Trans. Comput. Soc. Syst. 5(1), 265–276 (2018)
5. Guille, A., Hacid, H.: A predictive model for the temporal dynamics of information diffusion in online social networks. In: International Conference on World Wide Web, pp. 1145–1152 ACM (2012)
6. Hoang, T.B.N., Mothe, J.: Predicting the diffusion of brand’s stories in social network. In: 19th Computational Linguistics and Intelligent Text Processing (2018) 7. Hoang, T.B.N., Mothe, J.: Predicting information diffusion on Twitter - analysis
of predictive features. J. Comput. Sci. 28, 257–264 (2018)
8. Hong, L., Dan, O., Davison, B.D.: Predicting popular messages in Twitter. In: International Conference on companion on World Wide Web, pp. 57–58. ACM (2011)
9. Kafeza, E., Kanavos, A., Makris, C., Vikatos, P.: Predicting information diffusion patterns in Twitter. In: Iliadis, L., Maglogiannis, I., Papadopoulos, H. (eds.) AIAI 2014. IAICT, vol. 436, pp. 79–89. Springer, Heidelberg (2014). https://doi.org/10. 1007/978-3-662-44654-6 8
10. Lagnier, C., Denoyer, L., Gaussier, E., Gallinari, P.: Predicting information dif-fusion in social networks using content and user’s profiles. In: Serdyukov, P., et al. (eds.) ECIR 2013. LNCS, vol. 7814, pp. 74–85. Springer, Heidelberg (2013).
11. Lespagnol, C., Mothe, J., Ullah, M.Z.: Information nutritional label and word embedding to estimate information check-worthiness. In: SIGIR. ACM (2019).
https://doi.org/10.1145/3331184.3331298
12. Lu, R., Yang, Q.: Trend analysis of news topics on Twitter. Int. J. Mach. Learn. Comput. 2(3), 327–332 (2012)
13. Nakov, P., Kozareva, Z., Ritter, A., Rosenthal, S., Stoyanov, V., Wilson, T.: Semeval-2013 task 2: sentiment analysis in Twitter. In: International Workshop on Semantic Evaluation, pp. 1–18 (2013)
14. Ritter, A., Clark, S., Etzioni, O., et al.: Named entity recognition in tweets: an experimental study. In: Conference on Empirical Methods in Natural Language Processing, pp. 1524–1534. ACL (2011)
15. R¨oder, M., Usbeck, R., Hellmann, S., Gerber, D., Both, A.: N3-a collection of datasets for named entity recognition and disambiguation in the NLP interchange format. In: LREC, pp. 3529–3533 (2014)
16. Saif, H., Fernandez, M., He, Y., Alani, H.: Evaluation datasets for Twitter sen-timent analysis: a survey and a new dataset, the STS-gold. In: 1st workshop on ESSEM at AIIA Conference (2013)
17. Sang, E.F.T.K., De Meulder, F.: Introduction to the CoNLL-2003 shared task: language-independent named entity recognition. In: Conference on Natural Lan-guage Learning at HLT-NAACL, pp. 142–147 (2003)
18. Speriosu, M., Sudan, N., Upadhyay, S., Baldridge, J.: Twitter polarity classification with label propagation over lexical links and the follower graph. In: Workshop on Unsupervised Learning in NLP, pp. 53–63. ACL (2011)
19. Suh, B., Hong, L., Pirolli, P., Chi, E.H.: Want to be retweeted? Large scale analytics on factors impacting retweet in Twitter network. In: IEEE International Conference on Social Computing, pp. 177–184. IEEE (2010)
20. Thelwall, M., Buckley, K., Paltoglou, G.: Sentiment strength detection for the social web. JASIST 63(1), 163–173 (2012)
21. Varshney, D., Kumar, S., Gupta, V.: Predicting information diffusion probabilities in social networks: a Bayesian networks based approach. Knowl.-Based Syst. 133, 66–76 (2017)
22. Xie, W., Zhu, F., Liu, S., Wang, K.: Modelling cascades over time in microblogs. In: IEEE International Congress on Big Data, pp. 677–686 (2015)