Brief Report: A Confirmatory Approach to the Validation of the Peer Group Norm Questionnaire
Rhea Marshall-Denton and Marie-Hélène Véronneau Université du Québec à Montréal
Thomas J. Dishion Arizona State University
Author’s note
This study was supported by research grants DA 07031 and DA 13773 from the National Institute on Drug abuse at the National Institutes of health (NIH/NIDA) to the last author, by grant 1R03HD062753-01A1 from Eunice Kennedy Shriver National Institute of Child Health & Human Development (NIH/NICHD) to the second author and by the Research Scholar Junior 1 Award from the Québec Research Funds e Health awarded to the second author.
This is a pre-copyedited, author-produced version of an article accepted for publication following peer review. The final published version is available online with the following doi : 10.1016/j.adolescence.2016.03.014
Abstract
This study evaluates the internal validity of the “Perception of Peer Group Norms
Questionnaire” (PPGNQ), a 17-item measure that assesses middle school students' perceptions of positive and negative norms among their grade mates. The sample consisted of 1073 Grade 6 students. The factorability of the two hypothesized factors was assessed with exploratory factor analysis and a clear factor structure emerged. Using confirmatory factor analysis, this two-factor model evidenced good fit once items of similar wording and subject matter were permitted to correlate. Support was found for metric, strict, scalar, construct and latent means invariance between genders, suggesting that boys and girls perceived items similarly. The results indicate that the PPGNQ may be recommended as a research questionnaire that demonstrates high internal validity and measurement invariance, and can be used to study the influence of the perception of both negative and positive norms on adolescent behavior in school settings.
Brief Report: A Confirmatory Approach to the Validation of the Peer Group Norm Questionnaire Through the actions of their members, peer groups communicate information about what is socially accepted (Borsari & Carey, 2001). By knowing how others typically behave and what is approved of, individuals can effectively determine how to act in any given context (Cialdini, Reno, & Kallgren, 1990; Lapinski & Rimal, 2005). In young adolescence, a developmental period during which fitting in is meaningful, knowing and understanding what is socially normative is influential when making behavioral decisions (Berndt, 1982).
Studies on normative influence largely assess social norms by measuring the extent to which participants engage in a particular behavior and then creating an aggregate score that represents the prevalence of that behavior. However, for social norms to exert influence, individuals must first perceive and understand what is normative within their reference group. This perception likely differs from the aggregated social norm largely used in research and likely varies from person to person within the same group (Rimal, 2005). In their study on the influence of the perception of peer-group norms in middle school, Véronneau, Marshall-Denton,
Vaillancourt and Dishion (2014) showed that viewing positive school behavior as normative is predictive of increases in grade-point average (GPA) over time, meanwhile perceiving
problematic behaviors as normative within the same reference group leads to decreases in GPA. Similarly, perceiving substance use as normative predicts higher levels of use over time. How one appraises peer group drinking norms, bicycle helmet wearing norms, studying norms and healthy eating norms has also been demonstrated to influence adolescent behavior in those respective areas (Galván, Spatzier, & Juvonen, 2011; Lajunen & Rasanen, 2004; Song, Smiler, Wagoner, & Wolfson, 2012; Stok, de Ridder, de Vet, & de Wit, 2014). No other valid measure assessing perception of peer group norms exists.
Given the importance of adolescents’ perceptions of their peers’ behavior on their own behavioral choices, developing a valid tool that assesses youths’ appraisal of peer group norms would be informative to conducting research on peer influence and to implementing and evaluating interventions that involve peer norm perceptions.
The goal of the present study is to evaluate the internal validity of the “Perception of Peer Group Norms Questionnaire” (PPGNQ), a measure created as part of the Next Generation Project to assess middle school students’ perceptions of positive and negative norms among their
grademates. We hypothesize that two negatively correlated factors, corresponding to a positive norms factor and a negative norms factor, will emerge.
Method Participants and Procedure
Participants are 1,073 students recruited in eight middle schools in the Pacific North West of the United States. Participants were assessed using paper pencil questionnaires in Grade 6 (M age: 12.1 years). The sample consists of 45.5% males and participants were primarily of
European descent (78.2%). The principal investigator obtained the Institutional Review Board’s approval from his university to conduct this study.
Measure
The PPGNQ is composed of 17 items. Participants are asked to rate how many students in their class participate in different activities or behaviors, on a 6-point Likert-type scale ranging from 0 (none) to 5 (almost all). Items refer to positive behaviors (“Students who work to complete homework”, “Students who are friendly to other students”) or negative behaviors (“Students who may have tried or use alcohol”, “Students who fight or bully others”). The full item list is available in Table 1. A high rating on an item indicates that the respondent perceives that behavior as highly common among his or her peers; in other words, the behavior is
considered to be normative. Analytic Strategy
First, we assessed the factorability of the two hypothesized factors with exploratory factor analysis (EFA) using SPSS v.21, and we evaluated the internal consistency of the proposed subscales (Fields, 2005). Second, we performed a confirmatory factor analysis (CFA) using a robust maximum-likelihood estimation method in MPlus v.7.11 to evaluate the two-factor structure, and finally, we conducted an analysis of measurement invariance in order to establish whether the model structure was equivalent across genders (Byrne, 2012).
Results Descriptive Statistics, Correlations and Missingness
The mean, standard deviation and bivariate correlations for all 17 items are presented in Table 2 along with indicators of normality. Most correlations are significant and correlate in the predicted direction, but a few are non-significant.
According to skewness (< 2.0) and kustosis (< 8.0) level cutoffs defined by Kline and Santor (1999), all items are normally distributed. Also, and as indicated by a significant Little’s Missing Completely at Random (MCAR) test, χ2(101) p = .734, the data were MCAR.
Exploratory Factor Analysis
The 17 x 17 correlation matrix of the questionnaire was subjected to a maximum likelihood factor analysis, the recommended test for normally distributed data (Fabrigar,
Wegener, MacCallum & Strahan, 1999). The Bartlett’s test of sphericity (χ2 = 7895.23, df = 136,
p < 0.01) and the Kaiser-Meyer-Olkin (KMO) measure of sampling adequacy (KMO = .86)
indicate appropriateness to proceed with the chosen analysis. Because of the hypothesized negative correlation between the two factors, oblique rotation was favoured over orthogonal rotation, which produces factors that are uncorrelated (Costello & Osborne, 2005). All items load
on the expected factors with all factor loadings exceeding .50 except “Students who try to set goals for school success” (.40), “Students who complete class homework” (.47) and “Students who resist peer activities involving drugs and alcohol” (.20) (Table 2). No items cross-loaded on the other factor. The two resulting factors were named Perception of Positive Norms and
Perception of Negative Norms. As hypothesized, the Perception of Positive Norms factor consists
of the 9 items related to positive behaviors. This factor’s internal consistency reliability
coefficient (Cronbach’s α) is .84. The second factor (α =.88), the Perception of Negative Norms, is composed of the 8 remaining items. Other factor structures using one and three factors were also tested. However, the two-factor structure solution remained the best representation of the data in regards to parsimony, item wording and factor loading.
Confirmatory Factor Analysis
Full information maximum likelihood is used to account for missing data. Model fit is assessed using the Comparative Fit Index (CFI), the Tucker-Lewis Fit Index (TLI), the Standardized Root Mean Square Residual (SRMR and the Root Mean Square Error of
Approximation (RMSEA). In this study, significance of the χ2 statistic is not used as an indicator of goodness of fit due its sensitivity to sample size that renders it likely to reject models using large samples (Hooper, Coughlan & Mullen, 2008). Goodness of fit is established when CFI and TLI values are above 0.95, when RMSEA values are below 0.05, and when SRMR is less than 0.08 (Hu & Bentler, 1999). The significance of difference between nested models is established based on difference in CFI values (ΔCFI). This index is favored as an indicator of model
invariance over the more widely used χ2 difference test because of the χ2 statistic’s sensitivity to sample size. According to Cheung and Rensvold (2002), the CFI value is independent from model complexity and sample size and thus offers superior information for establishing evidence of invariance in large samples.
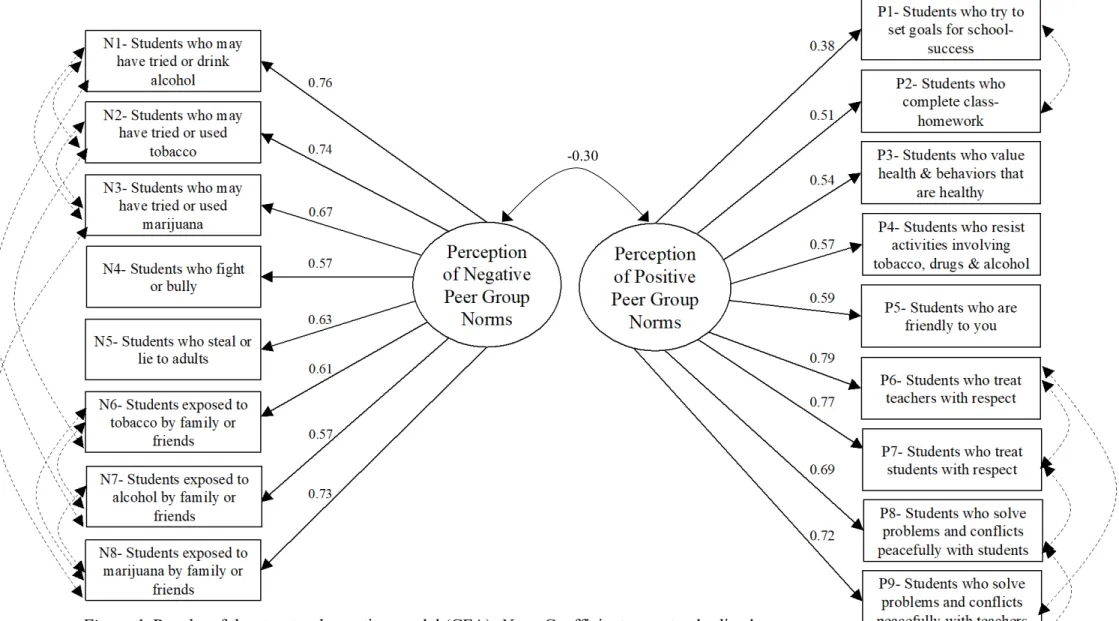
The hypothesized two-factor model exhibits inadequate fit to the data as indicated by the CFI (.81), TLI (.76) and RMSEA (.10), and a SRMR value reaching the limit of acceptability (0.08). To improve model fit, the residual errors of items of similar wording and subject matter were freed to correlate (e.g. “Students who have tried or use tobacco” with “Students exposed to tobacco by family or friends”). In order to establish whether model fit was significantly
improved, this adjusted model (Figure 1) was compared to the previously tested baseline model, in which no residuals were free to correlate. The ΔCFI of 0.17 suggests that the model improved significantly with the added changes. Moreover, this adjusted model displays adequate fit on all indices. Subsequent multigroup analyses are based on this final adjusted model. Table 3 presents the details of the CFA and the subsequent invariance testing procedure.
Measurement invariance
Gender differences were evaluated using measurement invariance testing through multiple group CFA. Measurement invariance testing involves a hierarchical set of procedures in which increasingly severe equality constraints are sequentially specified (Gregorich, 2006). Multigroup invariance is established when the compared model exhibits both adequate fit to the data as indicated by previously described fit indices and a negligible CFI difference (ΔCFI < 0.01) with its baseline counterpart (Byrne, 2012; Cheung & Rensvold, 2002).
The configural model tests the adjusted model for each gender separately within the same model. As suggested by Cheung and Rensvold (2002), each sequential model was compared to this configural model. The hypothesis of invariant factor loadings (metric invariance) was tested by constraining the factor loadings to be equal between groups. Compared to the configural model, ΔCFI < 0.01, the hypothesis of invariant factor loadings was not rejected. The hypothesis of invariant residual variances (strict invariance) was tested and compared to the configural model next. The hypothesis of invariance was not rejected. The hypothesis of invariant intercepts
(scalar invariance) in which intercepts are constrained to be equal for both groups, was tested next. Its fit was also not significantly different from the configural model. Finally, equivalence of construct covariance and of latent means was tested. This final model did not significantly differ form the original configural model in which no parameters were constrained between the two groups. As noted in Table 3, each sequentially tested multiple group model displayed adequate fit on all indices. In all, these results indicate that measurement invariance can be established.
Discussion
The PPGNQ evaluates young adolescents’ perceptions of the social norms prevailing among their grade mates. The present study examined its factorial structure and measurement
invariance on a sample of sixth grade students. Findings show that the PPGNQ demonstrates high internal validity and measurement invariance. It is important to note, however, that these results are based on a single administration of the measure. Future research should investigate if and how perception of peer group norms changes over time and how the structure of this
questionnaire holds with older adolescent samples. Confirmation of the questionnaire structure on an independent sample, test-retest reliability and convergent/discriminatory validity testing would also be valuable avenues for future studies. Much of current research on normative influence uses measures of objective norms based on average scores of how individuals in the reference group behave. Distinctively, the PPGNQ, by considering perception of social norms, allows for a valid assessment of how adolescents subjectively interpret their social surroundings. Use of this
questionnaire may inform research seeking to gain understanding of the underlying psychological processes involved in social influence in early adolescence.
References
Berndt, T. J. (1982). The features and effects of friendship in Early Adolescence. Child
Development, 53, 1447-1460.
Borsari, B., & Carey, K. B. (2001). Peer influences on college drinking: A review of the research.
Journal of Substance Abuse, 13, 391-424.
Byrne, B. M. (2012). Structural Equation Modeling with Mplus. New York: Routledge: Taylor & Francis Group.
Cheung, G. W., & Rensvold, R. B. (2002). Evaluating Goodness-of-Fit Indexes for Testing Measurement Invariance. Structural Equation Modeling: A Multidisciplinary Journal,
9(2), 233-255. doi: 10.1207/s15328007sem0902_5
Cialdini, R. B., Reno, R. R., & Kallgren, C. A. (1990). A Focus Theory of Normative Conduct: Recycling the Concept of Norms to Reduce Littering in Public Places. Journal of
Personality and Social Psychology, 58(6), 1015-1026.
Coie, J. D., Terry, R., Zabriski, A., & Lochman, J. (1995). Early adolescent social influences on delinquent behavior. In J. McCord (Ed.), Coercion and punishment in long-term
Costello, Anna B., & Osborne, Jason W. (2005). Best Practices in Exploratory Factor Analysis: Four Recommendations for Getting the Most From Your Analysis. Practical Assessment,
Research & Evaluation, 10(7).
Fabrigar, L. R., Wegener, D. T., MacCallum, R. C., & Strahan, E. J. (1999). Evaluating the use of exploratory factor analysis in psychological research.Psychological
methods, 4(3), 272
Fields, A. (2005). Discovering statistics using SPSS. Beverly Hills: Sage Publications.
Galván, A., Spatzier, A., & Juvonen, J. (2011). Perceived norms and social values to capture school culture in elementary and middle school. Journal of Applied Developmental
Psychology, 32(6), 346-353. doi: 10.1016/j.appdev.2011.08.005
Gregorich, S. E. (2006). Do self-report instruments allow meaningful comparisons across diverse population groups? Testing measurement invariance using the confirmatory factor
analysis framework. Medical Care, 44(11).
Hooper, D., Coughlan, J., & Mullen, M. (2008). Structural equation modelling: Guidelines for determining model fit. The Electronic Journal of Business Research Methods, 6 (1), 53-60 Hu, L. T., & Bentler, P. M. (1999). Cutoff criteria for fit indexes in covariance structure analysis:
Conventional criteria versus new alternatives. Structural Equation Modeling: A
Multidisciplinary Journal, 6(1), 1-55.
Kline, R. B., & Santor, D. A. (1999). Principles & Practice of Structural Equation Modelling.
Canadian Psychology, 40(4), 381.
Lajunen, T., & Rasanen, M. (2004). Can social psychological models be used to promote bicycle helmet use among teenagers? A comparison of the Health Belief Model, Theory of Planned Behavior and the Locus of Control. Journal of Safety Research, 35(1), 115-123. doi: 10.1016/j.jsr.2003.09.020
Lapinski, M. K., & Rimal, R. N. (2005). An Explication of Social Norms. Communication
Theory, 15(2), 127-147.
Rimal, R. N. (2005). How Behaviors are Influenced by Perceived Norms: A Test of the Theory of Normative Social Behavior. Communication Research, 32(3), 389-414. doi:
10.1177/0093650205275385
Song, E. Y., Smiler, A. P., Wagoner, K. G., & Wolfson, M. (2012). Everyone says it's ok: adolescents' perceptions of peer, parent, and community alcohol norms, alcohol
consumption, and alcohol-related consequences. Substance Use & Misuse, 47(1), 86-98. doi: 10.3109/10826084.2011.629704
Stok, F. M., de Ridder, D. T., de Vet, E., & de Wit, J. B. (2014). Don't tell me what I should do, but what others do: The influence of descriptive and injunctive peer norms on fruit consumption in adolescents. British Journal of Health Psychology, 19(1), 52-64. doi: 10.1111/bjhp.12030
Véronneau, M. H., Marshall-Denton, R., Vaillancourt, M. C., & Dishion, T. J. (2014, May). Peer contagion and social norms: Testing social-cognitive mechanisms underlying adolescent academic adjustment. In Lindstrom Johnson, S (Chair), It takes a village: Identifying ways
to support educational and career outcomes for youth. Symposium presented at the
Table 1.
Full items, Factor Matrix, Communalities (h2), Item Means, and Standard Deviations
Item Factor loading h2 M SD
Factor 1: Negative peer group norms
N1- Students who may have tried or used tobacco .68 .54 1.49 0.76 N2- Students who may have tried or drink alcohol .73 .58 1.69 0.97 N3- Students who may have tried or used marijuana .68 .56 1.36 0.68 N4- Students who fight or bully .55 .41 2.13 0.99 N5- Students who steal or lie to adults .60 .43 2.01 0.98 N6- Students exposed to tobacco by family or friends .75 .64 1.91 1.05 N7- Students exposed to alcohol by family or friends .76 .64 2.01 1.10 N8- Students exposed to marijuana by family or friends .73 .56 1.44 0.75 Factor 2: Positive peer group norms
P1- Students who try to set goals for school-success .40 .30 4.24 1.34 P2- Students who complete class-homework .47 .42 4.70 1.14 P3- Students who value health and behaviors that are healthy .51 .44 4.54 1.23 P4- Students who resist peer activities involving tobacco,
drugs and alcohol
.20 .13 5.04 1.42
P5- Students who are friendly to you .57 .37 4.91 1.17 P6- Students who treat teachers with respect .68 .57 4.77 1.16 P7- Students who treat students with respect .72 .63 4.58 1.18 P8- Students who solve problems and conflicts peacefully
with students
.69 .58 4.32 1.30
P9- Students who solve problems and conflicts peacefully with teachers
Table 2 Items N1 N2 N3 N4 N5 N6 N7 N8 P1 P2 P3 P4 P5 P6 P7 P8 P9 N1 - N2 .68 - N3 .63 .64 - N4 .45 .43 .36 - N5 .39 .46 .40 .58 - N6 .46 .48 .44 .39 .41 - N7 .41 .51 .40 .34 .40 .78 - N8 .55 .58 .65 .40 .46 .57 .56 - P1 -.05† -.04ns -.03 ns -.01 ns -.04 ns .02 ns .01 ns -.03 ns - P2 -.13 -.11 -.11 -.07* -.10* -.03 ns -.04 ns -.08* .46 - P3 -.11* -.10* -.10* -.10* -.14 -.04 ns -.03 ns -.09** .47 .58 - P4 -.21 -.20 -.23 -.19 -.19 -.18 -.10* -.17 .18 .22 .21 - P5 -.06† -.05† -.07* -.16 -.14 .01 ns .02 ns -.02† .27 .27 .27 .15 - P6 -.21 -.21 -.19 -.25 -.27 -.08* -.07* -.17 .26 .40 .39 .23 .49 - P7 -.18 -.15 -.15 -.30 -.28 -.09* -.05† -.15 .29 .38 .39 .19 .57 .70 - P8 -.11* -.14 -.11* -.20 -.19 -.04 ns -.04 ns -.10* .30 .36 .42 .22 .41 .56 .57 - P9 -.14 -.16 -.13 -.25 -.25 -.04 ns -.04 ns -.11 .29 .34 .40 .21 .42 .53 .61 .72 - Skewness 1.89 1.50 2.28 0.83 0.96 1.05 1.10 2.14 -0.62 -1.11 -0.81 -1.62 -0.98 -0.81 -0.73 -0.51 -0.37 Kurtosis 4.78 2.54 6.21 0.71 0.74 .440 0.85 6.03 -0.33 1.30 0.33 1.71 0.31 1.32 0.06 -0.52 -0.71 Note. Full item descriptions are available in Table 2. Items with the prefix N are assigned to the negative norms factor; those with the prefix P are assigned to the positive norms factor.
p < .001 unless otherwise indicated. *p < .01 ; † p < .10 ; nsp > .10
Table 3
Tests of Measurement Invariance
Model CFI TLI SRMR RMSEA X2 (df) ΔCFI
Baseline model 0.81 0.08 0.08 0.10 1225.41* (118)
Adjusted model 0.98 0.97 0.05 0.03 208.34* (98) 0.17
Independent baseline models
Female 0.98 0.97 0.05 0.04 167.00* (98)
Male 0.98 0.97 0.06 0.03 145.90* (98)
Multiple group models
Configural invariance 0.978 0.97 0.05 0.04 326.53* (201)
Metric invariance 0.975 0.97 0.06 0.04 358.62* (213) 0.003 Strict invariance 0.975 0.97 0.06 0.03 374.42* (233) 0.003 Scalar invariance 0.970 0.97 0.07 0.04 429.80* (250) 0.009 Latent mean and
covariance invariance 0.970 0.97 0.07 0.04 420.98* (246) 0.008 * p < 0.01
-0.30
Figure 1. Results of the structural equation model (CFA). Note: Coefficients are standardized.