Any correspondence concerning this service should be sent
to the repository administrator: [email protected]
This is an author’s version published in:
http://oatao.univ-toulouse.fr/22657
Official URL
DOI : https://doi.org/10.1109/SmartWorld.2018.00180
Open Archive Toulouse Archive Ouverte
OATAO is an open access repository that collects the work of Toulouse
researchers and makes it freely available over the web where possible
To cite this version: Lai, Yongxuan and Lin, Hailin and Gao,
Xing and Yang, Fan and Yin, Shaoyi Request Answering in
Vehicular Ad-Hoc Networks Based on Adaptive Filters. (2018) In:
15th IEEE International conference on Ubiquitous Intelligence and
Computing (IEEE UIC 2018), 8 October 2018 - 12 October 2018
(Guangzhou, China).
1
stYongxuan Lai
∗Shenzhen Research Institute, Xiamen University Shenzhen 518000, China
School of Software, Xiamen University Xiamen 360000, China.
2
rdHailin Lin, Xing Gao
School of Software, Xiamen University Xiamen 360000, China.
[email protected], [email protected]
3
ndFan Yang
Department of Automation, Xiamen University Xiamen 360000, China.
4
thShaoyi Yin
IRIT, Paul Sabatier University,
Toulouse 31062, France [email protected]
Abstract—Vehicles in urban city are equipped with more and more sensing units, which brings about great potentials to the intelligent and green city traffic management. In this paper we propose a filter-based framework called FERA (Filter-based Efficient Request Answering) that combines the concept of fog computing and vehicular sensing. FERA combines the pull/push strategies to adaptively and efficiently gather the requested data in vehicular ad hoc networks. Filters are adopted to control the passage or blockage of the data readings, and requests are directed down to edge nodes or ordinary nodes to further search the requested data. FERA sets and adjusts filters according to their ratio of cost between the push and the pull methods, which effectively pushes the matched data readings upward and blocks the unmatched data readings, saving a large number of message transmissions. Experiments based on real-world road network demonstrate the effectiveness of the proposed scheme in vehicular sensing applications. Up to 85% of the requests could be successfully processed in the proposed scheme, which is better than existing schemes while at the same time with a relatively low transmission cost.
Index Terms—push/pull, request answering, filters, edge com-puting, VANET
I. INTRODUCTION
Vehicular nodes are equipped with more and more sensing units, and large amount of sensing data such as GPS locations, speeds, video clips, and so on are generated [1]. These data are shared or uploaded as an input for applications aiming at more intelligent transportation, emergency response, and reducing pollution and fuel consumption [2], [3]. This has led to the emergence of a new kind of system, i.e. the Vehicular Ad-hoc Sensing System [4], [5]. Vehicles traveling along roads exchange information with encountered vehicles or nodes through V2V(vehicle to vehicle) or V2I (vehicle to infrastructure) communications, and data can be disseminated
This research is supported by the Natural Science Foundation of China (No. 61672441), the Shenzhen Basic Research Program (No. JCYJ20170818141325209), the National Key Technology Support Program (No. 2015BAH16FF01), the State Scholarship Fund of China Scholarship Council (No. 201706315020). Corresponding author: Yongxuan Lai.
and reach a far distance by using moving vehicles as interme-diates, following multi-hop routing protocols. Recently, IEEE 802 committee defined wireless communication standard IEEE 802.11p [6] that serves specifically for V2I communication. The Federal Communications Commission has allocated 75 MHz of bandwidth, which operates on 5.9 GHz channel for short range communications.
One key and challenging issue in VANET is the vehicular sensing and data gathering. On one hand, vehicular nodes are limited to road topology while moving, and under various road conditions and high moving speed the network usually suffers rapid topology and density changes. On the other hand, The vehicular sensed data is in large amount and characterized as continuous generation. The sensed data should be filtered and preprocessed before being shared or uploaded. Data filtering and query processing technologies tailored to the VANET environment are highly needed. Generally speaking, there are two strategies to gather data: the push and the pull model, which are similar to those considered in the field of distributed and mobile databases. In a push model, each vehicle senses the data and proactively uploads data to a central server through V2V or V2I communications, and requests or queries are directed to the server to fetch the requests [7]–[9]. The push model incurs larger overheads when duplicate messages or irrelevant data are pushed. In a pull model, a query is issued from a node or the cloud [10], [11]. Vehicles are able to resolve, route, and process those queries, and finally route back the query result to the query requester. Pull-based model provides more flexibility in terms of the types of queries [12], which could in principle be diffused far away to retrieve remote data. There are three steps in the query processing: 1) query requester diffuses the request to different data sources, either directly or by using multi-hop relaying techniques, 2) each node that receives the request computes a partial result based on its local data, and 3) the nodes deliver the result to the requester. However, most of existing pull-based schemes
Request
Answering in Vehicular Ad-hoc Networks
based
on Adaptive Filters
assume no fixed data server available in the VANET, and only the resource of the in-network vehicular nodes is considered [11]–[13]. Inevitably, those approaches incur relatively large delays, especially in the VANET environment. The delay, on the other hand, would result in the failures of query result deliveries because vehicular nodes would move to other locations during that period of time.
This paper aims to propose an adaptive and efficient data gathering system based on the pull/push request answering model. Specially, the concept of fog/edge computing and vehicular sensing are adopted for the system design. Fog computing extends the traditional cloud computing paradigm to the edge of networks [5], [8], [14], where fog nodes are a new kind of nodes that are capable of carrying out a substantial amount of storage (rather than storing primarily in cloud data centers), communication (rather than routing over the internet backbone), control, configuration, measurement and management. Fog nodes, also called edge nodes, are able to gather and maintain metadata about the network, requests, and vehicles. These gathered metadata are then used to generate filters that adaptively control the passages of data readings and requests, pruning unnecessary data transmissions. The main contributions of this paper are as follows:
1) We propose a filter-based framework called FERA (Filter-based Efficient Request Answering) that com-bines the pull/push strategies to adaptively and effi-ciently process the requests in VANET. Data readings that could pass through the filters are forwarded to higher layers, and those blocked are stored at the current layer. Requests are forwarded up to edge nodes and the cloud to extract matched data. If a request is satisfied, the results will be forwarded back to the source of the request. If a request is unsatisfied, i.e. it does not find any matched data, it will be directed and forwarded down to edge nodes and ordinary nodes to further search the requested data.
2) We conduct experiments based on simulations to demon-strate the effectiveness of the proposed scheme in ve-hicular sensing and request answering applications. Up to 85% of the queries could be successfully processed in the proposed scheme, which is higher than existing query schemes and at the same time with a relatively low transmission cost.
The rest of the paper is structured as follows. Section II describes the related work; section III introduces some prelim-inaries and defines the filters and the network model; section IV presents the overall procedures and cost analysis of the request answering framework; section V describes the details of updating filters; section VI describes the environmental setup and analyzes the simulation results; finally, section VII concludes the paper.
II. RELATEDWORK
Vehicles could be viewed as powerful mobile sensors, and numerous recent research works in vehicular networks have addressed the problem of data gathering or request answering.
In this section we review three categories of related works to position our work in the research community.
The solutions of queries and request answering could roughly be categorised into three types: the push based, the pull based, and the pull/push based. Push means to install conditions within the network and trigger data transmission when these conditions are met. Lee et al. [7] proposed the MobEyes system for proactive urban monitoring. The system exploits the vehicle mobility to opportunistically diffuse con-cise summaries of the sensed data, harvests these summaries, and builds a low-cost distributed index of the stored data to support various applications. Palazzi et al. [9] proposed a delay-bounded vehicular data gathering approach, which exploits the time interval to harvest data from the region of interest satisfying specified time constraints, and properly alternates the data muling and multi-hop forwarding strategies. Muhammad et al. [15] proposed a proactive data dissemination scheme for pushing critical content to one-hop neighbours in VANET. It treated content categorically and allowed pushing of content when necessary.
Pull means to have the data requester or query requester to request particular data, where the query processing belongs to this type. Mehul et al. [10] proposed the PeopleNet that relies on the existence of a fixed network infrastructure to send a query to an area that may contain relevant information, and extract the query results. Abadi et al. [16] proposed the REED framework in wireless sensor networks, which is based on the TinyDB to store filter conditions in tables, and then distribute those tables throughout the network to extract the query results. Lee et al. [11] proposed a mobility assisted query dissemination scheme called FleaNet, where the node that submitted the query periodically advertises it only to its one-hop neighbors, which will see if they can provide some answers from information stored on their local storage. Similar to FleaNet, Zhang et al. [13] proposed a content sharing scheme called Roadcast, where a vehicular queries other encountered vehicles on the way. The keyword-based queries are submitted by the users and the scheme tries to return the most popular content relevant to the query. The researches use a “delay tolerant” strategy to handle the pull-alike requests, they can not meet the time requirements at streaming environment.
The push and pull strategy is to strike a balance between the two strategies to achieve better efficiency. It is first introduced in the area of wireless sensor network [16]–[18]. Adam [17] presented an overview of sensor network query processing and characterized it in the context of push versus pull techniques for data extraction. Lai et al. [19] proposed a partition-based algorithm for the external join processing in sensor networks. It organizes the sensory data of the network through an optimized “value-to-storage” mapping/filter, through which tuples can choose their joining point that incurs the least communication cost. Delot et al. [12] proposed the GeoVanet scheme, where data readings are pushed to a DHT-based fixed geographical locations that allow the user to retrieve his/her results in a bounded time.
Most of the above push/pull schemes work in a two tier static sensor networks. Their main focuses are on the routing and message forwarding mechanisms. And filters are usually assumed to be static and not adaptive, which downgrades their performances. The proposed scheme has three layers in VANET, and adaptively adjusts the states of filters according to the cost ratio to achieve better performance. The most related work is the CEB architecture (Cloud, Edge and Beneath) proposed by Yi et al. [20], which adopts the concept of optimal push/pull envelope to dynamically adjust the base push and pull rates for each sensor. However, CEB solely adjusts the push/pull based on the setting of data rates that are assumed prerequisite knowledge. On the contrary, in this paper we mainly focus on the design and setting of filters, which captures and reflects the pattern of match between requests and data readings.
III. PRELIMINARIES
A. Requests and Data
We assume a three layered VANET consisting of ordinary nodes, the edge nodes and the cloud. Each vehicle, vi,
monitors the road condition and surrounding environment through periodical sensing. Edge nodes provide storage and networking services between the vehicular nodes and the cloud. Data readings at ordinary nodes are denoted as data (s, t, d), where s is the source node, t is the timestamp of the data, d = d1, ..., dK is a K-dimensional data reading. Data
requests are submitted by users to get desired results. Without loss of generality, we assume requests are only issued from the vehicular nodes, and a request is denoted asreq(s, t, f, Γ), where s is the source node that generates the request, t is the time when request is issued, f is a filter describing the requested data, and Γ is the time interval of the requested data. On one hand, vehicular nodes push their readings to the edge nodes, and the edge nodes would further push some of the readings to the cloud to answer requests quickly and efficiently. On the other hand, the requests are forwarded to edge nodes and the cloud, and then forwarded down to the edge nodes or ordinary nodes to pull the matched data.
B. Filter
In this research, filters are assumed to be metadata that describe the ranges of data dimensions. A basic filter is denoted by f (a1, a2, ..., aK), where ai is the value range
or set of elements at the ith dimension.a
i is either a value
range when dimensiondi is continuous, or a set of elements
when dimensiondiis categorical. A readingdata(s, t, d1, d2,
..., dK ) is compatible to filter f (a1, a2, ..., aK) if the
follow-ing conditions are satisfied:
di∈ ai, i = 1, 2, .., K (1)
denoted asf (data) = true. Data readings are routed to their compatible filters, and the states of filters determine whether these readings could pass through or not. A basic filter has two states: “open” and “close”. If the filter is at “open” state, the data compatible to this filter would pass through the filter, else
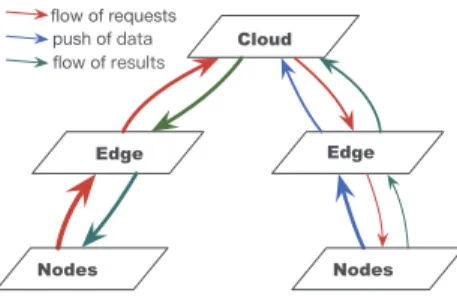
Edge Cloud Edge Nodes Nodes ßow of requests push of GDWD ßow of UHVXOWV
Fig. 1. Flow of requests, data, and results in request answering, where the thickness of lines indicates the amount of requests or data.
the data would be blocked. A reading data(s, t, d) answers requestreq (s, t, f, Γ), denoted by match(req, data) = true, if conditionf (req.f, data) = true holds.
C. Sliding Window
Requests and data arrive sequentially in a streaming en-vironment. In this study we maintain a sliding window to process the data requests within a time interval Γ. Window W is denoted by t1, t2, .., tm , where ti is theithtime slot.
The set of requests and data withinW are denoted by R and D respectively.
Requests and data readings are matched withinW to extract the requested data, where R ⋉ D denotes the set of matched requests, andD ⋉ R denotes the set of matched data:
R ⋉ D = {r|r ∈ R, ∃d ∈ D s.t. match(r, d) = true} (2) D ⋉ R = {d|d ∈ D, ∃r ∈ R s.t. match(r, d) = true} (3)
IV. FILTER-BASEDEFFICIENTREQUESTANSWERING
There are three layers in VANET: the ordinary nodes, the edge nodes, and the cloud. Filters are installed on ordinary nodes and the edge nodes to suppress unnecessary push of data readings.
Fig. 1 depicts the request answering procedures based on the pull/push strategy. On one hand, vehicular nodes push their readings to the edge nodes. Those that could pass through the filters are forwarded to higher layer, and those that are blocked are stored at the current layer. On the other hand, requests are forwarded to edge nodes and the cloud to extract the matched data. If a request is satisfied, i.e. finding its matched data, it will be stopped at the layer and the requested results are forwarded back to the source node of the request. If a request does not find its matched data, it will be forwarded down to the edge nodes and ordinary nodes to further query the requested data. The thickness of lines in Fig. 1 indicates the amount of requests or data.
In this section we present the overall description and cost analysis of the request answering framework, and in the next sections we will discuss the update mechanisms of filters and filter cubes.
Algorithm 1: Messages handling in the procedure of data push.
1 for alld generated at node s do
2 stored at s;
3 f = map(d); updateX(d, f ); 4 if f.state == “open′′ then 5 forwardd to Edge;
6 for alld received at Edge e do 7 stored at e;
8 f = map(d); updateX(d, f ); 9 if f.state == “open′′ then 10 forwardd to Cloud; 11 for alld received at Cloud do 12 stored at Cloud;
A. Overall Description
Algorithm 1 depicts the procedures of data push strategy. Data readings are generated and stored at ordinary nodes (line 2). Themap function returns compatible filter for data d, and function updateX(d, f ) updates the statistics of data about the filter (line 3). If the filter is at “open”state, data could pass through the filter and be forwarded to the edge node that currently covers the vehicular node (lines 1-5). Similarly, when the edge node receives data from ordinary nodes, it stores them, and updates the filter statistics and forwards the data to the cloud if the filter is at “open” state (lines 6-10). When the cloud receives data readings from edge nodes, it just stores them (line 12).
Algorithm 2 depicts the procedures of the data pull strategy. A request message is represented by r, x , where r is the request andx ∈ {U P, DOW N } denotes the direction of the request diffusion. When an ordinary node receives a request r, x , it first gets the compatible filter and updates the request statistic of the filter (line 2). If there are data readings in local storage that could answer the request, the data are routed to the source of the request, and the matching statistics about the filter are updated (lines 4). If there are not matched data and the direction of message is UP, the request is forwarded to the edge node that covers the vehicular node (line 6). Similarly, when an edge node receives a request, it checks its local storage, and data readings in the storage that could answer the request are extracted and routed to the source of the request, and the matching statistics about the filter are updated (line 8-10). If there are no matched data for the request, the request is handled according to the direction parameter. If the request is diffused up the network layer, it is forwarded to the cloud (line 12). If it is diffused down the layer, the request is broadcasted within the nodes covered by the edge node to search the matched data (line 14). When the cloud receives a request, it first searches its local storage for the match. If there are data readings that could answer the request, the data is routed back to the source of the request (line 17); otherwise,
Algorithm 2: Messages handling in the procedure of data pull.
1 for allr, x at Node s do 2 f = map(r); updateY (r, f ); 3 ifd ∈ s.D matches r then 4 router, d to source of r; 5 else if x==UP then
6 forwardr, x to Edge; 7 for allr, x received at Edge e do 8 f = map(r); updateY (r, f ); 9 ifd ∈ e.D matches r then 10 router, d to source of r; 11 else if x==UP then
12 forwardmsgr, x to Cloud; 13 else if x==DOWN then
14 broadcastmsgr, x to nodes;
15 for allr, x received at Cloud do 16 ifd ∈ Cloud.D matches r then
17 router, x to source of r; 18 else
19 for alle in Edge Nodes do
20 if match(r, e.f ) == true then 21 forwardr, DOW N to Edge e;
Algorithm 3: Procedure of sliding the window.
1 for each time slot do 2 slide forward windowW ;
3 for all filterf at nodes and edges do
4 calculate cost ratio off according to Eq. (5); 5 update state off ;
6 for alle at edges do
7 route update of filter to the cloud;
the request is forwarded down to edge nodes to search for the results (lines 19-21). Note that FERA maintains a copy of filters of all edge nodes in the cloud, so it could calculate a set of edge nodes whose filters could match the request, and the request is forwarded to these edge nodes.
The push and pull of data depends on the setting of filters installed in ordinary nodes and edge nodes. FERA adopts a sliding window to maintain statistics and states of the filters. Algorithm 3 is the pseudocode of the window sliding. At each time slot windowW is slid forward with two operations. First, the cost ratio of the filters at the node and edge nodes is calculated and the states of the filters are updated (lines 3-5). The cost ratio is calculated distributively among ordinary nodes and edge nodes based on the statistics of the data and requests. The calculation is performed according to Eq. 5 at
section 5, where the update operations are also discussed. Second, the update of the filter at each edge node is sent to the cloud (line 7), so the cloud has the knowledge of the latest distributions of data in the edge nodes.
V. UPDATE OFFILTERS
In real applications it is unknown whether the requests and data readings would match or not beforehand, yet we could estimate the matches through filters. Filters determine the passage or blockage of data readings at each layer of the network, so it strikes a balance between the push and pull of the data readings. The mechanism of filter design and update plays an important role for the performance of the request answering. In this section we present the details of the update of filters.
A. Cost of a Filter
Data readings would pass through a filter if the data are compatible with the filter and the filter is in the “open” state. Some of these data answer requests, and some might not match any requests. However, when the filter is at the “close” state, all its compatible data are blocked and not forwarded to the upper layer. So requests that are not matched at current layer have to be routed down to lower layers to extract the requested data.
We denote the set of data and the set of requests that are compatible with filter f within the time window as Df and
Rf respectively. Then the cost of state for filterf is calculated
as follows:
cost(f, “open”) = w0∗ |Df|
cost(f, “close”) = w0∗ |Df ⋉ Rf| + w1∗ |Rf|
(4)
where w0 is the factor for one-time data transmission, and
w1 is the factor for one-time request transmission and request
broadcasting.Df⋉Rfdenotes the set of data that are matched
with the requests inRf, and|X| denotes the total amount of
data in set X.
B. Criteria of State Change
The state of a filter is set and updated according to a cost metric. Ifcost(f, “close”) > cost(f, “open”), it is more efficient forf be in the “open” state, else it is better for f to be in the “close” state. In other words, if the cost ratio meets the following condition:
cost ratio(f ) = cost(f, close) cost(f, open) = w0∗ |Df⋉ Rf| + w1∗ |Rf| w0∗ |Df| = |Df⋉ Rf| |Df| +w1 w0 ∗|Rf| |Df| > 1 (5)
thenf is set “open” within a period of time. Here we define the data match ratioϕ(Rf, Df) and the request-to-data ratio
ρ(Df, Rf) as follows: ϕ(Df, Rf) = |Df ⋉ Rf| |Df| , ρ(Df, Rf) = |Rf| |Df| (6)
Formula 5 could be rewritten as:
cost ratio(f ) = ϕ(Df, Rf) +
w1
w0
∗ ρ(Df, Rf) > 1 (7)
If formula 7 holds, filterf is set to “open” state, else it is set to “close” state. In formula 6, the set Df andRf is assumed
not empty. Yet when|Df| = 0 or |Rf| = 0, the state of f is
simply set to “close” without further calculation.
C. Review Operation
The numbers of data and requests compatible with filterf are recorded at each time slot of a window, e.g.W . Sequences that indicate the amount of data and requests are denoted by Xf = [x1, x2, ..., xk] and Yf = [y1, y2, ..., yk] respectively,
wherek is the size of the window, xiandyiare the amount
of data contained in the data readings and requests at theith
time slot respectively. WhenW moves a time slot forward, the latest numbers are added asxk, yk, the oldest elementx1, y1
are removed, and other elements are updated accordingly: xi = xi−1, yi = yi−1. These update operations are denoted
by the functions updateX(d, f ), updateY (r, f ), which are illustrated in Algorithm 1 and 2.
Given a time windowW , the data match ratio and
request-to-data ratiodefined at formula 6 are calculated as follows:
ϕ(Df, Rf) = k 1min(xi, xi∗ yi) k 1xi , ρ(Df, Rf) = k 1yi k 1xi (8)
Here when there is not matched request at the ith time
slot, i.e. yi = 0, min(xi, xi∗ yi) would return zero. Hence
the unmatched data readings are pruned when calculating ϕ(Df, Rf). For each time slot, the algorithm recalculates the
cost ratio defined at formula 7 and determines whether to reset the filter state.
TABLE I
EXAMPLE OF SLIDING A WINDOW FORWARD AND CONDUCTING THE REVIEW OPERATIONS(w0= 1, w1= 2). ˆzINXf ANDYf MEANS THERE
ARE DATA READINGS OR REQUESTS OF SIZEzAT CURRENT TIME SLOT.
Time t t+1 t+2 Xf [05ˆ8] 0[58ˆ8] 05[88ˆ6] Yf [00ˆ4] 0[04ˆ0] 00[40ˆ4] ϕ(Df, Rf) 8/13 8/21 14/22 ρ(Df, Rf) 4/13 4/21 8/22 cost ratio 16/13 16/21 30/22 state “open” “close” “open”
Table I is an example that illustrates moving the window forward when conducting the review operation, where z inˆ Xf andYf means there are z readings or requests at current
time slot. Given w0 = 1 and w1 = 2, the ratios of filter
f are calculated according to formula 8, and the cost ratio at t, t+1, t+2 are calculated as: 16/13 = 8/13+(2/1)∗(4/13), 16/21 = 8/21 + (2/1) ∗ (4/21), 30/22 = 14/22 + (2/1) ∗ (8/22) in time t, t+1, t+2. So according to formula 7, the state off is set as “open”, “close”, “open” during the time period.
D. Storage of Filter Cube
The generation and update of filters, which we have dis-cussed in previous sections, also needs an efficient storage structure. In this study we adopt a lazy storage strategy that uses hash tables [21] to store filters within a cube.
Filter cubeF is split to segisegments on dimensiondi, i =
1..., K. So each cell is represented by an entry of a hash table H, i.e. key : [h1, h2, .., hK], value : {state, Xf, Yf, S} ,
where hi is the index for filter f on dimension di in cube
F , Xf, Yf are data sequence and request sequence defined at
section V-C, andS is data structure that stores how f is split whenf is at “more” state. A filter is only created when there are some data to be added to Xf or Yf. For filters or cells
that don’t have compatible data readings or requests, no entry is needed at the hash table, so large number of storage space could be saved. It is worth noting that other data structures that handle sparse data are also feasible for the storage of filter cubes, yet the detailed description of the data structure is out of the scope of this paper.
Filters are stored in a cube with equal cells. A data reading could mapped to dimensional indexes that are used to access the filter quickly. When a data reading or request arrives to a filter cube, it needs O(1) to locate the compatible filter. Moreover, a filter cube achieves two aspects of efficiency compared to the set of individual basic filters when doing the request answering. First, A filter cube F is built based on the basic cubeFb. The number of filters that it maintains
is reduced by a ratio of ||F||F || b||=
!K
1 |Di|
msi, where the splits at dimension Di is smaller than or equal to the maximal
split msi. In the cube building procedure we could also see
that||F || << ||Fb|| holds. Second, a lazy and spare storage
strategy is adopted for the cube storage. A large proportion of filters within a filter cube are “empty” filters because no data readings or requests are compatible to them. So they do not need any storage structure to maintain their statistics of the readings or requests.
VI. EXPERIMENTALSTUDY
A. Environment Setup
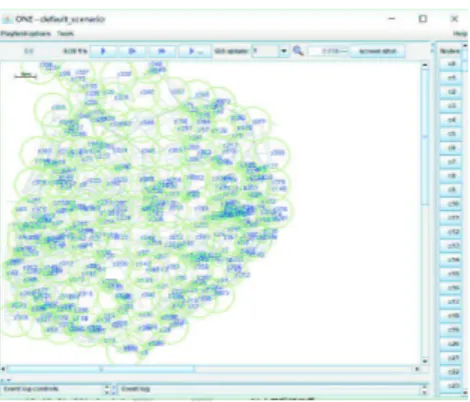
We conduct experiments on the ONE platform [22] with real-world road network to verify the performance of the proposed algorithm. The ONE is a popular simulation envi-ronment that is capable of generating node movement using different movement models and routing messages between nodes with various routing algorithms.
1) Trajectory Dataset and Network Setting: The Xiamen Taxi Dataset1is used for the simulation. The dataset contains
trajectories of about 5,000 taxis in Xiamen city, China during July 2014. The region is limited to [118.066E,118.197E] × [24.424N ,24.561N ], and maps provided from OpenStreetMap is used to build a road network. In the simulation, the most active 300 taxis are selected to act as vehicular nodes. Each vehicle moves along the historic trajectory. The moving speed
1http://mocom.xmu.edu.cn/xmdata
Fig. 2. Snapshot of the simulation field in Xiamen Island. The blue texts denote vehicular nodes, and green circles denote the coverage areas of RSUs.
ranges from 0 to 72 KM/h, which differs according to road segments and time periods.
There are 81 edge nodes (RSUs) evenly deployed in the map, and each edge node periodically updates its filters in the cloud every 60 seconds. The communication range of I2I or I2V used by the vehicles to exchange data is set to 200 meters. The total simulation time is 6 hours within a day, from 8:00 to 14:00. The size of sliding window is 5 minutes, and each time slot is 30 seconds. The ratio of unit cost w1
w0 defined in formula 7 is1/2 by default. As the proposed scheme belongs to the application layer of the network protocol stack, we assume ideal links when two nodes encounter and establish a connection. The size of a message is set 1024 Byte and the metadata are wrapped in one message per request. The bandwidth of the V2V or V2I channel is 500 Kbps/250 Kbps for the down/up links.
2) Data and Request Generator: Data reading is in the form(s, t, lat, lon, type, size), where s is the id of the node that generates the data,t is the time, lat, lon are the latitude and longitude of the location, andtype denotes the type of the generated data, and size is the detailed sampled data whose size corresponds the type of the data. In the experiment there are five types of data with a size within the set{16 K, 64 K, 512 K, 1024 K, 18 M}. Each vehicle periodically reports one data reading every 150 seconds, and we construct a request datagenerator to synthesise the data readings.
A request is in the formreq(s, t, f, Γ), where s is the source node that generates the request, t is the time when request is issued, f is a filter describing the requested data, and Γ is the time interval of the requested data. Here, the filter is defined as type, lat, lon ), where type denotes the type of the requested data,lat, lon are the latitude and longitude of the position to which the requested data belong. Also, the requests are generated from two ways: 1) each O-D pair is mapped to a request that is generated from the origin and targets the data readings from the destination, so the real-world origin-destination dataset is integrated into the request answering. Existing research [23] has disclosed that there are some spacial-temporal patterns in the OD pairs, which
(a) Success Ratio (b) Messages Fig. 3. Impact of queries intervals.
matches the request answering scenarios in this paper; 2) requests are generated in the form of Zipf’s law [24], where a skewness parameter determines where target locations of the requests. We construct a requestgenerator to control the generation process of requests, and the query rate, skewness, and deadlines are defined as parameters of the generator.
For both the data and requests, the domain of the latitude and longitude dimensions are [118.066 E, 118.197 E], [24.424 N, 24.561 N] respectively, as showed in Fig. 2. The deadline of query is five minutes, and the queries are generated according to uniform distribution from 2 to 5 seconds by default.
B. Performance Analysis
We compare the proposed FERA scheme with other schemes. Yet to the best of our knowledge, there are few research directly related to the request answering schemes in VANET, so for the performance comparison, we implement other four request schemes as follows:
• CLOUD: all sensed data are uploaded to a centralized
cloud server. Requests are processed at the cloud and results are routed back to the requested node;
• REED [16]: a pull based method where the sensed data are stored locally, and all requests are forwarded to RSUs and broadcasted to search the requested data readings;
• EDGE: all the sensed data are stored in the edge nodes (RSUs), and requests are forwarded to all edge nodes to search for the requested data readings;
• GeoVanet [12]: data readings are first pushed to a DHT-based fixed geographical locations, and requests are for-warded to this location to extract the matched data within a bounded time interval.
We vary the parameters to study their impacts on these schemes. The ratio of successful requests, the amount of mes-sage transmissions, and the time delay of request answering are used as the main metrics for the performance analysis.
1) Rate of Request: Queries are generated periodically by a
query interval, where a smaller interval means a larger number of queries. Fig. 3 depicts the impact of the query interval. From 3(a) we could see that the CLOUD approach achieves the best success query ratio, as high as 0.98, and the REED approach has the lowest query ratio that is around 0.07. The success ratios of FERA, EDGE and GeoVant are in the middle. Most of the failed requests are due to the fact that the vehicular node that issues the request will move to other places, and when the query results are returned, they can not find the requester. Also,
(a) Success Ratio (b) Messages
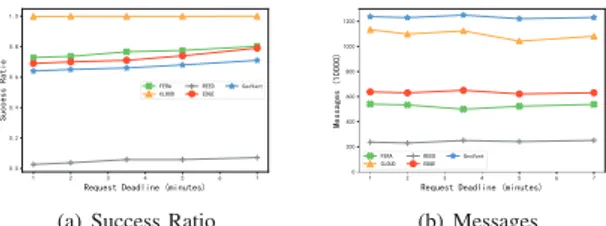
Fig. 4. Impact of request deadlines.
when the request is outdated, the request would be failed. Yet for the CLOUD approach, as all the data are uploaded to the centralized server, the query processing time is relatively small so the query results could be routed back to the requester just before they are moving out of the coverage of RSUs. However, the CLOUD approach also incurs large number of message transmissions, as depicted in Fig. 3(b). The success ratio of FERA is about 0.84 when the interval is (0.5,1], yet it decreases as the interval of queries increases. This is because when there are more queries, the pattern of the queries would be captured by the filters, which would adaptively adjust the states of filters and push more data readings to upper layers of the networks. In this way, the request processing time would be reduced and increase the success ratio of the requests.
Fig. 3(b) depicts the number of the messages. From the figure we could see that amount of messages decrease as the request interval increases. This is easy to explain as there are fewer requests when the request interval is larger. The GeoVant and the CLOUD have the largest amount of message transmissions. The message transmissions of the proposed FERA and EDGE are about 48-52 percent of those in the CLOUD and GeoVant. This is because in the former approaches only part of the data readings are pushed to upper layer of the network, yet in the latter approaches all the data readings are routed to the cloud or a hashed point, which incurs the largest transmission cost. It is worth noting that although the CLOUD has higher success ratio, due to the large number of vehicles, where each has to establish a connection with the cloud to upload its data readings, the CLOUD is actually infeasible in request answering scenarios.
2) Deadline of Request: Fig. 4 depicts the impact of the request deadlines. From the figure we could see that for all the approaches except CLOUD the success ratio increases as the request deadline increases. This is understandable as when the deadline of requester are larger, fewer requests would be outdated and failed. The success ratio of FERA increase from 0.728 to 0.802. The request deadline has a relatively small impact on the number of message transmissions.
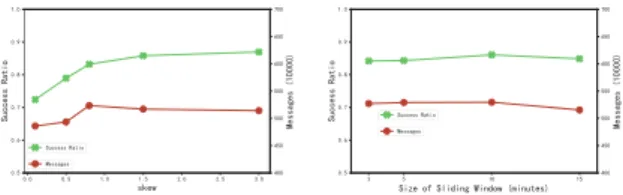
3) Skewness of Requests: Request generator has a skew-ness parameter that determines where target locations of the requests. In the experiment the map is split into 81 grids, and requests are generated in the form of Zipf’s law [24], where theskew parameter determines the skewness of requests targeting the grids. From Fig. 5, we could see that the success ratio of FERA increases from 0.72 to 0.86 when the skewness
Fig. 5. Impact of query skewness. Fig. 6. Impact of sliding window.
parameter increases from 0.1 to 3. Higher skewness means more requests are routed to the same grids, hence it facilitates the filters to control their states effectively. The message trans-missions first increase with the skewness, and then decrease with the skewness factor. When skewness is low, the requests are distributed among grids. Each RSU would receive smaller amount of requests, and the filters would be more likely to be in the“close” state. So the message transmissions are smaller compared with that when the skewness is larger.
4) Size of Sliding Window: FERA uses a sliding window to control the states of the filters. So in the experiment we vary the window size to study its impact on the performance. As showed in Fig. 6, the success ratio achieves the best performance at 0.86 when the size is 10 minutes. A window size either too smaller (e.g. 2 minutes) or too larger (e.g. 15 minutes) does no good for utilising the patter of requests, which harms the success ratio. The size of sliding window has a relatively smaller impact on the message transmissions. The number of messages decreases a little when the window size is large. This is because a larger window makes it harder to change the states of filters, and hence the data readings would be blocked by the “closed” filters.
VII. CONCLUSIONS
In this paper we propose a filter-based framework called FERA (Filter-based Efficient Request Answering) that com-bines the pull/push strategies to adaptively and efficiently process the requests in VANET. Data readings that could pass through the filters are forwarded to higher layer, and those blocked are stored at the current layer. Requests are forwarded up to edge nodes and the cloud to extract matched data. Ex-periments based on simulations are conducted to demonstrate the effectiveness of the proposed scheme in vehicular sensing and request answering applications. Up to 85% of the queries could be successfully processed in the proposed scheme, much higher than existing query schemes, while at the same time with a relatively low transmission cost.
For the future work, we are going to further optimise the structure of filters, e.g. the dynamic update and propose data structures that could store and update the filters efficiently.
REFERENCES
[1] Y. Lai, F. Yang, L. Zhang, and Z. Lin, “Distributed public vehicle system based on fog nodes and vehicular sensing,” IEEE Access, vol. 6, pp. 22 011–22 024, 2018.
[2] G. Pau and R. Tse, “Challenges and opportunities in immersive vehicular sensing: lessons from urban deployments,” Signal Processing: Image Communication, vol. 27, no. 8, pp. 900–908, 2012.
[3] Y. Lai, F. Yang, J. Su, Q. Zhou, T. Wang, L. Zhang, and Y. Xu, “Fog-based two-phase event monitoring and data gathering in vehicular sensor networks,” Sensors, vol. 18, no. 1, p. 82, 2017.
[4] S. Al-Sultan, M. M. Al-Doori, A. H. Al-Bayatti, and H. Zedan, “A comprehensive survey on vehicular ad hoc network,” Journal of Network and Computer Applications, vol. 37, pp. 380 – 392, 2014.
[5] A. Dua, N. Kumar, and S. Bawa, “A systematic review on routing protocols for vehicular ad hoc networks,” vol. 1, no. 1. Elsevier, 2014, pp. 33–52.
[6] D. Jiang and L. Delgrossi, “Ieee 802.11 p: Towards an international standard for wireless access in vehicular environments,” in Vehicular Technology Conference, 2008. VTC Spring 2008. IEEE. IEEE, 2008, pp. 2036–2040.
[7] U. Lee, B. Zhou, M. Gerla, E. Magistretti, P. Bellavista, and A. Corradi, “Mobeyes: smart mobs for urban monitoring with a vehicular sensor network,” IEEE Wireless Communications, vol. 13, no. 5, pp. 52–57, 2006.
[8] T. Wang, Y. Li, G. Wang, J. Cao, M. Z. A. Bhuiyan, and W. Jia, “Sustainable and efficient data collection from wsns to cloud,” IEEE Transactions on Sustainable Computing, 2017.
[9] C. E. Palazzi, F. Pezzoni, and P. M. Ruiz, “Delay-bounded data gathering in urban vehicular sensor networks,” Pervasive and Mobile Computing, vol. 8, no. 2, pp. 180–193, 2012.
[10] M. Motani, V. Srinivasan, and P. S. Nuggehalli, “Peoplenet: engineering a wireless virtual social network,” in Proceedings of the 11th annual international conference on Mobile computing and networking. ACM, 2005, pp. 243–257.
[11] U. Lee, J. Lee, J.-S. Park, and M. Gerla, “Fleanet: A virtual market place on vehicular networks,” IEEE Transactions on Vehicular Technology, vol. 59, no. 1, pp. 344–355, 2010.
[12] T. Delot, N. Mitton, S. Ilarri, and T. Hien, “Geovanet: A routing pro-tocol for query processing in vehicular networks,” Mobile Information Systems, vol. 7, no. 4, pp. 329–359, 2011.
[13] Y. Zhang, J. Zhao, and G. Cao, “Roadcast: a popularity aware content sharing scheme in vanets,” ACM SIGMOBILE Mobile Computing and Communications Review, vol. 13, no. 4, pp. 1–14, 2010.
[14] F. Bonomi, R. Milito, J. Zhu, and S. Addepalli, “Fog computing and its role in the internet of things,” in Proceedings of the first edition of the MCC workshop on Mobile cloud computing. ACM, 2012, pp. 13–16. [15] M. F. Majeed, S. H. Ahmed, and M. N. Dailey, “Enabling push-based critical data forwarding in vehicular named data networks,” IEEE Communications Letters, vol. 21, no. 4, pp. 873–876, 2017.
[16] D. J. Abadi, S. Madden, and W. Lindner, “Reed: Robust, efficient filtering and event detection in sensor networks,” in Proceedings of the 31st international conference on Very large data bases. VLDB Endowment, 2005, pp. 769–780.
[17] A. Silberstein, “Push and pull in sensor network query processing,” in Southeast Workshop on Data and Information Management (SWDIM06), Raleigh, North Carolina, 2006.
[18] Y. Lai, J. Xie, Z. Lin, T. Wang, and M. Liao, “Adaptive data gathering in mobile sensor networks using speedy mobile elements,” Sensors, vol. 15, no. 9, pp. 23 218–23 248, 2015.
[19] Y. Lai, Y. Chen, and H. Chen, “In-network execution of external join for sensor networks,” in Web-Age Information Management, 2008. WAIM’08. The Ninth International Conference on. IEEE, 2008, pp. 78–85.
[20] Y. Xu, S. Helal, and M. Scmalz, “Optimizing push/pull envelopes for energy-efficient cloud-sensor systems,” in Proceedings of the 14th ACM international conference on Modeling, analysis and simulation of wireless and mobile systems. ACM, 2011, pp. 17–26.
[21] T. H. Cormen, Chapter 11: Hash Tables, Introduction to algorithms. MIT press, 2009.
[22] A. Ker¨anen, J. Ott, and T. K¨arkk¨ainen, “The ONE Simulator for DTN Protocol Evaluation,” in SIMUTools ’09: Proceedings of the 2nd International Conference on Simulation Tools and Techniques. New York, NY, USA: ICST, 2009.
[23] D. Guo, X. Zhu, H. Jin, P. Gao, and C. Andris, “Discovering spatial pat-terns in origin-destination mobility data,” Transactions in GIS, vol. 16, no. 3, pp. 411–429, 2012.
[24] M. E. Newman, “Power laws, pareto distributions and zipf’s law,” Contemporary physics, vol. 46, no. 5, pp. 323–351, 2005.