UNIVERSITE DU QUEBEC
MEMOIRE PRÉSENTÉ À
L'UNIVERSITÉ DU QUÉBEC À CHICOUTIMI
COMME EXIGENCE PARTIELLE
DE LA MAÎTRISE EN INGÉNIERIE
Par
Maryam Ghalkhani
Contribution to the Improvement of the Dissolved Gas
Analysis Techniques
Contribution à l'Amélioration des Techniques de Diagnostics
par Analyse des Gaz Dissous
Abstract
There is a general agreement that in service conditions the quality of mineral insulating oils gradually deteriorates under the impact of electrical, thermal and environmental stresses. It is also widely accepted that only the incipient electrical failures such as hot spots and partial discharges are responsible for the gassing of oil. Knowing that the resulting fault gases dissolve in the oil, the technique of Dissolved Gas Analysis (DGA) was developed to detect incipient failures in the transformer. DGA has now become a standard in the utility industry throughout the world and is considered to be the most important oil test for insulating liquids in electrical apparatus. More importantly, an oil sample can be taken at anytime from most equipment without having to take it out of service, allowing a "window" inside the electrical apparatus that helps with diagnosing and trouble-shooting potential problems. This thesis intends to show that the gassing of oil is a more complex phenomenon.
In order to emphasize the role played by contaminants in the gassing of oil, fundamental investigations were undertaken. The amount of gases evolved under the impact of electrical stress (ASTM D6180) by a sample of new and aged oil with/without paper was accurately measured along with some physicochemical properties, to assess the relationship between the cause and the symptoms of oil or oil-paper insulation deterioration. The outcome of these investigations provided experimental evidence that the chemical composition of hydrocarbon blend, the oil born decay products and the solid insulation are also contributing factors to oil gassing. Since this finding may affect the diagnostics predicted by some DGA techniques, some thorough investigations were performed. New, aged oil and reclaimed aged oil samples were submitted to thermal and electrical stresses (considering various scenarios) and the dissolved gases analyzed by chromatography. Three of the most used DGA techniques, namely the Duval's Triangle Roger's and Domenburg's ratios were implemented in Labview based software to predict the diagnostic. The obtained results provide experimental evidence that oil born decay products may affect the diagnostics predicted by some DGA techniques. Although such a research is still in a preliminary stage, some very stimulating results have been obtained.
Résumé
II est généralement admis, qu'en conditions de service, la qualité des huiles minérales isolantes se détériore progressivement sous l'effet des contraintes électriques, thermiques et environnementales. Il est également largement admis que seules les défaillances électriques naissantes telles que les points chauds et les décharges partielles sont responsables du dégazage de l'huile. Sachant que les gaz ainsi produits par les défauts se dissolvent dans l'huile, la technique d'analyse de gaz dissous (AGD) a été mise au point pour détecter les défaillances dans le transformateur. L'AGD est maintenant devenu un standard dans l'industrie à travers le monde et elle est considérée comme le test le plus important dans les appareillages électriques isolés à l'huile. Plus important encore, un échantillon d'huile peut être pris à tout moment, de la plupart des équipements, sans avoir à le mettre hors service, pour le diagnostic et le dépannage d'éventuels problèmes. Ce mémoire se propose de montrer que le gazage dans l'huile est un phénomène complexe.
Afin de souligner le rôle joué par les contaminants dans le dégazage de l'huile, des investigations fondamentales ont été entreprises. La quantité de gaz qui se dégage sous l'effet de la contrainte électrique (ASTM D6180) d'un échantillon d'huile neuf ou vieilli avec/sans papier a été mesurée avec précision ainsi que certaines propriétés physico-chimiques, afin d'évaluer la relation entre la cause et les effets de la détérioration de l'isolation de l'huile ou de l'huile-papier. Le résultat de ces investigations a fourni des preuves expérimentales que la composition chimique d'un mélange d'hydrocarbures, les produits issus de la décomposition de l'huile et de l'isolation solide sont également des facteurs qui contribuent à la génération de gaz dans l'huile. Etant donné que cette découverte pourrait affecter les diagnostics prédits par certaines techniques de l'ADG, certaines investigations approfondies ont été réalisées. Des échantillons d'huile neuve, âgée et régénérée ont été soumis à des contraintes thermiques et électriques (en considérant différents scénarios) et les gaz dissous analysés par chromatographie. Trois des techniques de l'ADG les plus utilisées à savoir le Triangle de Duval, Roger et le Ratio de Dôrnenburg ont été implémentées dans le logiciel Labview pour prédire le diagnostic. Les résultats obtenus fournissent la preuve expérimentale que les produits de la décomposition de l'huile peuvent affecter les résultats de diagnostic prédis par certaines
techniques de l'ADG. Bien qu'une telle recherche soit encore à un stade préliminaire, certains résultats encourageants ont été obtenus.
Dedicated to:
My loving and supportive family:
My beloved parents, Allah Bakhash and Nahid
My lovely sister and Brother\ Parvin and Reza
&
My dear husband Sayyed Mahdi
Acknowledgments
To start with, I am thankful to almighty providence, God, who lends me life, the faith and for all mercies he has blessed me greatly in all the work, specially my kind spouse.... I am most grateful for having the opportunity to continue my education in the Master's research program offered by UQAC.
I would like to thank hearty Prof. I. Fofana, my director for his support, supervision, guidance, encouragement, motivation and patience in this endeavor. I will forever be indebted to him for showing his interest, generous help during my Master's studies, Special thanks to
Dr. H. Hemmatjou, my co-director and mentor for his patience and guidance. I am
particularly grateful for all of his time and help during last two years.
I am also grateful to Dr. H. Ezzaidi and Dr. Fethi Meghnefi for accepting to be jury members and for their constructive criticism which contributed to improve the quality of this thesis.
I would like to express my thanks to Dr. Janvier Sylvestre N'CHO from Institut National Polytechnique Félix HOUPHOUËT-BOIGNY, for his valuable comments during my evaluation thesis.
Most importantly, none of this would have been possible without the love and patience of my family. I want to extend my warmest thanks to my parents, sister and brother for all the love, support, advice and encouragement they have given me. I can't express my gratitude for my mom in words, whose unconditional love has been my greatest strength. I am especially grateful to them for teaching me to be ambitious and for always believing in me throughout my life.
Last but not least, I would like to express my deepest gratitude to my beloved husband, Sayyed Mahdi Ale Emran, for his true love and patience. He has always found the right words to cheer me up and his faith in me gave me strength to carry on. I look forward to my future with him and to more great moments.
Table of Contents
Abstract II Résumé Ill Acknowledgments VI List of Figures X List of Tables XII Abbreviations and Symbols XIII
Chapter 1
General Introduction 1
1.1 Background 2 1.2 Research Problem 3 1.3 Objectives 4 1.4 Methodology 5 1.4.1 Dehydratation system (degassing and dehumidification) 5 1.4.2 Accelerated aging procedure 6 1.4.3 Water Content (ASTM D 1533): 7 1.4.4 Acidity (ASTM D 974): 8 1.4.5 Interfacial Tension (ASTM D 971): 9 1.4.6 Turbidity (ASTM D 6181): 10 1.4.7 Dissolved Decay Product (ASTM D 6802): 10 1.4.8 Partial discharge: 11 1.4.9 AC breakdown discharge (ASTM D 877): 11 1.4.10 Dissolved Gas Analysis (ASTM D 3612A): 12 1.4.11 Stability test for mineral insulating Oils (ASTM D 6180-05) 13 1.5 Statement of the originality of the thesis 14 1.6 Overview of the Thesis 15Chapter 2
Literature review 16
2.1 Introduction 17 2.2 The Gassing of Oil 18 2.2.1 DGA most used Interpretation Techniques 22 2.2.2 Traditional DGA methods 23 2.3 Summary 24Chapter 3
Implementation of some methods inLabview 25
3.1 Introduction 26 3.2 Realized work in Labview.. 26 3.2.1 Roger's Ratio Method 28 3.2.2 Dornenburg's Ratio Method 29 3.2.3 Duval Triangle Method 31 3.3 Summary 33Chapter 4
Gassing stability of oil and complex oil-paper system under electrical
discharge 34
4.1 Introduction 35 4.2 Experimental setup 37 4.3 Results and discussions 38 4.3.2 Dissolved Decay Product (DDP) 41 4.3.3 Interfacial tension (IFT) 43 4.3.4 Water content in transformer oil 43 4.4 Summary 44Chapter 5
Impact of aging by-products on DGA techniques 46
5.1 Introduction 47 5.2 Experimental setup 47 5.2.1 Reclamation by Fuller's Earth (FE) 47 5.2.2 Partial discharge 50 5.2.3 Breakdown 52 5.2.4 Thermal stress 55 5.2.4.1 Thermal faults 57 5.3 Summary 62Chapter 6
Conclusions and Recommendations 63
6.1 Conclusions 64 6.2 Recommendations 65References 66
List of Figures
Figure 1.1'. Two-stage drying and degassing unit developed at UQAC. 6 Figure 1.2. Mechanical Convection (Model DKN-900) 7 Figure 1.3. Karl Fischer (Model KF 831) 8 Figure 1.4. Setup for measuring the acidity of liquid 9 Figure 1.5. Tensiometer for measuring the interfacial tension of a liquid. 9 Figure 1.6. Turbidity meter for measuring cloudiness of liquid. 10 Figure 1.7. Spectrophotometer for measuring the relative dissolved decay products in oil ...10 Figure 1.8. Test cell of partial discharge test 11 Figure 1.9. Model LD75 liquid dielectric test set 12 Figure 1.10. Gas chromatograph (GC) 13 Figure 2.1. Functional based classification of oil properties [4] 17 Figure 2.2. Potential causes of insulating liquid gassing 19 Figure 2.3. The decomposition of oil/paper caused by incipient failures [21] 20 Figure 2.4. Sketch of insulating oil decaying processes, inside a free breathing power
transformer [22] 21
Figure 3.1. Overview of the Main interface ofthe Labview program 27 Figure 3.2. Block diagram of the program 28 Figure 3.3. Implementation of Roger's method in Labview 29 Figure 3.4. Example of Roger's fault 29 Figure 3.5. Dornenburg's ratio method in Labview 30 Figure 3.6. Example of Dornenburg's fault 31 Figure 3.7. Duval's Triangle in Labview 32 Figure 3.8. Example of DuvaVs fault 32 Figure 4.1. Discharge cell according to ASTMDesignation D6180 [10] 37 Figure 4.2. The gassing tendency of new and aged oil samples without paper. 38 Figure 4.3. The gassing tendency of combined aged oil-paper (with and without paper) 39 Figure 4.4. The gassing tendency of new and aged oil with 10% of paper as per D6180 39 Figure 4.5. The gassing tendencies of new and aged oil samples with 30% of paper, according
WD6180 40
Figure 4.6. Comparison of Turbidity (D6181) before & after D6180 stability test 41 Figure 4.7. Absorbance illustrating the Dissolved Decay Products of new oil before and after
D6180 41
Figure 4.8. Absorbance illustrating the Dissolved Decay Products of new oil and aged (500 h,
1000 h and 2000 h) oil before and after D6180 42
Figure 4.9. Water content assessment in oil sample before and after D6180 44 Figure 5.1. Comparative summary of 1000 h aged oil properties before and after reclamation.
49
Figure 5.2. Summary of the fluids properties after Partial discharge application 52 Figure 5.3. Test vessel and setup for local heating of the insulating liquid [35] 56 Figure 5.4. Comparative summary of the fluids properties after Thermal test (20 A) 60 Figure 5.5. Comparative summary of the fluids properties after Thermal test (3A) 61
List of Tables
Table 2.1.Comparison of some diagnosis methods [7] 23 Table 3.1. Roger's Ratio Method 28 Table 3.2. Dôrnenburg's Ratio Method. 30 Table 3.3. Dornenburg's LI Limits 30 Table 4.1. DDP results for new and aged oil samples before and after D6180 42 Table 4.2. IFT results assessments before and after D6180 43 Table 4.3. Insulating fluid samples assessment before D6180 stability test. 45 Table 4.4. Insulating fluid samples assessment after D6180 stability test 45 Table S.l.Dissolved gas extracted from the samples before & after reclamation 48 Table 5.2. Summaiy the oil properties before reclamation process 49 Table 5.3. Dissolved gases extracted from the samples after application ofPD 50 Table 5.4. DGA diagnostic assessment's after application of partial discharge 50 Table 5.5. Dissolved gases extracted from the samples after application ofPD 51 Table 5.6. DGA diagnostic assessment's after application of partial discharge stress 51 Table 5.7. Summary of the fluids properties submitted to partial discharge stress 51 Table 5.8. Dissolved gases extracted from the samples after application of 50 breakdown tests.
53
Table 5.9. DGA after application of 50 breakdown tests in the oil samples 53 Table 5.10. Dissolved gases extracted from the samples after application of 50 breakdown
tests 54
Table 5.11. DGA results after application of 50 breakdown tests in the oil samples 54 Table 5.12. Some oil properties submitted to breakdown test before and after reclamation... 55 Table 5.13. Dissolved gases extracted from the samples after thermal stress (20 A) 58 Table 5.14. DGA after application of Thermal (20 A) test in the oil samples 58 Table 5.15. Dissolved gases extracted from the samples submitted to Thermal stress (20 A). 59 Table 5.16. DGA after application of Thermal stress (20 A) to the oil samples ...59 Table 5.17. Dissolved gases extracted from the samples after thermal stress (3 A) 60 Table 5.18. DGA assessment's after application of Thermal (3A) test in the oil samples 61
Abbreviations
DGA IEEE ASTM TAN IFT NTU DDP PDIV DP 2-FAL FTIR ANNs RRM DRM KGM NN MIN OQINand Symbols
Dissolved Gas Analysis
Institute of Electrical and Electronics Engineers American Society for Testing and Materials Total Acid Number
Interfacial tension
Nephelometric Turbidity Units Dissolved Decay Product
Partial Discharge Inception Voltage Degree of Polymerization
Furfuraldehyde
Fourier Transform Infrared Artificial Neural Networks Roger's Ratio Method Dôrnenburg's Ratio Method Key Gas Method
Neutral Number Myers Index Number Oil Quality Index Number
Chapter 1
Chapter 1
General Introduction
1.1 Background
Power transformers are important and one of the costliest equipments used in the transmission and distribution of the electric energy. Despite great progresses in power equipment design in recent years, the weak link in the chain still remains the insulation system. When power transformers fail, the fault can be traced usually to defective insulation [1-2]. Unexpected failures cause major disturbances to operating systems, resulting in unscheduled outages and power delivery problems. Extreme reliability is demanded of electric power distribution as when failures occur they inevitably lead to high repair costs, long downtime and possible personnel safety risks. In addition, environmental aspects such as consequential damages, fire and pollution are of high risk. Transformer failures can cost up to $15 million, in addition to an operator's reputation. These enormous costs provide ample incentive for electric companies to ensure reliability and availability throughout the life cycle of these important assets. Early detection of problems can reduce repair costs by 75 percent and loss of revenue by 60 percent, and that annual cost savings equal to 2 percent of the price of a new transformer - i.e., approximately $40,000 to $80,000 - can be achieved [3]. By accurately monitoring the condition of oil, many types of faults can be detected before they become serious failures and outages. The analysis of transformer oils not only provides information about the oil, but also enables the detection of other potential problems, including contact arcing, ageing insulating paper and other latent faults and is an indispensable part of a cost efficient electrical maintenance program.
Although the cost of transformer oil represents only 5% of the total cost of a power transformer, its stability plays an important role in the safe operation and aging process of this expensive machine. While in service, both oil and solid insulation of windings undergo a slow but steady decay process under the impact of electrical, thermal, mechanical and chemical stresses. Recent studies [4] have shown that the gassing of oil has an important side effect. The breakdown of hydrocarbon chains generates not only soluble gases, as it is currently believed, but also colloidal suspensions.
Many key analytical tests, providing a "picture" of the fluid or the solid insulation "health", have been studied, normalized in standards and finally taken as criterion for monitoring power transformers. So far, transformers still fail because of their insulation failure. Satisfying/accurate criteria have to be found to improve the issue.
1.2 Research Problem
The procedures used in the past to analyze gassing of transformer oil have generally been inadequate. The fundamental shortcomings of DGA are underscored by IEEE STD C57.104 [5] as follows: "Many techniques for the detection and the measurement of gases have been established. However, it must be recognized that analysis of these gases and interpretation of their significance is at this time not a science, but an art subject to variability". Further, "The result of various ASTM testing round robins indicates that the analytical procedures for gas analysis are difficult, have poor precision, and can be wildly inaccurate, especially between laboratories". Finally, "However, operators must be cautioned that, although the physical reasons for gas formation have a firm technical basis, interpretation of that data in term of the specific cause or causes is not an exact science, but is the result of empirical evidence from which rules for interpretation have been derived". About twenty DGA interpretation techniques have been developed so far [5]. Commercial packages exist that implement individually such methods. Several individual DGA users have also developed their own graphical software. Since all these methods are based on heuristic and not on scientific formulation, combined DGA diagnostic may reduce the risk of mistaken diagnostics and enhance accuracy [6].
So far, few pitfalls, that may affect the analyses, have been emphasized on DGA testing, namely [7]:
• Gases produced not as a result of incipient fault condition • Leaking between tap changers and main tank
• Welding producing acetylene and other gases
• Out-gassing of paints and gaskets, (which are usually CO and CO2) • Galvanic reactions (i.e. steel + water + 0 2 = hydrogen production)
• lower voltage transformers having higher CO and CO2 values as a result of non-vacuum treatment, oxygen + heat
• Stray gassing characteristics • Contaminants produce gases
• Decomposition of additives such as passivators can produce gases as well (H2 & CO2)
It is evident that new procedures for analyzing the DGA results are needed. Scientifically sustainable techniques can significantly improve the ability to determine the incipient electrical failures, maintenance requirements, and necessary replacements, help determine the need for additional spare transformers, reduce reliability risks and diminish costs.
Basically, the breakdown of certain unstable hydrocarbon molecules is dependent on two major factors: the chemical composition of the blend and the incipient electrical failures. ASTM Standard Test Method for gassing of oil assesses the behavior of new oils in brand new transformers. Hence, oil and transformer manufacturers perform this test. Although the oil is also gassing in operating conditions, neither the IEEE Guide C37.104 [8] nor the IEEE Guide C57.104 [5] requires the determination of gassing. Consequently, the cause of oil decomposition can be the inappropriate chemical composition of the oil or an incipient electrical failure.
Lately, attempts have been made to improve the situation. An alternative technique to the existing ASTM gassing test D 2300 [9] was developed. ASTM approved this test in 1998 as Designation D 6180 [10]. Unlike the test included a long time ago in the standard specification for new oils, the new one can measure the amount of gas evolved by any oil whether it is new, aged in service, reconditioned or reclaimed. Nevertheless, no commercial laboratory performs it for the same reason already mentioned. There is no market for a new test as long as it is not included in a document elaborated by a professional organization. A prompt review of these new procedures is needed.
1.3 Objectives
The main objective of this project is primarily aimed at understanding the mechanisms involved in the gassing phenomena of insulating fluids which are still poorly understood despite extensive work carried out. This research project involves fundamental studies on the role played by oil aging byproducts, onto the insulating liquids gassing.
Fundamental studies using modern equipments, involving mainly optical diagnostics (turbidity, spectrophotometry,...), electrical and thermal stresses, and physico-chemical (Gas Chromatography, Acidity, Interfacial Tension, etc..) will be performed. All these works should allow emphasizing the influence of oil degradation on the DGA interpretation.
1.4 Methodology
To study the influence of all type of contaminant present in the oil, various scenarios were considered. Investigations were therefore performed on:
Dehydrated and degassed new oil.
Aged oil (of the same brand with new oil) in laboratory conditions. Aged oil-paper in laboratory condition.
New oil and the same aged oil submitted to 5 hours electrical stress (using ASTM D 6180 test cell [10]).
New oil-paper (30% and 50% of paper) and the same aged oil-paper (30% and 50% of paper) submitted to 5 hours electrical stress (using ASTM D 6180 test cell [10]). Reclaimed (by Fuller's Earth) aged oil.
DGA testing of oil samples before and after application of electrical and thermal stress to new oil, the same aged and reclaimed aged oil.
Fuller's Earth removes both moisture and neutralizes carboxylic acids. In the ISOLIME laboratory made-plant, oil is heated at 60 °C when passing through the activated Fuller's Earth cartridge to remove acids and impurities. The reclamation rejuvenates the transformer oil by eliminating contaminants formed due to entry of foreign particles, oxidation of oil and insulation deterioration, sludge formation, thermal cracking, etc. These oil samples were submitted to thermal and/or electrical stress, and DGA and gassing tendency investigated.
1.4.1 Dehydratation system (degassing and dehumidification)
In the present project, the mineral oil was degassed and dehumidified before starting the tests. The drying and degassing of the liquids took place in a two-stage drying unit developed at UQAC, which is sketched in Figure 1.1. The preparation guarantees very low gas contents of less than 0.5% and also a very low water content of less than 5 ppm.
1 Column stage 2 Pump 3 Fine filter 4 pressure reducer 5 Heat exchanger 6 lst.Column stage 7 Raschig rings
8 Vacuum measuring tube 9 Ventilation valve 10 Vacuum pump 11 Storage tank 12 2nd Column stage 13 Collecting tank 14 Thermostat
1.4.2 Accelerated aging procedure
The mechanism of ageing is a complex inter-disciplinary phenomenon. Insulating material ageing /degradation can be defined as an irreversible deleterious change to the serviceability of an insulation system. The primal process is that the chemical and physical bonds between the atoms of the insulation substance are repeatedly broken, reorganized and reformed into new configurations. Over time, the individual atomic processes collectively will give rise to microscopic and ultimately to macroscopic and recognizable change in the insulation substance and its ability to ftmction.The ageing or deterioration of insulating oil is normally associated with oxidation under the very harsh environment. Electrical stress together with heat and moisture in the presence of a catalyst (e.g. oxygen from air) oxidises the oil producing free radicals, acids and sludge. Ageing is a gradual change of oil state and its properties that usually leads to a degree of breakdown. Because the general life is much
longer than the research duration, the investigations were based on studying the aging effect with increased speed. The ageing procedure was done by placing oil specimens in a convection oven (Figure 1.2) at 100 °C and aging them for an extended specific period, with/without air (oxygen) inlet. Typical transformer proportions of copper, aluminium, zinc and iron (each 3 g/1) was added to oil-paper insulation during the aging process in order to simulate the possible oxidation processes. The oil samples were aged at different aging times from 500 to 2000 hours which simulate long time service condition due to the used severe aging conditions. Fraction of the aged oil samples was reclaimed and/or degassed to assess the impact of aging by-products on the gassing. Thermal and electrical stresses will be submitted to the samples. DGA testing will be performed before and after stress applications.
The following standards were used to assess oil properties during this project.
Figure 1.2. Mechanical Convection (Model DKN-900).
1.4.3 Water Content (ASTM D 1533):
The ASTM D 1533 [11] test method covers the measurement of water present in insulating liquids by coulometric Karl Fischer titration. One important parameter in oil moisture measurements is the water solubility. When the moisture in oil exceeds the solubility for that temperature, free water will form. The conventional way to measure water
solubility is to make a saturated oil sample and then test the absolute moisture content. To achieve full saturation in transformer oil is difficult, especially at high temperature because of the high solubility [12].
Water can exist in transformer oil in three states [12]:
1. In practical cases, most water in oil is found in the dissolved state;
2. certain discrepancies in examining the moisture content using different measurement techniques suggests that water also exists in the oil tightly bound to oil molecules, especially in deteriorated oil;
3. When moisture in oil exceeds the saturation value, there will be free water precipitated from oil in suspension or drops.
By using Karl Fisher titration (Figure 1.3) based Coulometer, the water content in the oil in ppm, was determined. The measurements were repeated three times for each series of tests [12].
Figure 1.3. Karl Fischer (Model KF 831).
1.4.4 Acidity (ASTM D 974):
This test method (Figure 1.4) covers the determination of approximate Total Acid Number (TAN) of the oil sample. The result is provided in mg of KOH/g [13]. This value is a measure of the amount of acidic materials present. The acidity and therefore the acid number increases as oil ages in service. Used oil having a high acid number indicates that the oil is either oxidized or contaminated with materials such as varnish, paint, or other foreign matter.
Figure 1.4. Setup for measuring the acidity of liquid.
1.4.5 Interfacial Tension (ASTM D 971):
The Interfacial Tension (IFT) of oil (Figure 1.5) is the force in dynes per centimetre required to rupture the oil film existing at an oil-water interface. When certain contaminants such as soaps, paints, varnishes, and oxidation products are present in the oil, the film strength of the oil is weakened, thus requiring less force to rupture. For aged oils, a decreasing value indicates the accumulation of contaminants, oxidation products, or both. It is a precursor of objectionable oxidation products which may attack the insulation and interfere with the cooling of transformer windings. Dividing the Interfacial Tension (IFT) by the Neutralisation Number (NN) provides a numerical value (Myers Index Number: MIN or oil quality index number: OQIN) provides a sensitive and reliable guide in determining the remaining useful life of a transformer oil [14].
1.4.6 Turbidity (ASTM D 6181):
This test method utilizes a ratio turbidimeter (Figure 1.6) to evaluate the degree of contamination by solid particles in suspension produced either from external sources such as varnish and metallic particles from the materials used in transformers or internal chemical reactions such as oxidation. The results are provided in NTU (Nephelometric Turbidity Units) [15].
Figure 1.6. Turbidity meter for measuring cloudiness of liquid.
This method is an accurate optical laboratory technique developed to quantitatively determine the amount of microscopic solid suspension that may exist in both new and in-service fluids. Increasing turbidity signifies increasing fluid contamination. Other turbidity sources, such as water droplets or gas bubbles, are eliminated.
1.4.7 Dissolved Decay Product (ASTM D 6802):
This test method characterizes by spectrophotometer (Figure 1.7) the relative level of dissolved decay products in mineral insulating oils of petroleum origin [16].
Figure 1.7. Spectrophotometer for measuring the relative dissolved decay products in oil.
This method is based upon the observation that in the range of visible spectrum all brands of new insulating liquids are almost completely transparent to a monochromatic beam of
light. On the contrary, when the fluid contains decay products, the absorbanee curve, as determined by a scanning spectrophotometer, significantly shifts to longer wavelengths. The numerical integration of the area below these absorbanee curves permits the relative content of Dissolved oxidation Decay Products (DDP: peroxides, aldehydes, ketones and organic acids) in the fluid samples [16].
1.4.8 Partial discharge:
A partial discharge is a localized dielectric breakdown of a section of dielectrically stressed insulation path that occurs generally in voids, cracks, or interfaces within that insulating system or from the sharp edges of energized apparatus parts. These discharges may or may not exhibit a glow discharge, based on location and the intensity of these discharges [17]. The classic form of partial discharge is usually denoted by a visual glow or dielectric breakdown of the insulating air or gas around overstressed conductors or the sharp edges of energized apparatus parts [17].
In cider to simulate partial discharge in the fluid samples, a test cell designed in the ISOLIME laboratory (Figure 1.8) was used. It consists of a needle tip (1.5+0.1 pm) to plane gap (4 cm). The partial discharge was initiated by the application of 30 kV for an extended period of 1 hour.
Figure 1.8. Test cell of partial discharge test.
1.4.9 AC breakdown discharge (ASTM D 877):
The dielectric breakdown voltage is a measure of the ability of an insulating liquid to withstand electrical stress. The power-frequency breakdown voltage of a liquid is
reduced by the presence of contaminants such as cellulosic fibers, conducting particles, dirt, and water. Test Method D877 is not sensitive to low levels of these contaminants. Breakdown in this test method is dominated by events occurring at the electrode edges . The electrodes shall have parallel faces and axes in a coincident horizontal line when mounted in the cup. The spacing of the electrodes during tests was 2.54 mm (0.100 inch). The voltage stress distribution between the parallel disks electrodes used in this test method was quasi-uniform and there is substantial stress concentration at the sharp edges of the flat disk faces [18].
AC breakdown discharge was initiated in the oil sample to simulate incipient electrical breakdown. This was achieved using the liquid dielectric test set (Figure 1.9) [18]. The main purpose of that was an investigation of the effect of breakdown in transformer oils.
Figure 1.9. Model LD75 liquid dielectric test set.
1.4.10 Dissolved Gas Analysis (ASTM D 3612A):
In this test method dissolved gases are extracted from a sample of oil by gas chromatography (Figure 1.10).
By using dissolved gas analysis (DGA) it is possible to distinguish some faults such as partial discharge, breakdown and thermal fault because formation of these gases is dependent upon type of fault. There are several techniques in detecting those fault gases and DGA was recognized as the most informative method. This method involves sampling of the oil to measure the concentration of the dissolved gases.
Gas Chromatography is capable separating and detecting the gases of interest using a direct injection of a portion of the liquid samples. The apparatus must be capable of
sufficiently separating the component gases, at the sensitivity levels, to ensure quantitative measurement of the respective peak areas [19].
DGA can detect fault gases generated by abnormal electrical and/or thermal operation in transformers. The main gases considered are H2, CH4, C2H2, C2H4, C2H6, CO and CO2» The relative quantities of these gases can be correlated with the fault type and the rate of gas generation can indicate the severity of the fault. In this work, for the analysis purpose the tested oils were sampled using 30 ml syringe for DGA test.
Figure 1.10. Gas chromatograph (GC).
1.4.11 Stability test for mineral insulating Oils (ASTM D 6180-05)
This test method covers a laboratory technique that measures the stability of new, used, or reclaimed insulating oils, similar to those described in the ASTM Specification D 3487 in the presence of controlled electric discharge. When subjected to electrical discharge, insulating oils absorb energy and produce gases as well as ionized molecules (charge carriers). The quantity of these decay products can be measured and can provide an indication of the stability of oils under the conditions of this test.
During this test, the insulating oil is subjected to high voltage discharge that generates free electrons. These electrons collide with the hydrocarbon molecules causing many of them to become electronically excited. Some of these molecules lose this energy as quanta of light emitting fluorescent radiation. Some of the other excited molecules decompose into gases, ionized molecules and free radicals. The measurement of these changes establishes the stability of oils under the conditions of this test method. The
measures of these changes are the increase of the pressure in the test cells, the increase of dissipation factor and the turbidity of the oil specimen [10].
1.5 Statement of the originality of the thesis
In the last two decades, there has been considerable interest in the subject of life management of transformer equipment. To meet pressing needs of actual power industry new maintenance technologies, especially new diagnostic tools are necessary. In order to select a proper decision "What to do?" one ought to answer the question "What's the real condition of the equipment?" The easiest and the most accessible way to diagnose power transformer is to use transformer oil as efficient diagnostic media. The practice of the addition an oxidation stabilizer to transformer oil dates back almost 50 years. It was known that the elimination of oxygen as a source of contamination in a transformer significantly extended its life. Therefore, capability of oil transformer and oil-paper transformer to withstand decomposition under electrical discharge is more important for the safety of power transformers under operating conditions.
Currently, the electrical power industry believes that the gassing of oil is caused solely by hidden incipient electrical failures
Consequently, these are detected and diagnosed by periodic Dissolved Gas Analysis (DGA). DGA is probably the most widely used diagnostic tools for assessing the condition of electrical transformers and in more recent years load tap-changers and bulk oil circuit. As long as gases evolved by oil can randomly react before being determined by dissolved gas analysis (DGA), the attempt to diagnose the nature of incipient electrical failures based upon the chemical composition of gases is a "mission impossible". Consequently, the first step towards improving the accuracy of DGA should be the understanding of the impact of oxygen and aging byproducts on transformer oils gassing under the effect of electrical and thermal stresses. The investigations in this thesis aim at providing experimental evidence that oil born decay products contribute to the oil gassing. In addition, the formation in service conditions of undetected oil-born decay products is a contributing factor to the gassing of oil. The interpretation of DGA might be much more reproducible and relevant. Maintenance planners will therefore be in better position to take appropriate decisions.
1.6 Overview of the Thesis
This thesis is presented in six chapters. After a general introduction in Chapter 1, a review of the methods used in literature for the most used interpretation techniques of dissolved gas analysis oil will be presented in Chapter 2. Since DGA play a central role in this research, Chapter 3 will provide some programmed interpretation techniques of DGA implemented in the Labview software, covering architectures used in the rest of the thesis. In Chapter 4, gassing stability and several characteristics of oil and complex oil-paper under electrical stress will be introduced. Chapter 5 begins with a preliminary analysis and a description of the impact of aging by products, electrical and thermal stresses applied to the oil samples on DGA techniques.
Finally, some general conclusions are summarized in Chapter 6, from analyses and discussions of the results reported in the previous chapters. In addition, some recommendations are provided for future research.
Chapter 2
Literature review
Chapter 2
Literature review
2.1 Introduction
Transformer oil contains about 70% of diagnostic information [20]. The variations in different oil characteristics may therefore be used to identify/detect the type of incipient failure in the transformer. Diagnostic effectiveness by oil tests may be subdivided into four groups (Figure 2.1). Clearly, transformer failure may be avoided if the condition of the oil in an operational unit is monitored and, based on the results, corrective action is taken. Practically speaking, the lifetime of the transformer is directly related to the lifetime of the solid insulation. The evaluation of its deterioration is reliably performed by shaving at critical locations (leads, outer winding) and determining their tensile strength/degree of polymerization (DP). A non destructive alternative of this method is the measurement of furanic compounds released from the cellulose decomposition and dissolved in oil. Furfuraldehyde (2-FAL) has a strong correlation with the DP and criteria have been established to relate both properties [20] Another alternative recently proposed to access indirectly the DP is the Fast Fourier Transform Infrared (FTIR) offers promising avenues for an eventual implementation in the transformer body [20].
OHL PROPERTIES *
-ÎDEX1ÎFICAHOX
"¥"
DIELECTRIC DEGRADATfOCST• Free radicals Acidity (D$64 974} InteriTacial Tension; Neutralization number (D974> inhibitor content Dissipation factor Polarization Index Resistivity <D 11 $9) Dissolved Decay Turbidity (D61 SI) CiR>absob mi Î44> CD244O) • Peresnt saturation
• FaxtScIs* qualifie ation
• Impulse stsrens; 0*330$} • FD inception v ro factor • <ï*ssuigt*nd«ncy • Dissolved Decay products (D éS CC > • Electrostatic Charging \ y
Figure 2.1. Functional based classification of oil properties [4].
Gases in oil always result from the decomposition of electrical insulation materials (oil or paper), as a result of faults or chemical reactions in the equipment. Such incipient electrical failures are one cause of certain hydrocarbons breakdown called "gassing" of oil. According to ASTM Designation D 3612-02 "Standard Test Method for Analysis of Gases Dissolved in Electrical Insulating Oil by Gas Chromatography", Section 1.2, indicates that the individual component gases that may be identified and determined include: Hydrogen— H2, Oxygen—O2, Nitrogen—N2, Carbon Monoxide—CO, Carbon Dioxide—CO2, Methane—
CH4 Ethane—C2H6, Ethylene—QH4, Acetylene—C2H2, Propane—C3H8 and Propylene—C3H6.
DGA is probably the most used tool for detecting faults in electrical equipment in service. About twenty DGA interpretation techniques have been developed so far. However, none of these methods are able to predict incipient failures in the transformer with accuracy close to or equal to 100%.
2.2 The Gassing of Oil
Over the last decades, transformer capabilities have been improved by researchers due to competition among manufacturers. The voltages were increased in order to supply higher voltage transmission lines, and the power transformers were also physically sized down to minimize the cost. Contrary to this progress many laboratory techniques used to monitor the decay of oil insulation that are more than thirty years old and therefore are unable to detect the true cause of service reliability deterioration. The inability of outdated laboratory techniques to reveal the consequences of the oxidation decay process and especially the impact of the electrical stress put some researchers on a wrong track. Assessing the outcome of oxidation reactions solely by measuring the organic acidity and interfacial tension of oil (both more than thirty years old), the foreseeable formation of the colloidal sludge and x-waxes was ignored. These unnoticed oil-born insoluble impurities clog the pores of paper insulation and generate hot spots. Instead, sophisticated techniques, supposedly capable of "diagnosing" the cause and nature of various incipient electrical failures based upon the "symptoms" of these deficiencies, have proliferated.
Gassing of oil is defined scientifically as the chemical decomposition of certain hydrocarbons, under the impact of various stresses. Since this process implies the decomposition of vulnerable hydrocarbons, the question arises as to the source of energy
required for the splitting of a covalent bond. Basically, there are three sources of energy capable of transforming hydrocarbon molecules into decay products (Figure 2.2).
1
ELECTRICAL GASSING MULTIPLE STRESS1
THERMAL STRESSI
of OIL = BREAKDOWN CHEMICAL STRESS jI
of COVALENTFigure 2.2. Potential causes of insulating liquid gassing.
Insulation oil used in power transformers consists of saturated hydrocarbons as paraffin and naphthene and as long as chemical bonds are not broken, the formations of decay products are delayed. Vulnerable molecules (R-R') decompose and generate a pair of free radicals (R* and R'*). These fragments have an unpaired electron from a broken covalent bond and therefore are chemically very reactive.
R - R ' + h v ^ R # + R'# (2.1)
By secondary chemical reactions, the small fractions of the broken molecules generate usually a gas that dissolves in the oil without modifying the one phase system. Some of the hydrocarbon bonds may break and form free radicals: H*, CH3*, CH2* and CH*.
All these radicals then recombine to form the fault gases observed in oil: H* + H* •* H2 (hydrogen)
H* + CH3* -» CH4 (methane)
CH3* + CH3* "* C2H6 (ethane)
CH2* + CH2* * C2H4 (ethylene)
CH* + CH* •* C2H2 (acethylene)
In addition to these gases, the decomposition of paper produces CO2, CO and H2O,
because of the presence of oxygen atoms in the molecule of cellulose.
Since all low molecular weight fragments must have had an unpaired electron when the breakdown occurred, there is no doubt that the above mentioned gases (except O2 and
N2) are in fact the result of secondary chemical reaction (Figure 2.3).
CH2 CH3 CH2 CH.OH
W
OH CH3 CH CH2 CH CH CH CH \ / \ CH2 INSUlAfiNGOiL OH /h-K CH2OH CELLULOSE CH... CH... V / °T
C H , ÇHjOH ,-r\OH X OH Arcing Overheating I — Surface discharge Circulating current H ~ H f H \ C = — H \ H \ H ~ C5 HYDROGEN C METHANE H7 VH ETHANE ^//~"~H ETHYLENE ACETHYLENE C/^BONMONOXYDEFigure 2.3. The decomposition of oil/paper caused by incipient failures [21].
As the population of free radicals increases, some gaseous or liquid fractions may capture a free electron and form an ion.
R# + e" -» R" (2.2)
The accumulation of such ionized molecules increases the dissipation factor of oil-paper insulation. When two large free radicals couple their unpaired electrons to generate a similar insoluble hydrocarbon without oxygen in the middle, the decay product formed has the generic name of x-wax. The increase in free radicals population increases random chemical reactions between free radicals and soluble and insoluble oil-born decay products are the result (Figure 2.4) [22],
The terminal stage of the liquid deterioration process is sludge or x-waxes and acid in sufficient quantity to impair its heat transfer and dielectric properties [22].
MULTIPLE STRESSES ELECTRICAL STRESS FREE ELECTRONS THERMAL STRESS TEMPERATURE - 100* C CHEMICAL STRESS DISSOLVED OXYGEN G A S S I N G o f O I L R*nnKfi:;x*. " r f f . \ i X~J f?r> Determined by the Stabihty Under Eîecrrïcai Discharge D5180
SMALL MOLEC, WEIGHT FREE RADICALS y r e n r y cannot i RANDOM SECONDARY CHEMICAL REACTIONS
LARGE MOLEC. WEIGHT
FREE RADICALS
Currency catro: s« d«:*ct«3
f Dis:Dissolved Fault Gases ;8rrr;",eci Sv DGA
IONIZED FAULT GASES eterrr reo &y D-SS pat,cr? ^s-t
Coïloioal x-waxes SUSPENDED in t h * OIL
DISSOLVSD In Ihô Ô{L
Dstei-r.jnecs bv D68&2
SUSPENDED >n the OIL
PAPER 1KSULATÎOK _ . - - - %
Figure 2.4. Sketch of insulating oil decaying processes, inside a free breathing power transformer [22].
While general agreement exists that the increase of dissolved gases concentration represents an early warning that a local deterioration of insulation occurred, there are different opinions regarding the interpretation of this concerning symptom. The lack of consensus is even more evident when attempts are made to pinpoint the cause of the phenomenon, based upon the chemical composition of dissolved gases. A summary of the empirical methods suggested since the beginning of the dissolved gases analysis are exposed [7]:
• Incipient Fault Types, Frank M. Clark, 1933/1962 Dôrnenburg Ratios, E. Dôrnenburg, 1967, 1970 Potthoff s Scheme, K. Potthoff, 1969
• Absolute limits, various sources, introduced in the 70s • Shank's Visual Curve method, 1970s
• Trilinear Plot Method, introduced in the 70s Key Gas Method, David Pugh, 1974
Duval's Triangle, Michel Duval, 1974 Rogers Ratios, R. R. Rogers, 1975
Glass Criterion, R. M Glass, 1977
• Trend Analysis, various sources, introduced in the 80s • Total volume per day ppm per day
Church Logarithmic Nomograph, J. O. Church, 1980 • Expert System Analysis, Richard Lowe, 1985
Expert System Monitor Program, Karen Barrett, 1989 Transformer Fingerprinting
IEEE C57.104, Limits, rates and TDCG, 1978/1991 • Artificial Neural Networks (ANNs) and Fuzzy Logic
X. Ding, E. Yao, Y. Liu and Paul Griffin, 1996 Vladimiro Miranda and Adriana Garcez Castro, 2004 • Donald Lamontagne, 2006
IEC 60599 Ratios, Limits and gassing rates, 1999
Data mining and Log Transformation, Tony McGrail, 2000
Vector Algorithm, Nick Dominelli, Mike Lau and David Pugh, 2004.
Among the available DGA techniques, the most used are IEC, Roger's, DuvaPs Triangle and the Key Gas methods [23, 24, 25, and 26]. The advantages to any ratio method are that they are quantitative and independent of transformer oil volume. However, ratio methods can produce incorrect interpretations or none at all. Therefore they should be used in conjunction with other diagnostic methods such as the Key Gas method. Additionally minimum levels of gases must be present before results of the ratio methods become significant. One drawback of the gas ratio methods (Dôrnenburg, Rogers, IEC) is that some DGA results may fall outside the ratio codes and no diagnosis can be given (unresolved diagnoses). This does not occur with the Triangle method because it is a closed system rather than an open one.
2.2.1 DGA most used Interpretation Techniques
There are several methods for analyzing the dissolved gas results, most commonly used methods are listed below:
• Duval Triangle
• IEEE C57.104, Limits, rates and TDCG • Straight Limits
• Key Gas Method ••• Dôrnenburg Ratios ••• Rogers Ratios
• IEC 60599 Ratios and Limits ••• Trend Analysis
• Fingerprints
• Expert System Analysis
Duval5s method appears to be more accurate than other methods according to Table
2.1. One advantage of this method is that, it always provides a diagnosis, with a low percentage of wrong diagnoses. Duval's method was developed empirically in the early
1970s [27].
Table 2.1. Comparison of some diagnosis methods [7].
2.2.2 Traditional DGA methods
The three traditional DGA methods implemented in this study are (i) Roger's Ratio Method (RRM), (ii) Dornenburg's Ratio Method (DRM) and (iii) the Duval's triangle method. These methods have been programmed in the Labview software due to their high accuracy and similar structure.
The fingerprint gases used by all the three methods to be harnessed are Carbon Monoxide (CO), Hydrogen (H2), Methane (CH4), Ethane (C2H6), Ethylene (C2H4) and
Acetylene (C2H2). Conventionally, all the above DGA techniques make decisions based on
the values of the ratios they use.
2.3 Summary
Power systems and transformer are essential apparatus, hence its reliability and safe operation is important to determine their operation conditions, and the industry uses quality control tests in the insulation design of oil filled transformers.
The gas generation process in an insulating liquid involves the decomposition of certain vulnerable molecules. Generally, there are three energy sources that can break up large molecules of vulnerable covalent bonds to form gases and decay products: the electric field, thermal energy generated by the active part of the transformer and environmental stresses.
The unavoidable presence of dissolved oxygen in the insulating liquids contributes to the degradation of this later. Oil-born decay products generated by oxygen degrade the internal winding insulation, decrease service reliability, and shorten the life expectancy of electrical transformers.
Accurate methods of estimating the gassing tendency of liquids have been proposed and standardized. Special attention has been paid to gas formation under partial discharge (PD), which is inevitably present in power equipment, even under normal operating conditions.
Chapter 3
Implementation of some methods in Labview
Chapter 3
Implementation of some methods in Labview
3.1 Introduction
The actual operating condition of transformers in power grid is an important aspect viewing the stability of the power supply. Economic pressure forces power utilities to introduce efficient maintenance strategies carrying out only the most important jobs. In order to conserve transformers "health", appropriate maintenance and diagnostic tools are necessaryv
In power transformer monitoring and diagnostic applications, maintenance engineers, face the complexity and diversity of tasks associated with this complex domain. This often arises from dealing with different types of information from different sources, which require processing with different diagnostic schemes. This problem may neither fit the assumptions of a single technique nor be effectively solved by the strengths and capabilities of a single technique. Combined diagnostic techniques can be very useful for experts to detect transformer faults and reduce the risk of mistaken diagnostics. Merging various techniques should be a significant move forward in the next generation of diagnostic and monitoring systems. In this contribution, a Labview-based expert system has been implemented. By combining DGA diagnostic methods, the risk of mistaken diagnostics might be reduced and the likelihood maximized to identify faults before they lead to transformer failures.
3.2 Realized work in Labview
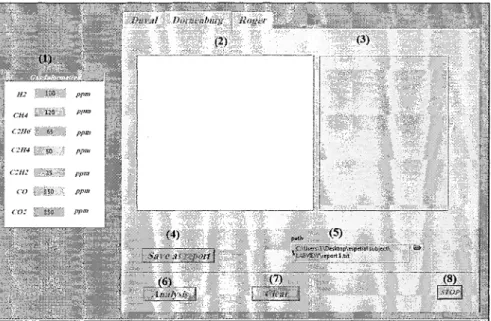
A user friendly program has been developed to analyze the dissolved gas results extracted from an oil sample by GC. The front panel of the system (Figure 3.1) was designed using Labview to enable computer to act as customer-designed instrument. The dissolved gas-in-oil analysis (DGA) method was used as technique for oil type transformer diagnosis. The block diagram depicted in Figure 3.2 was used as expert system to implement all information keyed in at the front panel to diagnose and predict the condition of the transformer. The outcome of the interpretation is displayed in the front panel of Labview, to show the user, the conditions of the transformer at any time.
Durai Dor&eaburg Roger
(2) (3)
IkLE:ZKZ/ \£ZïïZl^L 2 . „ ' , ~Ï<Â.~U~.'JL*^ ,~t~'rm~£.L.
Figure 3.1. Overview of the main interface of the Labview program.
As shown in the Figure 3.1, the main program consists in the following sections: (1) Input data
(2) Choice of analyzing method (Duval, Dôrnenburg, Roger) (3) On line report and results menu
(4) Saving the report as a text file (5) Path to save the report as
(6) Analysis button to start analyzing (7) Clear the on line results
(8) Program stopping button
O "— L I; H 8 K -« € 1C i) 1! R4 M)C " - - " H
i?»' asiag Domeaburg flowchart :
There h BO huh.
Figure 3.2. Block diagram of the program.
The program was developed for three methods, Roger, Dôrnenburg and DuvaL The following section explains the application of the program for these methods.
3.2.1 Roger's Ratio Method
Roger's Ratio Method is presented in Table 3.1, and the ratios employed for diagnosis are derived from various combinations of the fingerprint gases (Mollmann et al.
1999) [28]. Case 0 1 2 3 4 5
Table 3.1. Roger's Ratio
R2 C2H2/C2H4 <0.1 <0.1 0.1-3.0 <0.1 <0.1 <0.1 R1 CH4M2 >0.1,<1.0 <0.1 0.1-1.0 >0.1<1.0 >1*0 >1.0 Method R5 C2H4/C2H6 <1.0 <1.0 >3.0 1.0-3.0 1.0-3.0 >3.0 Fault Normal Low energy PD Arcing Low ternp thermal Thermal <700°C Thermal >700*C
There are three ratios in Roger's method: • Ratio 1 (R,) = CH4/H2
• Ratio 2 (R2) = C2H2/C2H4
• Ratio 5 (R5) = C2H4/C2H6
Figure 3.3 shows the application of this program for Roger's method.
vâl Bommlmrg Roger
The program csic»fet
!U s CH4/H2 a <X5G
% using Ragef* f iow< Hsrt ï T h er t«5h ^ ^(T<700c>Q
5
2I
.-,,,„,,,>.-A»; > * £ ;
Figure 3.3. Implementation of Roger's method in Labview.
As an example shown in Figure 3.3, the values of gases as inputs for this method are: H2=100 ppm^CH^SO ppm ,C2H6= 30 ppm, C2H4=50 ppm,C2H2=:4 ppm
After analyzing the method, the ratios were calculated and the program also provides a short report indicating a thermal fault as shown in Figure 3.4.
By using Rogtr*s flowchart : There h thermal fault (T<7O0 oC)
Figure 3.4. Example of Roger's fault.
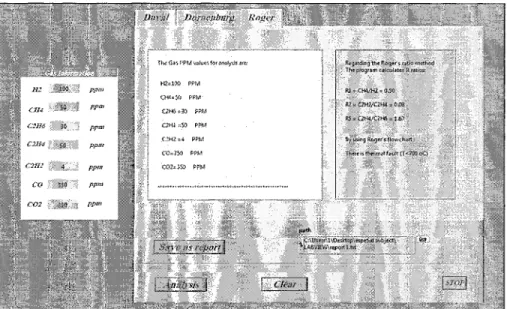
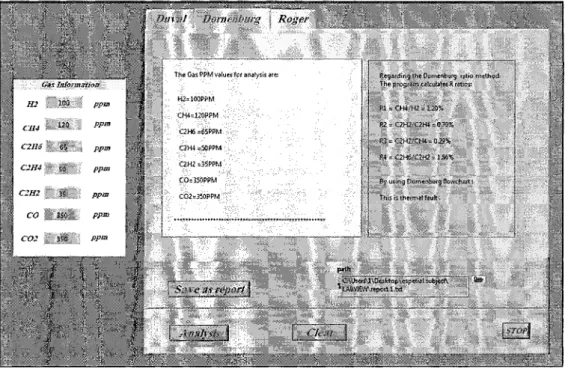
3.2.2 Dornenburgfs Ratio Method
For Dornenburg's Ratio Method, the fingerprint gas ratios are compared with some predetermined values to determine the types and levels of faults. The relationships between fault types and the applied ratios are listed in Tables 3.2 and Table 3.3 [28].
Table 3.2. Dôrnenburg's Ratio Method. Fault Thermal PD Arcing
1
R,
> 1.0 <0.1 >0.1&< 1.0 R2 I <0.75 N/A >0.75 R3 <0.3 <0.3 >0.3"*T
>0.4 >0.4 <0.4 Gas Ll(ppm)Table 3 . 3 . Dornenburg's L I Limits.
H2 CH4 CO C2H2 C2H4
100 120 350 35 50
C2H6
65
There are four ratios in Domenburg's method: • Ratio 1 (Ri) = CH4/H2
• Ratio 2 (R2) = C2H2/C2H4
• Ratio 3 (R3) = C2H2/CH4
• Ratio 4 (R4) = C2H6/C2H2
Figure 3.5 shows the application of this program for Domenburg's method.
Figure 3.5. Dornenburg's ratio method in Labview.
As an example shown in Figure 3.5, the values of gases, as inputs for this method are:
H2=100 ppm, CH4=120 ppm ,C2H6= 65 ppm, C2H4=50 ppm, C2H2=35 ppm. After analyzing
the method, the program gives a short report that, there is arcing fault according to Figure 3.6.
By using Dornenburg flowchart: Î
This is thermal fault »
Figure 3.6. Example of Dôrnenburg's fault.
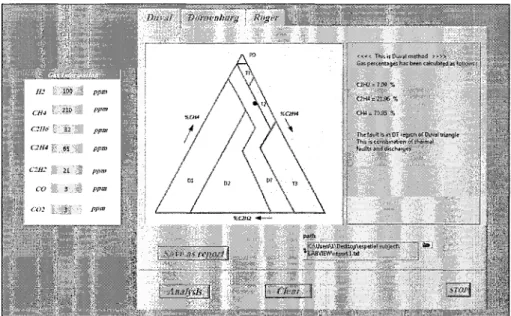
3.2.3 Duval Triangle Method
The Duval's Triangle diagnostic method for oil-insulated high-voltage equipment (mainly transformers) was developed by Michel Duval [6]. The triangle representations allow following easily, graphically and visually the evolution of faults with time objectives. However many people are not quite familiar with the use of triangular coordinates.
Several software packages are available for DGA interpretation using the Duval triangle method. Concentrations (ppm) of methane (CH4), ethylene (C2H4), and acetylene
(C2H2) are expressed as percentages of the total (CH4 + C2H4 + C2H2) and plotted as a point
(%CH4, %C2H4, %C2H2) in a triangular coordinate system on a triangular chart which has
been subdivided into fault zones. The fault zone in which the point is located designates the likely fault type which produced that combination of gas concentrations [27].
The six main zones of faults are indicated in the triangle, plus a DT zone (mixture of thermal and electrical faults). These zones are summarized as below:
PD: Partial discharge
T l : Low-range thermal fault (below 300 °C) T2: Medium-range thermal fault (300-700 °C) T3: High-range thermal fault (above 700 °C)
Dl: Low-energy electrical discharge D2: High-energy electrical discharge
DT: Indeterminate - thermal fault or electrical discharge. Figure 3.7 shows the application of this program for Duval's method.
enbms Roger WM^^ÊMÊ^
Figure 3.7. Duval's Triangle in Labview.
As an example shown in the above figure, the values of gases as inputs for this method are: CH4=210 ppm, C2H4=65 ppm, C2H2=21 ppm.
After analyzing the method, the ratios have been calculated and the program gives a short report that, there is combination of thermal and discharge fault according to Figure 3.8.
The fault is m DT region of Dyval triangle This is combination of thermal
fau lit s and discharges
Figure 3.8. Example of Duval's fault.
3.3 Summary
Condition monitoring of electrical power equipment has attracted considerable attention for many years. The aim of this chapter is to use Labview to build a simulation system to diagnose transformer faults and monitor its condition.
Dissolved gas analysis (DGA) is one of the most useful techniques to detect incipient faults in oil-filled power transformers. Various methods have been developed to interpret DGA results such as ratios methods (Rogers', Dôrnenburg, IEC) and Duval's method. One weak point in ratio methods is that they fail to cover all ranges of data and sometimes ratios fall outside the scope of tables. All together, there is always some degree of inaccuracy in dissolved-gas measurements. This inaccuracy affects gas ratios and other diagnostic calculations. Therefore, the results based on them may be correspondingly uncertain in some cases and they sometimes fail to determine the faults. There is no single DGA technique that alone can guarantee to detect all the range of faults and give a reliable estimation of transformer condition. For this reason combination of DGA diagnostic techniques are required to enhance reliability of diagnosis. In this chapter, Labview-based software was developed. This software includes three of the most commonly used techniques, namely Duval's, Roger's and Dôrnenburg methods.
Chapter 4
Gassing stability of oil and complex oil-paper
system under electrical discharge
Chapter 4
Gassing stability of oil and complex oil-paper system under
electrical discharge
4.1 Introduction
Since gas evolvement deteriorates the dielectric properties of insulating fluid, its ability to resist decomposition under electrical discharge is of paramount importance for the safety of power transformers under operating conditions. Knowledge of the resistance to gassing of insulating fluids under high electrical stress is of upmost important to both electrical-equipments designers and operating engineers.
Failure of liquid filled equipments can be caused by discharge in bubble. Such phenomenon was first observed in the early 1930s in oil filled cables. So far, power equipments are being designed with the aim of minimizing the possibility of formation of gas. The formation of gas bubble in the liquid under electrical stress, results in a stressed liquid-gas interface [29]. If the field stress is high enough, non disruptive or salient discharge will occur with ionization and molecular activation of the gas and liquid molecules. Such discharge is not accompanied by high temperature; therefore the reactions which occur is due to the electrons, the electrical stress, the frequency of the applied voltage, the nature and pressure of the gas phase, the temperature and the chemical composition of the liquid and the physicochemical reactions initiated by the atomized gas phase. There is a direct relation between certain molecules in the fluid and its ability to gas absorption. It is now well established that aromatic molecules affect gassing.
The existing methods to determine the stability of liquid-to-gas formation (resistance to gassing) can be subdivided into two groups. The first is the modified Pirelli method (ASTM D2300 and IEC 60628), which was originally developed for cable oils. Discharges were initiated above the surface of the insulating liquid, involving only the vapor produced by the insulating liquid. This was an important step towards determining the gassing tendency of insulating liquids. However, this method has not been widely
accepted [30]. The second method to determine the gassing tendency of insulating liquids involves initiating electric discharges directly in a liquid sample in a test cell to simulate faults that occur in operating equipment. Contrary to the first method, it indicates, "whether insulating oils are gas absorbing or gas evolving", which presents a confusing signal to electrical engineers. As long as the gassing of a new or aged insulating oil sample cannot be accurately measured, it is practically impossible to identify the variables that might have caused an increased concentration of fault gases. Consequently, the alternate ASTM Designation D 6180 was developed. This "Standard Test Method for stability of Insulating Oils of Petroleum Origin under Electrical Discharges" can measure the amount of gases evolved by new, in-service aged or reclaimed oils submitted to electrical discharge. While the gassing of insulating oils is considered as a symptom of a potential threat to the operational safety of transformers, its side effects on the purity of oil are generally ignored.
In this testing procedure, the amount of gas evolved by an oil sample as well as the side effects of gassing can be accurately measured. Determining the stray gassing of new oils based upon their chemical composition and monitoring the changes caused by its deterioration in service demonstrate the need to keep the oil in pristine conditions for the lifetime of transformers. These testing can be used for homologation and/or qualification transformer fluids [30]. In relationship with the gassing tendency and the concomitant side effect, fluid can be selected for a specific application.
Insulating oil during service undergoes changes in physical, chemical and electrical properties due to ageing and contamination. The growing amount of impurities like acids, moisture, sludge and polar molecules, are responsible for fast deterioration of oil and affect active service life of the transformer. Without accurately measuring how much gas, charge carriers and colloidal suspensions arise in oil samples submitted to electrical stress; the stability of liquid insulation cannot be reliably determined [22].
Gassing tendency will be analyzed and the influence of pressboard addressed. Besides the testing on new samples, it is planned to perform testing on aged samples too. The influence of decay product and the partnership of oil-pressboard will be highlighted.
4.2 Experimental setup
A Merell-based test cell type, defined in the ASTM Test Method D6180, was used (Figure 4.1). The free electrons are generated by a cylindrical copper electrode 15 mm (0.6 inches) in diameter and 10 mm long sealed in a 500 ml Erlenmeyer glass. The electrode is placed in the center of the discharge cell and suspended above the oil. The distance between the central electrode and the surface of oil is approximately 25.4 mm (1 inch) [30].
Before applying the voltage, the discharge cell was vacuumed down to 1 Ton* (133 Pa). After vacuum degassing, insulating fluid specimen is subjected to high voltage discharge of 10 kV during the 5 h test. The pressure increase inside the discharge cell, allows assessing the quantity of gasses evolved [30].
Figure 4.1. Discharge cell according to ASTM Designation D6180 [10].
In these tests, a series of testing were performed on oil without paper. Oil samples were degassed, dehumidified and aged under laboratory condition for extended period of times (500 h, 1000 h, and 2000 h). The second series of tests includes oil samples with different ratios of paper aged under laboratory condition too at various times (250 h, 500 h, 750 h, and 1000 h). Different fluids properties such as the Dissolved Decay Products (DDP) [16], Turbidity [15], Interfacial tension (IFT) [14], and Water content [11] were measured before and after voltage application to assess the discharge deleterious impact.
4.3 Results and discussions
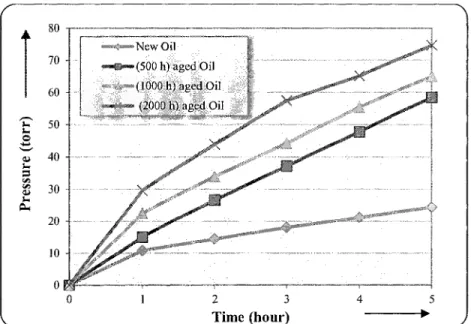
Both samples (with and without paper) were submitted to electrical stress according to ASTM D 6180. The pressure increase inside the discharge cell indicates the amount of gases evolved due to the primary decomposition of unstable molecules in the new oil according to Figure 4.2. â 80 i 70 60 ^ 40
-r
S 30 • 20 10 -^<«r^ New Oil — e ^ ( 5 0 0 h ) a g e d O i l (1000 h) aged Oil —^a** (2000 h) aged OilU ^f" T T-- -0 1 2 Time JET 3 (hour) mm 4 m i i 5
Figure 4.2. Gassing tendency of new and aged oil samples without paper.
Out of this Figure, it can be seen that the pressure increased after the 5 hours test in the oil samples. Obviously, pressure depends on aging rate.
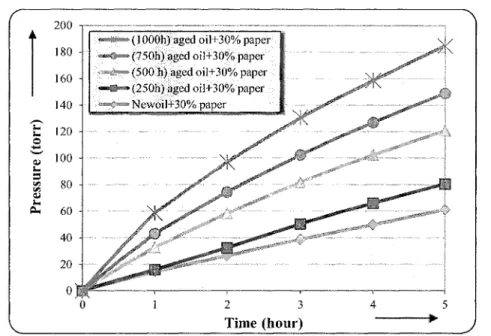
The gassing tendency of 500 hours aged oil-paper with 10% and 30% of paper and without paper is summarized in Figure 4.3. In the aged oil-paper samples there was amount of paper inside the oil during aging times, in the case of 500 h aged oil-papers the paper removed before submitting the sample to stability test.
It should be noted that, 500 h aged oil-papers reported in Figure 4.3 is not the same with 500 h aged oil reported in Figure 4.2.
r
120-100
80
-•^
(500 h) aged oil-paper 4-30% paper
®s*^(500 h) aged oil-paper+10 % paper
! ' < 500 h aged oil-paper
Figure 4.3. Gassing tendency of combined aged oil-paper (with and without paper).
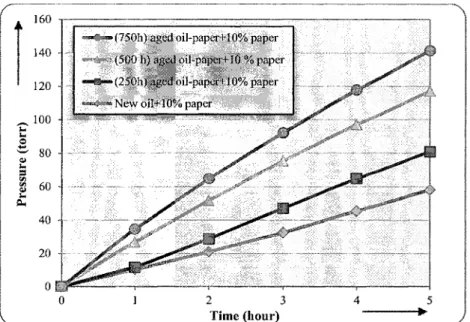
From Figure 4.3, it can also be seen that the pressure increased in the discharge cell when adding paper to oil specimen in the same experimental condition. The higher gassing tendency of oil happens with 30% of paper. The summary of gassing tests performed under electrical discharge on new and aged oil samples with 10% of paper is presented in Figure 4.4. 140 120 80 60 40 20 -0 1
«*<^(750h) aged oil-paper+10% paper ^ v - (500 h) ag$éoii-paperf 10 % paper —•— (250h) aged oil-paper-M0% paper
***x0®mt New oil+10% paper
it
2 3 Time (hour)
Figure 4.4. The gassing tendency of new and aged oil samples with 10% of paper as per D6180.
![Figure 2.3. The decomposition of oil/paper caused by incipient failures [21].](https://thumb-eu.123doks.com/thumbv2/123doknet/7692145.244037/33.937.266.779.105.402/figure-decomposition-oil-paper-caused-incipient-failures.webp)
![Figure 2.4. Sketch of insulating oil decaying processes, inside a free breathing power transformer [22].](https://thumb-eu.123doks.com/thumbv2/123doknet/7692145.244037/34.919.278.760.107.472/figure-sketch-insulating-decaying-processes-inside-breathing-transformer.webp)