HAL Id: hal-01688405
https://hal.archives-ouvertes.fr/hal-01688405
Submitted on 28 Feb 2018
HAL is a multi-disciplinary open access
archive for the deposit and dissemination of
sci-entific research documents, whether they are
pub-lished or not. The documents may come from
teaching and research institutions in France or
abroad, or from public or private research centers.
L’archive ouverte pluridisciplinaire HAL, est
destinée au dépôt et à la diffusion de documents
scientifiques de niveau recherche, publiés ou non,
émanant des établissements d’enseignement et de
recherche français ou étrangers, des laboratoires
publics ou privés.
Effect of particle size and temperature on woody
biomass fast pyrolysis at high temperature (1000-1400
degrees C)
Santiago Septien, Sylvie Valin, Capucine Dupont, Marine Peyrot, Sylvain
Salvador
To cite this version:
Santiago Septien, Sylvie Valin, Capucine Dupont, Marine Peyrot, Sylvain Salvador. Effect of particle
size and temperature on woody biomass fast pyrolysis at high temperature (1000-1400 degrees C).
Fuel, Elsevier, 2012, 97, pp.202-210. �10.1016/j.fuel.2012.01.049�. �hal-01688405�
Effect of particle size and temperature on woody biomass fast pyrolysis at high
temperature (1000–1400!C)
Santiago Septien
a,⇑, Sylvie Valin
a, Capucine Dupont
a, Marine Peyrot
a, Sylvain Salvador
baCEA, 17 rue des Martyrs, 38054 Grenoble cedex 09, France bRAPSODEE, EMAC, 81013 Albi CT cedex 09, France
Keywords: Fast pyrolysis Drop tube reactor Gas
Hydrocarbon consumption Soot formation
a b s t r a c t
Fast pyrolysis of wood was conducted in a drop tube furnace to study the influence of temperature (1000 1200 1400!C) and particle size (0.35 0.80 mm) for a particle residence time of some seconds. No effect of particle size has been observed on final pyrolysis products. At 1000!C, much more gas and tar are produced than char (yield of 96% versus 4%); hydrocarbons, including light species and tar, present a considerable yield of 26%. From 1200!C, the drastic hydrocarbons decomposition, emphasized with temperature, leads to high yields in soot, H2and CO. At 1200!C, no tar are detected; at 1400 !C only
low amounts of CH4and C2H2still remain. Under the explored conditions, char and soot gasification with
H2O and CO2, species produced during pyrolysis, is kinetically blocked. However, even if carbonaceous
solids do not seem to be considerably affected by gasification, they suffer some changes when tempera ture is increased.
1. Introduction
Biomass gasification is one of the most promising low carbon emission technologies. It enables to convert lignocellulosic matter, such as wood or agricultural residues, into syngas H2and CO. This
gas mixture has a great potential since it can be directly used for the production of heat and electricity or for the synthesis of liquid or gaseous biofuels. The entrained flow reactor is one of the main gasification technologies at a large scale. The typical process condi tions are as follows: high temperature (>1300!C), short particle residence time (<5 s) and extremely high heat flux at the surface particles (>106W m 2). The main advantage of this technology is
the high conversion of biomass into a syngas free of tar and gas eous hydrocarbons.
Particle size is a very important parameter in entrained flow reactor gasification. Large biomass particles can be incompletely converted due to heat transfer limitations, thus reducing the effi ciency of the process. A study about the design of a biomass gasi fication plant using a entrained flow reactor [1] found that the greatest efficiency would be achieved using 1 mm biomass parti cles as feedstock. In this case, biomass pre treatment, like an ad vanced grinding or thermal treatment (torrefaction to facilitate grinding or fast pyrolysis for the production of bio oil), would not be necessary, thus increasing the global efficiency of the plant and decreasing costs.
Biomass gasification process involves three main stages: pyro lysis, a thermal decomposition of biomass into different products, gas phase reactions and gasification of the solid residue. As pyroly sis is the first stage before gasification, it is crucial to understand how this process occurs. Depending on pyrolysis conditions, the chemical species produced, their yields and char characteristics are different[2]. It can be noticed that pyrolysis is very difficult to be experimentally decoupled from gas phase reactions. The evo lution of the gas phase in an inert atmosphere may also give impor tant data for the understanding of gas phase behavior in a gasification atmosphere. Drop tube furnace appears as an appropri ate experimental apparatus to reproduce at lab scale entrained flow reactor conditions.
Biomass fast pyrolysis, defined as pyrolysis at high heating rates, as in the case of an entrained flow reactor, is known for its high tar yield at low temperature (500!C). Under these conditions, tar can attain up to 75 wt.% of the initial biomass[3,4]. At higher temperature, gas yield increases to the detriment of tar yield. In all cases, char yield remains very low. At 800!C, Chen[5]measured a gas mass yield of 83% versus a tar yield of 10%, from the fast pyro lysis of 0.35 mm beech particles. Zanzi et al.[6]obtained even low er tar yields of 1% for the fast pyrolysis of larger wood particles (0.7 1 mm) at the same temperature. Under these conditions, authors agree on the fact that the gas is mainly composed of CO, CO2, H2O, H2, CH4, C2compounds and C6H6. Zhang et al.[7,8]inves
tigated the fast pyrolysis of 0.5 mm cypress sawdust in a large range of temperatures, from 600!C to 1400 !C. They observed a low tar yield, a decrease of hydrocarbons and a high soot formation
⇑Corresponding author. Tel.: +33 438784358. E-mail address:sylvie.valin@cea.fr(S. Septien).
above 1000!C. At 1400 !C, tar was totally converted and only low amounts of gaseous hydrocarbons were remaining, consisting essentially of CH4. On the contrary, H2and CO yields significantly
increased. These results are confirmed by the study of Qin et al.[9]. Some authors include in their study the effect of particle size [5,6,10,11]. However, they usually work up to 950!C. All of them agree that pyrolysis can suffer from heat transfer limitations in the case of almost millimetric particles in the temperature range of 700 950!C. Only one study on biomass particle size effect at higher temperature has been found under very short residence times of 0.56 s and 1 s. In this study, Bitowft et al.[12]showed that particles larger than 0.5 mm appear not to be completely pyro lyzed, contrary to particles with a diameter between 0.250 mm and 0.355 mm, at 1000!C.
Up to now, no satisfactory information has been found in liter ature about the simultaneous effect of temperature and particle size on pyrolysis under the typical conditions of an entrained flow reactor. This work is an attempt to fill in this lack.
To achieve this goal, pyrolysis experiments have been per formed at different temperatures (1000 1400!C) for different par ticle sizes (0.35 mm and 0.80 mm) and for a residence time of a few seconds representative of those of entrained flow reactors. Note that works in the same team have been already performed in a drop tube furnace at lower temperature, from 800!C to 950 !C, for fluidized bed reactor application research[5,11,13].
2. Materials and methods 2.1. Raw material
The feedstock selected for the experiments was commercial beech for food smoking. After sieving, two ranges of particle size were selected for the experiments: 0.313 0.400 mm; 0.730 0.900 mm. In this study, these particle size ranges are referred as 0.35 mm and 0.80 mm respectively.
The proximate analysis (ash, moisture, volatile matter and fixed carbon), as the ultimate analysis (C, H, O, N, S) of the two samples
are shown inTable 1. Ash composition is also presented inTable 2. Note that the total of the measured inorganic fractions in ash does not reach 100% but 80% approximately, maybe because of the pres ence of inorganic carbon. Chemical composition of both samples is quite the same.
2.2. Experimental procedure 2.2.1. The reactor: drop tube furnace
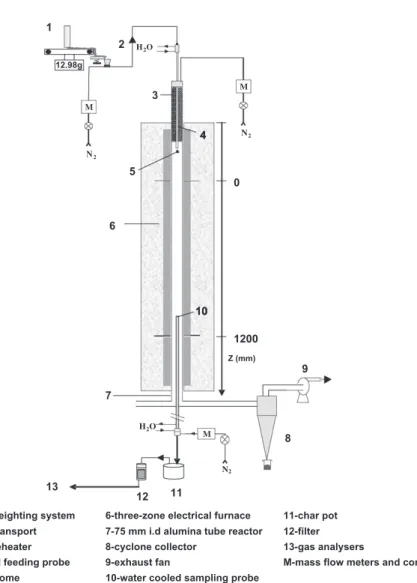
The drop tube reactor (DTR) consists in an alumina tube in serted in a vertical electrical heater with three independent heat ing zones. The dimensions of the tube are 2.3 m in length and 0.075 m in internal diameter. This DTR, which is depicted in Fig. 1, works at atmospheric pressure and can reach a maximum temperature of 1600!C.
Pyrolysis experiments were performed in inert nitrogen atmo sphere. The wood particles were continuously fed using a controlled weighing system and injected into the reactor with a 2 NL min 1
transport nitrogen stream through a water cooled (30!C) feeding probe. A dispersion dome was placed at the outlet of the feeding probe to distribute the solid particles over the reactor cross section. The main nitrogen stream passed through an electrical pre heater to reach 900!C and then met the mixture of cold wood particles and transport nitrogen stream at the dispersion dome. The total nitro gen flow rates were 15.9 L min 1, 13.8 L min 1and 12.1 L min 1
during experiments at 1000!C, 1200 !C and 1400 !C respectively, in order to keep a constant gas velocity and thus a constant gas res idence time of 4.3 s as the temperature was changed.
An oil cooled (100!C) sampling multi tube probe was inserted at the bottom of the reactor to collect gas and remaining solid. A representative fraction of the exhaust gas was sucked in the sam pling probe and passed through a char pot and a filter. This part of the experimental installation was heated to avoid steam and tar condensation. After the filter, the sampled gas passed through sev eral analyzers (Table 3).
The particle residence time was estimated from a model developed by Chen. This model takes into account changes in the Nomenclature
Cpp particle heat capacity (J kg 1K 1)
dp particle diameter (m) k reaction rate constant ( )
h convective exchange coefficient (W m 2K 1)
t characteristic time (s) Tg gas temperature (K)
Tp initial particle temperature (K)
x
p particle emissivity ( )r
Boltzmann constant (W m 2K 4)keff effective particle conductivity (W m 1K 1)
q
p particle density (kg/m3)Table 1
Biomass composition.
Sample name (mm) C H N S Oa Volatile matter Fixed carbon Ash Moisture
wt.% (daf) wt.% (dry) wt.% (dry)
0.35 50.8 5.9 0.3 0.02 42.9 85.3 14.3 0.4 7
0.80 50.4 5.9 0.3 0.02 43.3 85.3 14.3 0.4 7
aBy difference.
Table 2
Composition of biomass ash obtained at 550!C following the standard XP CEN/TS 15290.
Sample name (mm) Ash composition Total
Si (%) Al (%) Fe (%) Ti (%) Ca (%) Mg (%) K (%) Na (%) S (%) P (%) Mn (%) 0.20 9.4 2.1 1.3 0.1 27.7 9.0 17.7 0.8 2.9 2.7 5.3 79.0 0.80 9.3 2.4 1.2 0.2 27.5 8.7 16.2 0.8 5.5 2.6 5.3 79.7
particle outside diameter and density along the reaction. It was experimentally validated at 800!C and 950 !C, thus the results have to be taken with a lot of caution. The 0.35 mm and 0.80 mm particles residence time is about 3.8 s and 2.7 s respectively. It can be noticed that the particle residence time for a given particle size was not affected by temperature.
Biomass flow rates were adjusted in order to keep the same nitrogen/biomass mass ratio at all temperatures. This gives the
following mass flow rates: 1.3 g/min at 1000!C, 1.15 g/min at 1200!C and 1 g/min at 1400 !C.
2.2.2. Gas analysis
Each main gaseous compound was measured twice with differ ent analysers, except from H2O. The relative difference between
the measurements of two analysers ranged between 5% and 15% for a given gas compound. Micro chromatograph gas concentration
H2O N2 M 12.98g 2 3 4 5 6 10 8 11 12 7 H2O M N2 9 13 Z (mm) 0 1200 1
1-controlled weighting system 2-pneumatic transport 3-electrical preheater 4-water cooled feeding probe 5-dispersion dome
6-three-zone electrical furnace 7-75 mm i.d alumina tube reactor 8-cyclone collector
9-exhaust fan
10-water cooled sampling probe
11-char pot 12-filter 13-gas analysers
M-mass flow meters and controller N2
M 4
10
Fig. 1. Scheme of the drop tube furnace (DTR).
Table 3
Gas analysers used during pyrolysis experiments.
H2 CO CO2 H2O CH4 C2H4 C2H2 C2H6 C3H8 C6H6 THCe O2
Micro gas chromatograph X X X X X X X X X
FTIRa X X X X X X TCDb X FIDc X X NDIRd X Psychrometer X Paramagnetic X
aFourier transform infrared spectrometer. bThermal conductivity detector. cFlame ionization detector.
dNon-dispersive Infrared spectrometer. eTotal hydrocarbons.
values were considered more accurate and were adopted, except for the C2hydrocarbons values. The repeatability of the experi
ments was checked at several days and months of interval; the rel ative differences on measurements was lower than 20%.
2.2.3. Solid residue characterization
Solid can be collected after each experiment from the sample probe, the char pot and the filter. Solid in the sample probe seems to be a mixture of char and soot, whereas the char pot seems to mostly retain char particles while the filter captures soot particles. This particle segregation has been observed by other authors[7].
Some types of analyses were conducted on the char and soot that were collected:
" Ultimate analysis of the elemental composition (C, H) and ash content measurement at 550!C following the standard CEN/TS 14775.
" Scanning electron microscope (SEM) coupled to X ray diffrac tion (XRD) to analyse a selected area with a 4 5
l
m width pen etration in the solid particle.The char yield was calculated thanks to the ash tracer method [5,6,11]. The error bar of this method is estimated at 25% and comes from the uncertainty of the ash content measurements of wood and char samples. Note that due to the low yield of char in the experiments, this relatively high error is not prejudicial for the global mass balance.
The study of Misra et al.[14]has shown that biomass ash pre pared at 350!C lost about 20 50% of its mass above 1000 !C. This mass loss is mainly due to the decarbonation of ash between 600!C and 900 !C, the volatilization of sulfur (7 55% of content) and potassium (63 90% of content) between 900!C and 1100 !C. Hence, based on the elemental composition of the ash of the wood sample used in this study (Table 2), ash in char can lose up to 50% of its weight during pyrolysis experiments in the worst case. So, the char yield determined from the experiments could be overestimated.
2.2.4. Tar and soot yields estimation
‘‘Tar’’ here and in the following text refers to all the organic compounds with a molecular weight larger than benzene (exclud ing soot and char).
Tar and soot yields cannot be directly quantified but they can be estimated by difference through the mass balance. At 1000!C, the unmeasured fraction in the mass balance is assumed to be that of tars, due to the observation of tar condensation in the experimen tal unit and to the absence of solid particles in the filter. At 1200!C and 1400!C, the unmeasured fraction in mass balance is attributed to soot which is found in high amounts in the filter. Besides, no condensed tar could be observed in the experimental unit, nor sig nificant amounts of non condensable hydrocarbons were detected through the FID gas analyser.
2.3. Approaches used for the experimental results analysis 2.3.1. Characteristic time analysis
As a preliminary study, a theoretical determination of the time needed for complete pyrolysis conversion by a characteristic time approach[15 17]has been performed. The characteristic time of a phenomenon is the theoretical time needed for pyrolysis conver sion when this is only controlled by the involved phenomenon. The characteristic time of the main phenomena involved in the process are calculated through Eqs.(1) (4)in a temperature range of 800 1400!C and for the two experimental particle sizes used, 0.35 mm and 0.80 mm. Note that Chen experimental conditions[5]are in cluded in this analysis, because the author used the same wood and particle size at a lower temperature. As this approach is very approximate, only the order of magnitude can be taken into consideration.
The particle is externally heated both by radiation and convec tion. Internal heat transfer occurs by conduction. The solid physical properties used for this calculation, as well as the exchange coeffi cient correlation are taken from literature[13,18 22].
Characteristic time calculation for external convective heating of an isothermal particle:
tconvection ð
q
p% Cpp% dpÞ=ð6 % hÞ ð1ÞCharacteristic time calculation for radiation heating of an iso thermal particle: tradiation ð
q
p% Cpp% dpÞ= 6 %x
p%r
% ðTgþ TpÞ % T 2 gþ T2p ! " ! " ð2ÞCharacteristic time calculation for conduction heating of a par ticle body: tconduction
q
p% Cpp% d 2 p ! " =ð36 % keffÞ ð3ÞThe devolatilization characteristic time is based on the kinetic laws determined by Brink and Massoudi [23] and Biagini et al. [24], whose experimental conditions are the closer to those of this work. Their order of magnitude is roughly the same and the mean value of the pyrolysis characteristic time obtained from both authors is considered inTable 4.
Characteristic time calculation for particle pyrolysis.
tpyrolysis 1=kpyrolysis ð4Þ
The ‘‘total pyrolysis time’’ is determined from the phenomena owing the higher characteristic time value, which can be external particle heating, internal heating or devolatilization. Radiation and convection are competitive phenomena for external particle heating, thus the fastest process has to be considered. It is convec tion in the experimental conditions of this study. The result of this analysis is presented inTable 4.
2.3.2. Calculations at the thermodynamic equilibrium
Experimental results were compared to thermodynamic equi librium calculations in order to determine if the overall pyrolysis
Table 4
Main characteristic times involved in the pyrolysis process under the explored experimental conditions.
Characteristic time (s) 800!C 1000!C 1200!C 1400!C 0.35 mm 0.80 mm 0.35 mm 0.80 mm 0.35 mm 0.80 mm 0.35 mm 0.80 mm Convection 0.1 0.5 0.1 0.5 0.1 0.5 0.1 0.5 Radiation 1 2 0.5 1 0.1 0.5 0.1 0.5 Conduction 0.05 0.1 0.05 0.1 0.05 0.1 0.05 0.1 Volatilization 0.5 0.5 0.05 0.05 0.01 0.01 0.005 0.005 TOTAL 0.5 0.5 0.1 0.5 0.1 0.5 0.1 0.5
process attains thermodynamic equilibrium and if not, to identify the reasons why. The thermodynamic equilibrium calculations were performed by GEMINI software that proceeds by minimiza tion of the free enthalpy[13]. Its database includes the thermody namic data of the main compounds presented during pyrolysis at high temperature. The input data are the amount of elements C, H, O in the system, temperature and pressure. A solver minimizes the Gibbs energy of the closed system to give the composition of the mixture. This tool relies on thermodynamic databases that con tain the values of the standard Gibbs energy of the components. Note that in thermodynamic calculations, both char and soot are assumed to be pure carbon in graphitic form.
3. Results and discussion 3.1. Pyrolysis products yields
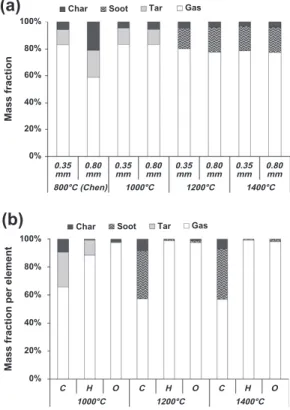
ThroughFig. 2a, it can be seen that high temperature fast pyro lysis produced mainly gas, besides lower amounts of char, tar and soot. Particle size does not seem to have any effect on the products yields, except at 800!C[5]. At this temperature, char and tar show higher yields in the case of large particles. Chen[5]explains that these high yields come from an incomplete wood pyrolysis and tar conversion into gas.
By sampling at different heights in the furnace during pyrolysis of 0.35 mm particles, Chen observed that product yields stabilize by the first centimeters of the reactor, meaning pyrolysis complete conversion is very rapidly achieved. Since 1000!C, particles of this size can then be considered as completely pyrolyzed, as tempera ture increase usually tends to accelerate pyrolysis phenomena (Table 4). As no effect of particle size is observed, the same conclusion can be drawn for 0.80 mm particles. These results are
in agreement with the characteristic time analysis (Table 4): as the overall pyrolysis reaction is very fast above 800!C, the estimated residence time appears to be sufficiently long for bio mass pyrolysis to be completed. On the contrary, for large particles at 800!C, the overall pyrolysis process characteristic time is in the same order of magnitude as the particle residence time. The residence time is then too short for a complete pyrolysis.
At 1000!C, pyrolysis produces 85% of gas, 10% of tar and 5% of char (Fig. 2a). A mean formula can be established for tars from Fig. 2b: C10H4. It can be noticed that this formula contains no oxy
gen and that the hydrogen content of the molecule is quite low. This is characteristic of tars of the tertiary class[25,26], composed mainly of poly aromatic hydrocarbons (PAH) with a very low H/C ratio. The tar formula found is relatively different from the usual model compounds of high temperature tars, naphthalene C10H8
or toluene C6H7[27].
At 1200!C and 1400 !C, gas and char yield slightly decrease to 80% and 3% respectively, and soot is formed with a yield of 17%. No considerable difference is observed between 1200!C and 1400!C. At this range of temperature, almost all of H and O are found in the form of gas (Fig. 2b). This confirms the assumption of the absence of tar at these temperatures.
3.2. Gas analysis
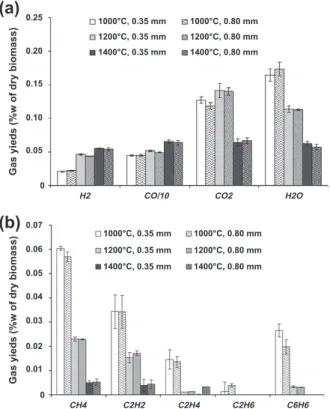
3.2.1. Gas composition evolution
As shown inFig. 3, the main gases are H2, CO, CO2, H2O and the
minor ones are hydrocarbons: CH4, C2and C6H6. Particle size does
not seem to have any effect on gas composition. Note that as total gas yield is almost independent of temperature, comparing gas com position and gas compounds yields brings the same information.
At 1000!C, the gas composition is the result of the early stage of pyrolysis phenomena, which is particle drying and volatilisation, as well as secondary gas reactions. Note that H2O comes from both
initial biomass moisture and gas phase reactions. According to lit erature, gas composition does not change between 800!C and 950!C. The present work shows that above 1000 !C, gas composi tion significantly changes with pyrolysis temperature.
When temperature increases, the main gas composition changes are as follows:
H2 and CO yields increase, whereas H2O yield decreases
(Fig. 3a).
CO2yield slightly increases from 1000!C to 1200 !C, and then
decreases from 1200!C to 1400 !C (Fig. 3a).
Hydrocarbons yields decrease (Fig. 3b). The species C2H6, C2H4,
and tar, disappear completely at 1200!C, as well as C6H6 at
1400!C. At this temperature, only CH4and C2H2remain in low
amounts.
3.2.2. Role of gas phase reactions
At 1000!C, 25% in mass of the initial feedstock is in the form of hydrocarbon, including light species and tar. When temperature is increased, the hydrocarbons yield drastically decreases by 75% at 1200!C and 95% at 1400 !C. The gas reactions that may explain these trends are the following:
Steam reforming : CnHmþ nH2O ! ðn þ m=2ÞH2þ nCO
ðreaction 1Þ 0% 20% 40% 60% 80% 100% C H O C H O C H O 1000°C 1200°C 1400°C
Mass fraction per element
Char Soot Tar Gas 0% 20% 40% 60% 80% 100% 0.35 mm 0.80mm 0.35mm 0.80mm 0.35mm 0.80mm 0.35mm 0.80mm 800°C (Chen) 1000°C 1200°C 1400°C Mass fraction
Char Soot Tar Gas
(a)
(b)
Fig. 2. Global mass balance for 0.35 mm and 0.80 mm samples (a) and mass balance per element (b) at 1000!C, 1200 !C and 1400 !C. The results from Chen at 800!C were included in the global mass balance. Note thatFig. 2b includes only the results from the pyrolysis of 0.35 mm particle size as it has been found that particle diameter has no significant effect on pyrolysis products.
Table 5
Ash content of solid residues (wt.% dry basis).
Sample name (mm) CHAR SOOT
1000!C 1200!C 1400!C 1200!C 1400!C 0.35 11.4 11.8 18.3 0.7 2.4 0.80 9.5 13.7 13.6 0.8 1.7
Carbon dioxide reforming : CnHmþ nCO2! ðm=2ÞH2þ 2nCO
ðreaction 2Þ
Polymerization of HC : CnHm! ðm=2ÞH2þ nCsoot ðreaction 3Þ
Hydrocarbon polymerization(reaction 3)seems to be the major reaction under the explored conditions, leading to a strong forma tion of soot (Fig. 2a) and H2(Fig. 3a). Reforming(reaction 1) and
(reaction 2), responsible for the moderate CO yield increase as the H2O and CO2yield decrease (Fig. 3a), have a minor influence.
Note that the yield of the permanent gases is susceptible to be modified via water gas shift(reaction 4). Therefore, it is not possi ble to establish simple species balances.
Water gas shiftðWGSÞreaction : H2O þ CO $ H2þ CO2
ðreaction 4Þ
3.3. Solid analysis
3.3.1. Reminder about char and soot
Two different solid residues can be distinguished during fast pyrolysis at high temperature (>1000!C), namely char and soot. Char is the fraction of the unvolatilized solid from the initial bio mass; its yield was found to remain constant at the different exper imental temperatures.
Soot is known to be formed through a complex series of poly merization and condensation reactions between hydrocarbon gases, simplified by(reaction 3). Under the explored conditions, soot appears in considerable amounts since 1200!C and its yield tends to stabilize at higher temperature. Even if no considerable amount of soot was found at 1000!C, the process of its formation has started at this temperature. Indeed at 1000!C, tar is essen tially composed of PAH, as mentioned in Section 3.1. These mol ecules, formed by a combination of C2H2 and C6H6, represent a
premature form of soot during its formation. In a further step, they will grow into a bigger aromatic complex until reaching a critical weight and becoming solid particles. Through experimen
0
H2 CO/10 CO2 H2O
Gas yieds (%w of dry biomass)
1000°C, 0.35 mm 1000°C, 0.80 mm 1200°C, 0.35 mm 1200°C, 0.80 mm 1400°C, 0.35 mm 1400°C, 0.80 mm
0
CH4 C2H2 C2H4 C2H6 C6H6
Gas yieds (%w of dry biomass)
1000°C, 0.35 mm 1000°C, 0.80 mm 1200°C, 0.35 mm 1200°C, 0.80 mm 1400°C, 0.35 mm 1400°C, 0.80 mm
(a)
(b)
0.25 0.20 0.15 0.10 0.05 0.07 0.06 0.04 0.03 0.02 0.01 0.05Fig. 3. Experimental pyrolysis yields: results on major gas (a) and hydrocarbons (b) versus temperature and particle size.
Fig. 4. Diagram of molar C, H, O composition for char (a) and soot (b) on a dry, ash free basis. The composition of the initial biomass and of the char obtained at 800!C during Chen pyrolysis experiments are included.
tal observations, this last step seems to need temperatures higher than 1000!C to considerably occur.
3.3.2. Char and soot composition
The composition of char and soot is different. Soot is mostly composed of carbon (Fig. 4b), when char also contains considerable amounts of O, H elements (Fig. 4a) and ash (Table 5). Note that a little ash amount found in soot samples (Table 5) is assumed to come from impurities which were caught during solid collection, refractory unburnt carbon during ash measure experiment, or/ and adsorption of volatilized ash on soot surface during pyrolysis experiments, as hydrocarbons or inorganic matter can easily be fixed on soot surface[28].
Soot and char composition exhibits some variations with tem perature. The carbonaceous seems to lose progressively its O and H, and tends to a composition very rich in carbon as temperature increases.
Biomass particle size has a minor influence on the composition of char or soot, except at 800!C for char where pyrolysis was not completed and then its composition is in evolution.
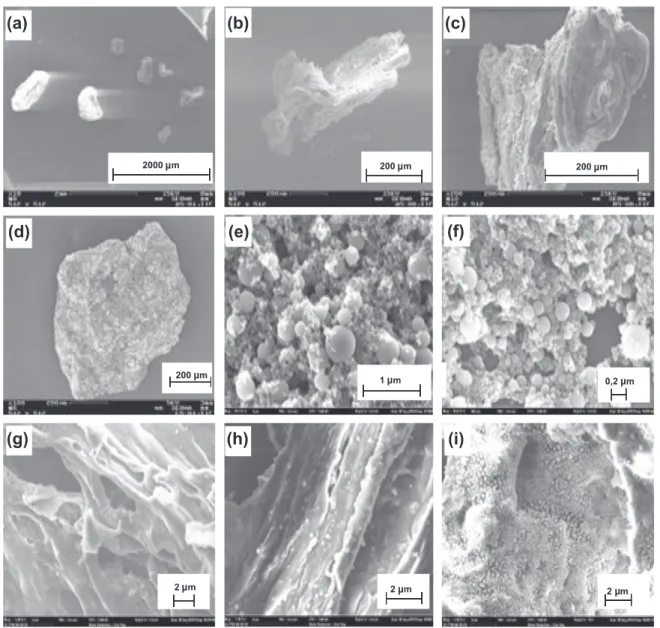
3.3.3. Char and soot structure
Soot appears as an agglomeration of smooth surface spheres with a very heterogeneous size distribution from a few nanometers to several hundreds of nanometers (Fig. 5e and f). No difference be tween soot produced at 1200!C and 1400 !C is observed.
Char appears as a porous solid, whose size is in the same order of magnitude as the one of the initial biomass particle (Fig. 5a). Some sequences of char structure formation during pyrolysis [11,29]are highlighted inFig. 5b d and g i: formation of large cav ities and pores due to the brutal release of volatiles; apparition of irregularities on char surface after char bubbling and fusion fol lowed by recondensation. Nonetheless, some char particles still present the initial fibrous structure of wood (Fig. 5b and h).
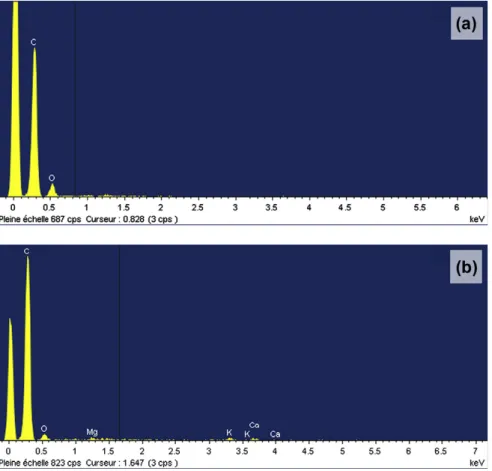
As temperature increases, irregular shape grains tend to appear on char surface (Fig. 5i). XRD analysis shows that char surface with grains is rich in inorganic elements, unlike the rest of the surface (Fig. 6). Therefore, these grains may be made of inorganic salts, which have migrated to the surface and coalesced after fusion, or recondensed after evaporation.
As only few soot particles have been seen in char samples and no char has been observed in soot samples, the assumption of char
2000 m 200 m 2 m 2 m 0,2 m 1 m 200 m 200 m 2 m
(a)
(b)
(g)
(i)
(f)
(e)
(c)
(d)
(h)
and soot segregation in the experimental device appears therefore to be right. Surprisingly, some soot particles have been found in 1000!C char sample. This observation reinforces the assumption that soot formation starts at 1000!C, even if no considerable amounts of soot are produced.
3.4. Comparison with thermodynamic equilibrium
As displayed inFig. 7, the thermodynamic equilibrium appears to remain almost unchanged between 1000!C and 1400 !C. It is not reached experimentally even if results get closer to it at higher temperature. In particular, thermodynamic equilibrium predicts higher yields of H2and CO, and yields of H2O and CO2very close
to zero. Besides, no hydrocarbons are present at thermodynamic
equilibrium calculations, apart from some CH4at 1000!C, whereas
some hydrocarbons can be observed in the experimental results, in particular CH4and C2H2.
At 1000!C, the experimental solid yield is lower than the yield predicted at thermodynamic equilibrium. Above 1200!C, the opposite trend can be observed.
The differences between experimental results and thermody namic equilibrium can be explained by kinetic limitations of the involved reactions. These are the hydrocarbon decomposition reac tions 1 3 and the heterogeneous reactions of gasification ((reac tion 5) and (reaction 6)as shown below).
Fig. 6. XRD spectre of char particle: (a) char surface without grains and (b) char surface with grains.
0
H2 CO/10 CO2 CH4 C2H2 H2O C Solide
Gas yield (%w of dry biomass)
1000°C Exp 1000°C Thermo 1200°C Exp 1200°C Thermo 1400°C Exp 1400°C Thermo 0.25 0.20 0.15 0.10 0.05
Fig. 7. Comparison between experimental gas and solid (char and soot) yields and theoretical yields based on thermodynamic equilibrium at different temperatures. As particle size has shown no effect on solid yield, only the results on the sample 0.35 mm are considered in this histogram.
Temperature (°C) KWGS 800 1000 1200 1400 Experimental Thermodynamic Equilibrium 1 0.1 0.01 0.001
Fig. 8. Water gas shift (WGS) equilibrium constant from the experimental results and the thermodynamic equilibrium calculations. As particle size has shown no effect on solid yield, only the results on the sample 0.35 mm are considered in this graph.
Steam gasification : Csolidþ H2O ! H2þ CO ðreaction 5Þ
Boudouard gasification : Csolidþ CO2! 2CO ðreaction 6Þ
For temperatures below 1300!C, kinetic studies found in the lit erature [27,30,31] show that reforming (especially for CH4 and
C2H2) and gasification reactions require more time to occur than
the residence time in the present pyrolysis experiments. On the contrary, at 1400!C, hydrocarbon reforming and solid gasification reactions need only of few seconds to occur. Hence, at this temper ature, the limitation observed in this work is attributed to the low partial pressure of reactants H2O and CO2.
At 1000!C, soot formation also seems to be limited because there is a lack of carbon solid formation to reach the yield pre dicted by the thermodynamic equilibrium calculations.
Note that water gas shift reaction seems to be close to the ther modynamic equilibrium at all experimental temperatures: the val ues of the water gas shift reaction constant calculated from the experimental results and from thermodynamic equilibrium are in the same order of magnitude, more specifically between a value range of 0.2 and 0.6 (Fig. 8). Therefore, this reaction should have an influence on the final concentration of H2, CO, CO2and H2O.
4. Conclusion
Complete conversion of wood during pyrolysis can be obtained under typical conditions of entrained flow gasifier for almost mil limetric woody biomass particles. Under these conditions, the main product is gas with low tar and char content. However soot, which is an undesirable carbonaceous solid, is produced in large amounts at temperatures higher than 1000!C. This high soot yield is favored by the low H2O and CO2pressure, which is insufficient
for gasification reaction of any carbonaceous solid (including char) or reforming of hydrocarbons soot precursors. Even if carbona ceous solids do not seem to be considerably gasified, they suffer from composition (C, H, O) and ash changes with temperature.
Further work will be done in the same conditions of this study under a gasification atmosphere.
Acknowledgments
The authors would like to acknowledge the experimental sup port during the drop tube reactor experiments provided to them by the Ecole des Mines d’Albi Carmaux, France.
References
[1] Van der Drift A, Boerrigter H, Coda B, Cieplik MK, Hemmes K. Entrained flow gasification of biomass: ash behavior, feeding issues and system analyses. In: ECN; 2004.
[2] Di Blasi C. Combustion and gasification rates of lignocellulosic chars. Prog Energy Combust Sci 2009;35:121–40.
[3] Brem G, Bramer EA, PyRos: a new flash pyrolysis technology for the production of bio-oil from biomass residues. In: Bio energy outlook singapore; 2007.
[4] Bridgwater AV, Meier D, Radlein D. An overview of fast pyrolysis of biomass. Org Geochem 1999;30:1479–93.
[5] Chen L. Fast pyrolysis of millimetric particles between 800!C and 1000 !C, 1. Lyon: Université de Claude Bernard; 2009.
[6] Zanzi R, Sjöström K, Björnbom E. Rapid high-temperature pyrolysis of biomass in a free-fall reactor. Fuel 1996;75:545–50.
[7] Zhang Y, Kajitani S, Ashizawa M, Miura K. Peculiarities of rapid pyrolysis of biomass covering medium- and high-temperature ranges. Energy Fuels 2006;20:2705–12.
[8] Zhang Y, Kajitani S, Ashizawa M, Oki Y. Tar destruction and coke formation during rapid pyrolysis and gasification of biomass in a drop-tube furnace. Fuel 2010;89:302–9.
[9] Qin K, Lin W, Jensen PA, Jensen AD, Egsgaard H. Influence of operating conditions on gas composition, soot and tar in entrained flow gasification of biomass. In: Joint meeting of the scandinavian-nordic and French sections of the combustion institute. Danemark: Copenhaguen; 2009.
[10] Wei L, Xu S, Zhang L, Zhang H, Liu C, Zhu H, et al. Characteristics of fast pyrolysis of biomass in a free fall reactor. Fuel Process Technol 2006;87:863–71.
[11] Dupont C, Commandré JM, Gauthier P, Boissonnet G, Salvador S, Schweich D. Biomass pyrolysis experiments in an analytical entrained flow reactor between 1073 K and 1273 K. Fuel 2008;87:1155–64.
[12] Bitowft B, Andersson LA, Bjerle I. Fast pyrolysis of sawdust in an entrained flow reactor. Fuel 1989;68:561–6.
[13] Dupont C, Boissonnet G, Seiler J-M, Gauthier P, Schweich D. Study about the kinetic processes of biomass steam gasification. Fuel 2007;86:32–40. [14] Misra MK, Ragland KW, Baker AJ. Wood ash composition as a function of
furnace temperature. Biomass Bioenergy 1993;4:103–16.
[15] Dupont C. Vapogazéification de la biomasse: contribution à l’étude de la phénoménologie entre 800 et 1000!C. Lyon: Université Claude Bernard; 2006. [16] Commandré J-M. Formation des oxydes d’azote lors de la combustion de cokes
de pétrole dans des conditions de précalcinateur de cimenterie; 2002. [17] Van de Steene L. Thermochimie de la combustion à basses températures de
solides pulvérisés: application à un charbon. INPT, Toulouse; 1999. [18] Miller. Structure of wood. In: Wood handbook forest products
laboratoy. Madison, Wisconsin: USDA Forest Services; 1999.
[19] Gómez-Barea A, Ollero P, Arjona R. Reaction-diffusion model of TGA gasification experiments for estimating diffusional effects. Fuel 2005;84:1695–704.
[20] Groeneveld MJ, van Swaaij WPM. Gasification of char particles with CO2and
H2O. Chem Eng Sci 1980;35:307–13.
[21] Gupta M, Yang J, Roy C. Specific heat and thermal conductivity of softwood bark and softwood char particles. Fuel 2003;82:919–27.
[22] Mermoud F, Salvador S, Van de Steene L, Golfier F. Influence of the pyrolysis heating rate on the steam gasification rate of large wood char particles. Fuel 2006;85:1473–82.
[23] Brink DL, Massoudi MS. A flow reactor technique for the study of wood pyrolysis. I. Experimental. J Fire Flammabl 1978;9:176–88.
[24] Biagini E, Fantozzi C, Tognotti L. Characterization of devolatilization of secondary fuels in different conditions. Combust Sci Technol 2004;176:685–703.
[25] Evans RJ, Milne TA. Molecular characterization of the pyrolysis of biomass. 1. Fundamentals. Energy Fuels 1987;1:123–37.
[26] Evans RJ, Milne TA. Molecular characterization of the pyrolysis of biomass. 2. Applications. Energy Fuels 1987;1:310–9.
[27] Hiblot H. Etude cinétique du réformage thermique des produits issus de la gazéification de la biomasse. University of Nancy; 2010.
[28] Stanmore BR, Brilhac JF, Gilot P. The oxidation of soot: a review of experiments, mechanisms and models. Carbon 2001;39:2247–68.
[29] Cetin E, Moghtaderi B, Gupta R, Wall TF. Influence of pyrolysis conditions on the structure and gasification reactivity of biomass chars. Fuel 2004;83:2139–50.
[30] Valin S, Cances J, Castelli P, Thiery S, Dufour A, Boissonnet G, et al. Upgrading biomass pyrolysis gas by conversion of methane at high temperature: experiments and modelling. Fuel 2009;88:834–42.
[31] Wei L, Xu S, Zhang L, Liu C, Zhu H, Liu S. Steam gasification of biomass for hydrogen-rich gas in a free-fall reactor. Int J Hydrogen Energy 2007;32:24–31.