Université de Montréal
Caractérisation du gène de l'enzyme de conversion de
l'angiotensine-2 dans le rein diabétique et implication dans le
développement de la néphropathie diabétique et de l'hypertension
Par Yixuan Shi
Programme de sciences biomédicales Faculté de médecine
Thèse présentée à la faculté des études supérieures en vue de l’obtention du grade de docteurès sciences (Ph.D.)
en sciences biomédicales
July 2014
Université de Montréal
Caractérisation du gène de l'enzyme de conversion de
l'angiotensine-2 dans le rein diabétique et implication dans le
développement de la néphropathie diabétique et de l'hypertension
Par Yixuan Shi
a été évaluée par un jury composé des personnes suivantes :
Dre Jolanta Gutkowska Présidente rapporteuse Dr John S.D. Chan Directeur de recherche Dre Shao-Ling Zhang Codirectrice de recherche Dr Stéphan Troyanov Membre du jury Dr David Cherney Examinateur externe
Résumé
De nombreuses études ont bien démontré que l’activation du système rénine-angiotensine (RAS) joue un rôle important dans le développement de l’hypertension et de la néphropathie diabétique (DN). La découverte de l’enzyme de conversion de l’angiotensine-2 (ACE2) et l’identification du récepteur MAS, spécifique pour l’angiotensine 1-7 (Ang 1-7), ont permis d’identifier deux nouveaux membres du RAS. L’axe ACE2/Ang 1-7/MAS contrebalance les effets de l’axe ACE/Ang II/AT1. Plusieurs évidences impliquent la contribution du RAS intrarénal dans la DN. Des études réalisées dans notre laboratoire avec des souris transgéniques surexprimant l’angiotensinogène de rat dans les cellules de leurs tubules proximaux rénaux (RPTCs) ont permis de démontrer l’importance du RAS intrarénal dans l’induction de l’hypertension et les dommages rénaux. Nous avons également observé que l’expression rénale de l’ACE2 et les niveaux urinaires d’ANG 1-7 sont plus faibles chez les souris Akita (diabète de type 1) et qu’un traitement avec des bloqueurs du RAS permet de normaliser l’expression de l’ACE2 et de prévenir le développement de l’hypertension dans le modèle des souris Akita. Dans un milieu diabétique, à la fois la glycémie et l’angiotensine II (Ang II) peuvent induire la génération des espèces réactives de l’oxygène (ROS), contribuant ainsi aux dommages rénaux. Afin d’explorer la relation entre les ROS, ACE2 et la DN, nous avons créé des souris Akita transgéniques surexprimant la catalase (Cat) dans les RPTCs, en croisant des souris Akita diabétique de type 1 à notre modèle de souris transgéniques surexprimant la Cat de rat dans les RPTCs. Dans une seconde étude, des souris Akita ont été traitées avec l’Ang 1-7 ou une combinaison d’Ang 1-7 et de son antagoniste, A779, afin
d’étudier la relation entre l’action de l’Ang 1-7, l’hypertension systolique (sHTN), le stress oxydatif, les dommages rénaux, ACE2 et l’expression du récepteur Mas.
Nos résultats ont montré que la surexpression de Cat atténue le stress oxydatif rénal; prévient l’hypertension, améliore le taux de filtration glomérulaire, l’albuminurie, l’hypertrophie rénale, la fibrose tubulo-interstitielle et l’apoptose tubulaire; et supprime l’expression des gènes profibrotiques et proapoptotiques dans les RPTCs des souris Akita Cat-Tg lorsque comparées aux souris Akita. De plus, la surexpression de Cat dans les RPTC des souris Akita normalise l’expression rénale de l’ACE2 et les niveaux urinaires d’Ang 1-7.
D’autre part, l’administration d’Ang 1-7 prévient l’hypertension systémique, normalise le ratio albumine/créatinine urinaire et atténue l’hyperfiltration glomérulaire des souris Akita, sans affecter la glycémie sanguine. De plus, le traitement avec l’Ang 1-7 atténue aussi le stress oxydatif et l’expression de la NADPH oxydase, Agt, ACE, TGF-β1 (transforming growth factor-β1) et collagène IV, tout en augmentant l’expression de l’ACE2 et du récepteur Mas dans les reins des souris Akita. Ces effets sont renversés par la co-admininstration d’A779. Ces résultats démontrent que la surexpression de Cat prévient l’hypertension et la progression de la néphropathie, en plus de mettre en lumière l’importance du stress oxydatif intrarénal et l’expression de l’ACE2 comme facteurs contribuant à l’hypertension et les dommages rénaux observés dans le diabète. En outre, nos données suggèrent que l’Ang 1-7 joue un rôle protecteur dans l’hypertension et les dommages aux RPTC dans le diabète, principalement en réduisant les voies de signalisations du stress oxydatif dans les reins et en normalisant l’expression de l’ACE2 et du récepteur Mas. Nos résultats indiquent aussi que l’Ang 1-7 pourrait agir comme un agent thérapeutique potentiel dans le traitement de l’hypertension
systémique et les dommages rénaux observés dans le diabète. En conséquence, l’Ang 1-7 est responsable du rôle protecteur de l’ACE2 dans l’hypertension et la DN.
Mots-clés: Rein, système rénine-angiotensine, enzyme de conversion de l’angiotensine-2, catalase, hypertension, angiotensine 1-7, récepteur Mas, néphropathie diabétique, apoptose, fibrose tubulo-interstitielle, espèces réactives de l’oxygène, NADPH oxydase
Abstract
It is well accepted that renin-angiotensin system (RAS) activation plays an important role in the development of hypertension and diabetic nephropathy (DN). With the discovery of angiotensin-converting enzyme-2 (ACE2) and recognition of MAS as the receptor of Angiotensin 1-7 (Ang 1-7), new players in RAS, ACE2/Ang 1-7/MAS axis, have been identified to counteract the effect of ACE/Ang II/ AT1 axis. Evidence implicates the intrarenal RAS’s contribution to DN. Previous studies from our laboratory using transgenic mice overexpressing rat Angiotensinogen (Agt) in their renal proximal tubular cells (RPTCs) have demonstrated the importance of the intrarenal RAS in renal damage and the induction of hypertension. We also recently observed that renal ACE2 expression and urinary Ang 1–7 were lower in type 1 diabetic Akita mice and that treatment with RAS blockers normalized ACE2 expression and prevented hypertension development in these Akita mice. In the diabetic milieu, both glycemia and angiotensin II (Ang II) can induce reactive oxygen species (ROS) generation, which contributes to kidney injury. To explore the relationship among ROS, ACE2 and DN, we created Akita transgenic mice overexpressing catalase (Cat) in RPTCs by crossbreeding type I diabetic Akita mice with our established transgenic mice overexpressing rat Cat in RPTCs. In another study, Akita mice were treated with Ang 1-7 or combination of Ang 1-7 and its antagonist, A779, to investigate the relations between Ang 1-7 action, systolic hypertension (sHTN), oxidative stress, kidney injury, ACE2 and Mas receptor expression. Our results showed that overexpression of Cat attenuated renal oxidative stress; prevented hypertension; ameliorated glomerular filtration rate, albuminuria, kidney hypertrophy, tubulointerstitial fibrosis, and tubular apoptosis; and suppressed profibrotic and proapoptotic
gene expression in RPTCs of Akita Cat-Tg mice compared with Akita mice. Furthermore, overexpression of Cat in RPTCs of Akita mice normalized renal ACE2 expression and urinary Ang 1–7 levels.
On the other hand, Ang 1-7 administration prevented systemic hypertension, normalized urinary albumin/creatinine ratio and attenuated glomerular hyperfiltration without affecting blood glucose levels in Akita mice. Furthermore, Ang 1-7 treatment also attenuated oxidative stress and the expression of NADPH oxidase 4, Agt, ACE, transforming growth factor-β1 (TGF-β1) and collagen IV, and increased the expression of ACE2 and Mas receptor in Akita mouse kidneys. These effects were reversed by co-administration of A779.
These data demonstrated that Cat overexpression prevents hypertension and progression of nephropathy and highlight the importance of intrarenal oxidative stress and ACE2 expression contributing to hypertension and renal injury in diabetes. Furthermore, our data suggest that Ang 1-7 plays a protective role in hypertension and RPTC injury in diabetes, predominantly through decreasing renal oxidative stress-mediated signaling and normalizing ACE2 and Mas receptor expression. Our results also indicate Ang 1-7 as a potential therapeutic agent for treatment of systemic hypertension and kidney injury in diabetes. Therefore, Ang 1-7 mediates the major protective role of ACE2 in the hypertension and DN.
Key words: Kidney, renin-angiotensin system, angiotensin-converting enzyme 2, catalase, hypertension, Angiotensin 1-7, Mas receptor, diabetic nephropathy, hypertension, apoptosis, tubulointerstitial fibrosis, reactive oxygen species, NADPH oxidase
Table of Contents
Résumé………..…..iii Abstract………...vi Table of Contents……….………...viii List of Tables……….…...xii List of Figures………....………..xiii List of Abbreviations………...xvi Acknowledgements……….………...xix Chapter 1—Introduction 1.1 Renal physiology and histology………. 21.1.1 Renal physiology………... 2
1.1.2 Renal histology………... 2
1.1.2.1 Renal filtration barrier………... 3
1.1.2.2 Podocyte………..………... 4
1.1.2.3 Proximal tubule……… 6
1.1.2.4 Other components of a nephron………...………... 8
1.2 Pathological changes in kidney diseases………... 11
1.3 Chronic kidney diseases………... 12
1.3.1 CKD and GFR………...………... 12
1.3.2 Incidence, prevalence and cause of ESRD……….. 14
1.4 Diabetes mellitus (DM)……….……… 15
1.4.1 Prevalence and cost of diabetes………... 15
1.4.2 Pathogenesis of diabetic complications………... 17
1.4.3 ROS and oxidative stress………..………... 18
1.4.3.1 Mitochondrial origin of ROS………..………... 18
1.4.3.2 NADPH oxidase………...………... 19
1.4.3.3 Catalase, SOD, GPX and Nrf2………...22
1.5 Diabetic nephropathy (DN)……….. 25
1.5.1.1 Hypertension and DN ………... 27
1.5.1.2 Oxidative stress in DN ……….………. 28
1.5.1.3 Aldose reductase and DN ……… 29
1.5.1.4 AGEs and DN ……….……….. 30
1.5.1.5 PKC and DN ………... 32
1.5.1.6 Hexosamine pathway flux and DN……….…………... 33
1.5.1.7 TGF-β and DN ………... 36
1.5.2 Apoptosis and diabetic kidneys………... 38
1.5.2.1 General apoptosis pathways………... 38
1.5.2.2 Apoptosis in diabetic glomeruli..………... 40
1.5.2.3 Apoptosis in diabetic tubules………... 40
1.6 Renin-angiotensin system (RAS)……….………. 41
1.6.1 Systemic RASs……… 41
1.6.2 Local RASs ………... 43
1.6.3 Intrarena RAS activation…..………...……… 44
1.6.3.1 Animal models of RAS ……….……… 44
1.6.3.1.1 RAS knock-out (KO) mice………... 44
1.6.3.1.2 Transgenic (Tg) mice overexpressing systemic RAS……….…… 47
1.6.3.1.3 Tg mice overexpressing intrarenal RAS……….………. 48
1.6.3.1.4 Tg mice in the present study………. 49
1.6.4 RAS paradox………... 50
1.6.4.1 Haemodynamic effects of Ang II………... 50
1.6.4.2 Non-haemodynamic effects of Ang II………... 51
1.6.5 ACE2/ Ang 1-7/MAS axis………... 51
1.6.5.1 ACE2……….…... 51
1.6.5.2 Ang 1-7……….…… 54
1.6.5.3 MAS………..…... 56
1.6.6 Clinical trials of RAS blockade in diabetic patients………... 58
1.7 Animal models of DN research………. 59
Chapter 2—Article 1
Overexpression of Catalase Prevents Hypertension and Tubulointerstitial Fibrosis and Normalization of Renal Angiotensin-Converting Enzyme-2 Expression in Akita Mice
2.1 Abstract………... 66
2.2 Introduction………... 67
2.3 Research Design and Methods……….………... 69
2.4 Results………... 73
2.5 Discussion……….. 78
2.6 Acknowledgements………... 83
2.7 Reference List……… 84
2.8 Legends and Figures………... 87
Chapter 3—Article 2 Ang 1-7 Prevents Systemic Hypertension, Attenuates Oxidative Stress and Tubulointerstitial Fibrosis, Normalizes Renal Angiotensin-Converting Enzyme 2 and Mas Receptor Expression in Diabetic Mice 3.1 Abstract………... 102
3.2 Introduction………... 103
3.3 Research Design and Methods……….……….…...104
3.4 Results………. 109
3.5 Discussion………... 114
3.6 Clinical Perspectives………... 118
3.7 Acknowledgements………. 120
3.8 Reference List………. 121
Chapter 4—Discussion
4.1 Intrarenal RAS and ACE2 in DM………... 144
4.2 Tg mouse model overexpressing Cat in the RPTCs………... 146
4.3 ACE2, Ang 1-7 and hypertension in diabetic mice………... 147
4.4 Antioxidants and hypertension……… 150
4.5 ROS, Cat and ACE2/Ang 1-7 in DM………...151
4.5.1 ROS generation in DM……….. 151
4.5.2 Ang 1-7 and ROS………...153
4.5.3 Cat overexpression upregulates ACE2……… 153
4.5.4 Ang 1-7 upregulates ACE2 and Mas receptor……….... 155
4.6 Cat, ACE2/Ang 1-7 and kidney injury in diabetic mice………. 155
4.6.1 Proteinuria in diabetic mice……….…….. 155
4.6.2 Tubulointerstitial injury in DN……….…... 157
4.6.3 RAS, Cat and tubular hypertrophy……… 158
4.6.4 Cat, RAS and tubulointerstitial fibrosis……… 159
4.6.5 Cat, Ang 1-7 and tubular apoptosis………... 161
4.7 Comparison between Ang 1-7 and RAS blocker……… 162
4.8 ACE2 and non-diabetic kidney disease………... 163
4.9 Limitations of the present study……….. 164
Chapter 5—Unpublished Results and Perspectives of Research 5.1 Generation of ACE2 Transgenic mice ... 166
5.2 Kidney-specific ACE2 KO mice and DN... 169
Chapter 6— References Reference... 172
List of Tables
Table 1-1. The 5 stages of chronic kidney disease (CKD) (page 13) Table 1-2. Average estimated GFR by age (page 13)
Table 1-3. Baseline cardiovascular phenotypes in ACE2 knockout mice (page 54) Table 1-4. Selected mouse models of diabetes studied for DN (page 60)
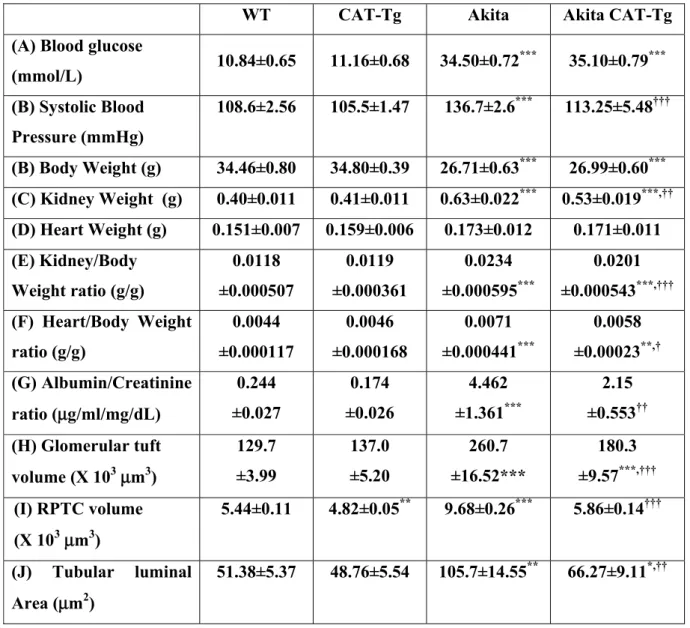
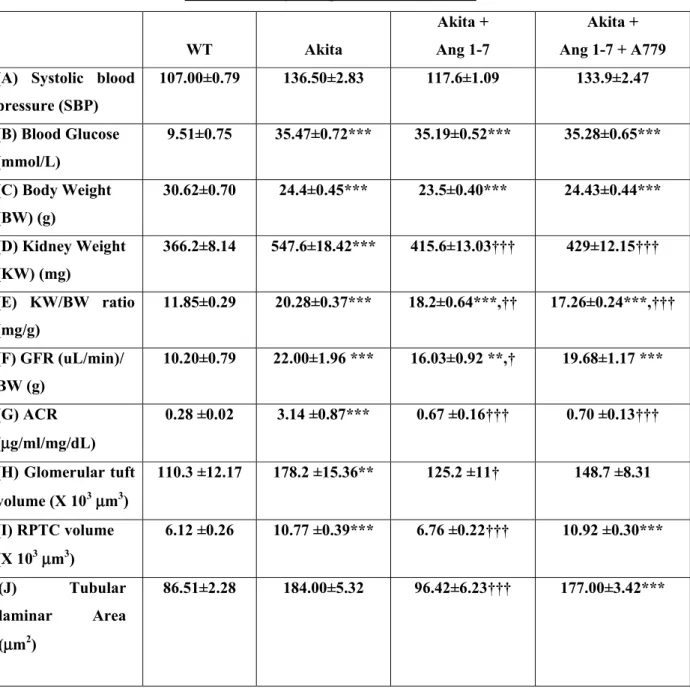
Table 2-1. Physiological Measurements (page 87) Table 3-1. Physiological Measurements (page 124) Supplemental Table 1. Primers (page 141)
List of Figures
Figure 1-1: Diagram of nephron (page 3)Figure 1-2: Schematic diagram of the glomerular filtration barrier (page 4)
Figure 1-3: Hypothetical model of nephrin assembly to form the isoporous filter of the podocyte slit diaphragm (page 6)
Figure 1-4: Proximal tubule. The arrows shows the brush border (page 6) Figure 1-5: Glucose transport in the kidney (page 7)
Figure 1-6: (A): Percentage sodium reabsorption over the length of the nephron. Principal mechanisms of sodium reabsorption are shown in the proximal tubule (B), the thick ascending loop of Henle (C), the distal convoluted tubule (D), and the collecting duct (E). (page 9) Figure 1-7: The juxtaglomerular apparatus (page 10)
Figure 1-8: The microscopic appearance of end-stage renal disease (page 11) Figure 1-9: (A): Normal kidney; (B): ESRD (page 12)
Figure 1-10: Causes of ESRD (page 14)
Figure 1-11: Global Prevalence of DM (page 16) Figure 1-12: Cost of Diabetes in Canada (page 17) Figure 1-13: Mitochondrial ROS production (page 19)
Figure 1-14: Assembly of the phagocyte NADPH oxidase NOX2 (page 20) Figure 1-15: Activation of NADPH oxidase isoforms (page 21)
Figure 1-16: Left: Normal kidney. Right: Glomerulus from a type 1 diabetic with diffuse and nodular mesangial expansion and afferent and efferent arteriolar hyalinosis (page 26)
Figure 1-17: Left: Glomerulus from a T1DM patient with nodular (Kimmelstiel-Wilson) lesions. Right: Renal biopsy from a T2DM patient with hyalinosis of the afferent and efferent glomerular arterioles, interstitial expansion and tubular atrophy. (page 26)
Figure 1-18: Aldose reductase and the polyol pathway (page 30)
Figure 1-19: The formation of advanced glycation end products (AGE), through a variety of echanisms, leads to diabetic nephropathy (page 31)
Figure 1-20: Physiological effects and cellular mechanisms of DAG–PKC activation induced hyperglycemia (page 32)
Figure 1-22: Schematic showing elements of the unifying mechanism of hyperglycemia-induced cellular amage (page 35)
Figure 1-23: Schematic representation of the large latent TGF-β complex (page 36)
Figure 1-24: Model showing positive and negative controls on TGF- β signalling (page 37) Figure 1-25: Intrinsic and extrinsic apoptosis pathways (page 39)
Figure 1-26: RAAS schematic (page 41)
Figure 1-27: Schematic representation of ACE-Ang II-AT1R axis and ACE2-Ang-Mas axis (page 42)
Figure 1-28: Cascade of intratubular RAS in Ang II–dependent hypertension (page 44)
Figure 1-29: Schematic map of the kidney androgen-regulated promoter (KAP2)-rat angiotensinogen (rAgt) construct (page 49)
Figure 1-30: Domain structures of ACE, ACE2 and Collectrin (page 52) Figure 1-31: Signaling pathways for Ang 1-7 in proximal tubule (page 56) Figure 2-1: Generation of Akita Cat-Tg mice (page 88)
Figure 2-2: Effect of overexpression of Cat in RPTCs on systolic blood pressure (SBP), glomerular filtration rate (GFR), urinary Agt, Ang II and Ang 1-7 levels and serum Ang II level in Akita mice (page 90)
Figure 2-3: Agt, Ace2 and ACE expression in mouse kidneys at the age of week 20 (page 92) Figure 2-4: PAS staining, Masson’s trichrome staining, collagen IV and TGF-β1 expression in mouse kidneys at the age of week 20 (page 94)
Figure 2-5: Apoptosis in mouse kidneys at the age of week 20 (page 96)
Figure 2-6: Effect of Ang 1-7 with or without A-779 on SBP in Akita mice (page 98)
Figure 3-1: Immunohistochemical staining for Cat, dihydroethidium (DHE) and 6-carboxy-2',7'-dichlorodihydrofluorescein diacetate (carboxy-H2DCFDA) in male mouse kidneys at age 20 weeks (page 125)
Figure 3-2: ROS generation, NADPH oxidase activity, Nox 1, 2 and 4 expressions in mouse RPTs at age 20 weeks (page 127)
Figure 3-3: Nrf2 and HO-1 expression in mouse kidneys at age 20 weeks (page 129) Figure 3-4: Agt expression in mouse kidneys at age 20 weeks (page 131)
Figure 3-5: Immunostaining for ACE, Ace2 and MasR expression in mouse kidneys at age 20 weeks (page 133)
Figure 3-6: Immunostaining for TACE (A) and NHE-3 (B) in mouse kidneys at age 20 weeks (page 135)
Figure 3-7: PAS staining, Masson’s trichrome staining and immunostaining for collagen IV and TGF-β1 expression in mouse kidneys at age 20 weeks (page 137)
Figure 3-8: Apoptosis in mouse kidneys at age 20 weeks (page 139)
Figure 4-1: Schematic diagram of regulation of ACE2 by Cat and Ang 1-7 (page 154) Figure 5-1: Schematic map of the KAP2hACE2 construct (page 166)
Figure 5-2: Analysis of clonality by Southern blotting (page 167) Figure 5-3: Tissue specific expression of hACE2 Tg (page 167) Figure 5-4: Immunostaining for ACE2 (page 168)
Figure 5-5: Western blotting of ACE2 (page 168) Figure 5-6: A model of Cre Function (page 169)
Figure 5-7: Generation of RPTCs-specific KO mice (page 170)
List of Abbreviations
α-SMA: α-smooth muscle actinACE: angiotensin converting enzyme
ACEi: angiotensin converting enzyme inhibitor ADA: American Diabetes Association
AGEs: advanced glycation end-products Agt: Angiotensinogen
AMDCC: the Animal Models of Diabetic Complications Consortium Ang I: angiotensin I
Ang II: angiotensin II Ang 1-7: angiotensin 1-7 AR: aldose reductase
ARBs: angiotensin receptor blockers AT1R: angiotensin II subtype I receptor AT2R: angiotensin II sybtype 2 receptor
BENEDICT: Bergamo Nephrologic Diabetes Complications Trial BP: blood pressure
Cat: Catalase
CDA: Canadian Diabetes Association CKD: Chronic kidney Diseases Co-Smad: common Smad DAG: diacylglycerol
DISC: death-inducing signalling complex DM: Diabetes mellitus
DN: Diabetic nephropathy ECM: extracellular matrix
EC-SOD: extracellular superoxide dismutase ELISA: Enzyme-Linked ImmunoSorbent Assay EMT: epithelial-mesenchymal transition
eNOS: endothelial nitric oxide synthase ER: endoplasmic reticulum
ERK: extracellular signal-regulated kinase ESRD: end–stage renal disease
FADD: Fas-Associated via Death Domain FasL: Fas ligand
GAPDH: Glyceraldehyde 3-phosphate dehydrogenase GBM: glomerular basement membrane
GFAT: glutamine: fructose-6 phosphate amidotransferase GFR: glomerular filtration rate
GlcNAc: N-acetyl glucosamine GPCR: G protein-coupled receptors GPxs: Glutathione peroxidases GSH: reduced glutathione HE: hematoxylin-eosin
ICA: Islet cell antibodies
ICAM-1: intercellular adhesion molecule-1 IDF: International diabetes federation
IRPTCs: immortalized renal proximal tubular cells
JAK/STAT: Janus kinase/signal transducers and activation of transcription JG apparatus: Juxtaglomerular apparatus
JNK/SAPK: c-Jun N-terminal kinase/stress-activated protein kinase KAP: kidney androgen-regulated protein
KO: knockout
LAP: latency associated protein
MAPKs: mitogen-activated protein kinases MCP-1: monocyte chemoattractant protein-1 MMPs: matrix metalloproteinases
mRNA: messenger RNA
NADPH: nicotinamide-adenine dinucleotide phosphate NCC: NaCl cotransporter
NKCC2: Na+-K+-2Cl- cotransporter NEP: neutral endopeptidase
NF-κB: nuclear factore-κB
NHE: sodium-hydrogen exchanger
NIDDK: National Institute of Diabetes and Digestive and Kidney Diseases NKF: National Kidney Foundation
NO: nitric oxide
NOD: nonobese diabetic NOX: NADPH Oxidase
Nrf2: Nuclear factor erythroid 2-related factor ONOO- : peroxynitrite anion
PA: plasminogen activator
PAI-1: plasminogen activator inhibitor-1 PARP: poly (ADP-ribose) polymerase PKC: protein kinase C
PPARs: Peroxisome proliferator-activated receptors PS: phosphatidyl serine
PTCs: proximal tubular cells PTs: proximal tubules RAGE: receptor for AGEs RAP: receptor-associated protein RAS: renin-angiotensin system RIA: radioimmunoassay
ROS: Reactive Oxygen Species RPT: renal proximal tubules RPTC: renal proximal tubular cells R-Smads: receptor-regulated Smads SBP: systolic blood pressure
SD rats: Sprague Dawley rats
SHR: spontaneous hypertension rat SOD: superoxide dismutase
STZ: streptozotocin T1D: type 1 diabetes T2D: type 2 diabetes
TACE: tumor necrosis factor-α-converting enzyme TAL: thick ascending limb
Tg: transgenic
TGF-β1: transforming growth factor-β1 TGF β RI: TGF-β receptor I
TGF β RII: TGF-β receptor II
TRADD: TNF receptor-associated death domain
TUNEL: Terminal deoxynucleotidyl transferase dUTP nick end labeling VEGF: vascular endothelial growth factor
Acknowledgements
Foremost, I would like to express my sincere gratitude to my advisor Dr. John S.D. Chan for the continuous support of my PhD study and research and for his patience, motivation, enthusiasm, perseverance and immense knowledge. I would also like to thank my co-director Dr. Shao-Ling Zhang for her academic direction.
I would also like to thank my committee members, Dr. Jolanta Gutkowska, Dr. Stéphan Troyanov and Dr. David Cherney for reading and commenting my thesis manuscript.
Moreover, I would like to express my gratitude to all the members of Dr. John S.D Chan and Dr. Shao-Ling Zhang’s laboratory, specifically, Ms. Isabelle Chénier, Dr. Chao-Sheng Lo, Shiao-Ying Chang, Xinping Zhao, Min-Chun Liao and Yessoufou Aliou. I appreciate all the generous help from them.
I would like to express my sincere gratitude to Ju Jing Tan for proofreading my manuscript.
I also would like to thank all the friends – past and present – of my life for sharing my pressure and joy.
Last but not least, I am grateful to my family. The love and support from my wife and my son are my sources of energy.
1.1 Renal physiology and histology 1.1.1 Renal physiology
The kidney participates in whole-body homeostasis, regulating acid-base balance, extracellular fluid volume, electrolyte concentrations and blood pressure. It produces urine, in which various metabolic waste products are removed. Urine is continuously formed from an ultrafiltrate of plasma from which glucose, amino acids, water and other essential substances have been reabsorbed. Specific secretion also occurs to transfer the substances that are present in great excess or are natural poisons. The kidney also maintains the proper balance of water and minerals, including electrolytes, in the body, even though the dietary intake of water and salt may vary. In addition, the kidney can synthesize some hormones including 1,25 OH vitamin D, erythropoietin, and renin.
Nephron is defined as the essential structural and functional unit of the kidney. In the structural context, each nephron consists of a renal corpuscle (glomerulus and Bowman's capsule), and a tubule unit including proximal tubule, loop of Henle and distal tubule (Figure 1-1). There are approximately 1.7 to 2.4 million nephrons in both kidneys of normal adult. 1.1.2 Renal histology
At the beginning of the nephron, the glomerulus is a network of capillaries that receives its blood supply from an afferent arteriole of the renal circulation. The glomerulus is surrounded by Bowman's capsule, which is an expansion at the closed end of a renal tubule. The blood plasma is filtered through the capillaries of the glomerulus into the Bowman's capsule. The ultrafiltrate collects within the Bowman's capsule and then flows into the proximal tubule. The glomerulus drains into an efferent arteriole.
Figure 1.1.2.1 Accord interde membr to sma The cr multip diaphra 1-1. Diagram 1 Glomerula ding to th ependent lay rane (GBM all-to-mid-si ritical role o le example agm domain m of nephron ar filtration b he classical yers: the in ), and the o ized solutes of the podo s of both in n [2, 3]. n [1] barrier: l view, th nnermost g outermost po in plasma b ocyte in the nherited and he glomeru lomerular e odocytes (F but retains r prevention d acquired ular filtratio endothelial Figure 1-2). relative imp n of proteinu injury to th on barrier cells, the g It displays ermeability uria has be he podocyte consists o glomerular b a high con to macrom en demonst e, especially of three basement ductance molecules. trated by y the slit
Figure compon in cross The ext as a cen actin fil 1.2.2.2 The ce and, fin An alm into th cell ju 1-2. Schem nents of the s-section and tracellular do ntral compon laments. 2 Podocyte ell body sits
nally, fine in most univers he urine from unction betw matic diagra barrier (glyc d podocyte sl omains of ne nent of the ‘ s in the urin nterdigitatin sal finding i m the plasm ween these am of the cocalyx and e lit diaphragm ephrin are re zipper’ form nary space, ng foot proc in nephrotic ma) is flatten foot proces glomerular endothelium m on the urin epresented at mation, and th from which cesses, whic c disease sta ning or effa sses is thou filtration b on the capil nary side) and
the slit diap he cytoplasm
h extend pri ch encircle th
tes (in whic acement of ught to be a barrier [4], llary side, po d glomerular phragm, span mic tail of ne imary and s he capillary ch large amo these foot p a key signa indicating f odocyte foot r basement m nning the cel
phrin links t secondary p y on its oute ounts of pro processes. T alling and s functional processes membrane. l junction to cortical processes r side. otein leak The cell– structural
domain. The slit diaphragm is a cell–cell junction that shares features of tight and adherens junctions [5] and displays anatomical regularity, with a gap of 40 nm thought to restrict the passage of proteins any larger than albumin. The gap is cross-linked by extracellular proteins, of which the transmembrane protein nephrin forms a major component, forming globular strands of 35 nm in length [6].
There is a consensus that podocyte response to injury follows a similar path regardless of the original cause of podocyte injury (genetic, environmental, or both). Podocyte injury leads to effacement of the podocyte foot processes, i.e. loss of membrane extension, which involves reorganization of the actin network. These early structural changes within the podocyte result in proteinuria. If these changes are not reversed, podocyte detachment and loss occurs with subsequent development of obliteration of the urinary space, segmental glomerulosclerosis, and finally, end-stage renal failure [7]. Growth factor receptors such as vascular endothelial growth factor (VEGF) and transforming growth factor β (TGF-β1), G protein-coupled receptors (GPCRs) such as the angiotensin type 1 receptor (AT1R), signalling through integrins, and ion channels, like the TRPCs, have been implicated in early podocyte injury [8]. Nephrin assembles into a zipper-like isoporous filter structure of the podocyte slit diaphragm, forming a part of the size-selective glomerular filtration barrier (Figure 1-3) [9]. Patients with nephrin mutations, which were originally found in cohorts of Finnish patients (Finnish-type nephrotic syndrome), display the earliest and most severe clinical phenotype, indicating an essential role for this protein in the intact filtration [10]. Abnormalities in nephrin expression have also been demonstrated in other human proteinuric renal diseases and in a range of experimental renal diseases associated with proteinuria [11, 12].
Figure diaphra associa 1.1.2.3 The pr proxim end of increas absorb Figure 1-3. Hypoth agm. (A) S ation of four n 3 Proximal t roximal tub mal straight f proximal t sed surface bing small m 1-4. Proxima hetical model chematic do nephrin mole tubule bule can be tubule. It is tubule cell h e area to a molecules fro al tubule. The l of nephrin omain struct ecules in the divided int s a major sit has a brush accommodat om the filtra e arrows sho assembly to ture of nep slit between to two parts te for reabs border of m te the mem ate in the tub
ows the brush
form the iso phrin. (B) P two foot pro
s: the proxi orption and microvilli (F mbrane chan bular lumen h border [13] oporous filte Possible mo ocesses [9]. imal convol d for some s Figure 1-4) nnels that n into the ce . er of the pod ode of inter luted tubule secretion. Th , which pro are respon ell. docyte slit rdigitating e and the he apical ovides an sible for
Figure reabsor tubule. unmask parenth primari glucose luminal Proxim salt an Under glucos wherea localiz respect cell us 1-5. Glucos rbed via the
A significan ked by SGL heses), on th ily mediated e transport a l K+ channels mal tubule is nd urea as w euglycemi e transport as the rest i zed in the br tively. The ses ATP to se transport Na+-glucose nt capacity of LT2 inhibitio he basis of d by SGLT2 across the b s serve to sta s responsibl well as secre c condition ters2 (SGLT is absorbed rush border Na+/K+-AT move thre in the kidn cotransporte f SGLT1 to r on (∼40% of the assumpt and SGLT1 basolateral m abilize the me e for absorp etion of amm ns, ~97% o T2) primar d via SGLT membrane TPase pump e Na+ outw ney. Under n er SGLT2 pr reabsorb gluc f filtered glu tion that api 1. The gluco membrane. N embrane pote ption of 100 monium, hy f filtered g rily in the 1 in the lat of the early p on the bas ward into th normoglycem rimarily in th cose in later s ucose under ical tubular ose transport Na+-glucose ential [14]. 0% of glucos ydrogen ions glucose is r early segm te segments y and later s solateral me he blood, cr mia, ∼97% o he early segm segments of normoglyce glucose upt ers GLUT2 cotransport se and amin s and creatin reabsorbed v ments of th s [15]. SGL sections of t embrane of reating a lo of filtered g ments of the the proximal emia; see nu take in the k and GLUT1 is electroge no acids, mo nine into th via sodium he proximal LT2 and SG the proxima the proxim ow intracell glucose is proximal l tubule is umbers in kidney is 1 mediate enic, and ost water, he lumen. m-coupled l tubule, GLT1 are al tubule, al tubule lular Na+
concentration. The electrochemical gradient thus created provides the driving force for ongoing transport of Na+ into the cell across the apical membrane, allowing for glucose to be concurrently cotransported by SGLTs. The specific facilitative glucose transporter, GLUT, on the basolateral membrane then transports the glucose into the interstitium [16] (Figure 1-5). The proximal tubule can only reabsorb a limited amount of glucose. Under normal conditions, the proximal tubule reabsorbs approximately 180 g of glucose from the glomerular filtrate each day. When the blood glucose level exceeds renal threshold of glucose (160–180 mg/dl), the proximal tubule becomes overloaded and begins to excrete glucose in the urine. This condition is termed glycosuria [17].
Sodium is freely filtered at the glomerulus. In the proximal convoluted tubule, 50% of the filtered sodium is reabsorbed. Although in the apical membrane there are 20 different sodium transporters, most of which couple to “substrates” (such as amino acids and carbohydrates), collectively they mediate only 10% of in sodium reabsorption the proximal tubule. The sodium-hydrogen exchanger, NHE3, mediates the majority of Na+ reabsorption [18] (Figure 1-6B).
1.1.2.4 Other components of a nephron (a) Henle’s loop
Named after its discoverer, F. G. J. Henle, the loop of Henle's main function is to establish an osmotic gradient in the medulla of the kidney for water reabsorption. The loop of Henle has three distinct regions: the thin descending limb, the thin ascending limb and the thick ascending limb (TAL). In the TAL, almost all sodium transport results directly or indirectly from Na+-K+-2Cl- cotransporter (NKCC2) and ~20% of the filtered load is reabsorbed. The
loop o tubule Figure mecha loop of (b) Dis The di convol f Henle as fluid passes 1-6. A: p anisms of so f Henle (C), stal tubules stal tubule i luted tubule a whole rea s through H ercentage s odium reabso , the distal c is lined with e. Sodium absorbs 30– Henle’s loop, sodium reab orption are convoluted t h simple cub reabsorptio –40% of the , it becomes bsorption o shown in th tubule (D), boidal cells on in the d e filtered so s hypo-osmo
over the len he proximal and the coll
that are sho istal tubule dium [18] ( otic. ngth of the tubule (B), lecting duct orter than th e is mediate (Figure 1-6C nephron. P , the thick a (E). hose of the p ed by the C). After Principal scending proximal
thiazide-sensitiv also, to collect Figure (c) Jux The JG glomer filtratio mesang muscle decrea ve NaCl cot o a lesser e ting duct con
1-7. The ju xtaglomerula G apparatus rular affere on rate of th gial cells ( e cells of g ase in the s transporter ( extent, by s nnects the n uxtaglomeru ar (JG) appa s is a specia ent arteriole he glomerulu (Figure 1-7) glomerular a sodium chlo (NCC) (Fig sodium-hydr nephrons to ular apparatu aratus alized struc e and its m us. It consis ). JG cells, arterioles a oride conce gure 1-6D), w rogen exch the ureter. us [20] cture formed main functio sts of JG cel , also calle and can sec entration in which is reg ange (NHE d by the di on is to reg lls, macula d ed Granular rete renin. the distal gulated by a E2). After th istal convol gulate bloo densa cells r cells, are The macul tubule and aldosterone he distal tub uted tubule od pressure and extraglo specialized la densa sen causes JG [19], and bule, the e and the and the omerular d smooth nses any G cells to
release the aff filtratio cells lo 1.2 Pat In the causes cause. turning fibrosi appear Figure cortex, e renin. In r ferent arteri on rate. Ext ocated near thological c early stages . However, The cortex g atrophic. s and thicke rance of "thy 1-8. The m black arrow response to iole, reduci traglomerula the macula changes in k s of kidney the patholo is fibrotic, There are ened arterie yroidization microscopic a indicates art increased s ng blood fl ar mesangia densa, but t kidney disea disease, his ogical altera with most g scattered ch es. Tubular l n" (Figure 1-appearance o tery, and blac
sodium, the flow to the al cells, also their functio ases stological ch ations of kid glomeruli b hronic infla lumens are -8). of end-stage ck arrow hea e macula de glomerulus o called Lac on remains u hanges can dneys at end becoming sc ammatory c dilated and renal disea ad indicates g ensa cells tr s and thus cis Cells, ar unclear. vary becaus d-stage are s clerotic and cell infiltrat filled with ase (ESRD). glomeruli. [21 rigger contra also the glo re flat and e se of many similar rega the affiliate es, tubuloin pink cast, g Red arrow 1] action of omerular elongated different ardless of ed tubule nterstitial giving an indicates
The ki or less blurred Figure 1.3 Ch 1.3.1 C CKD i the uri albumi of kidn three m kidney kidney ESRD work, idneys in ES s scattered, d boundary 1-9. A: Norm hronic kidne CKD and GF is defined a ne or protei inuria; other ney function months or m y damages ys function a , wherein t such as rem SRD are usu shallow cor between the mal kidney; B ey diseases ( FR as the presen inuria, or, m r blood or u n (as eviden more [22]. C are, or the at below 15 there is tota move waste o ually small, rtical scars. e cortex and B: Kidneys in (CKD) nce of kidn more specific urine marker nced by redu CKD can be level of d percent of t al or near-to or excess flu , firm, and p Cross-secti d medulla. (F n ESRD [13] ney damage cally, elevat rs; or pathol uced glomer divided into decrease in their norma otal loss of uid from the
pale and the ion of the k Figure 1-9) (most com ted albumin logical abno rular filtratio o five stage kidney fun l capacity, s f kidney fun e blood. Wh e surface is kidney revea [21]. mmonly evid n: creatinine ormalities), on rate or G s, dependin nction [23] stage 5 CKD nction, they hen CKD de granular w als a thin co denced by p e ratio in the or a decrea GFR), for a p ng on how se (Table 1-1 D, also refer y cannot ef evelops into with more ortex and protein in e urine or ased level period of evere the ). When rred to as ffectively ESRD,
Table 1 Table 1 T 20- 30- 40- 50- 60-70 1-1. The 5 sta 1-2. Average TABLE : AVER AGE (Years) -29 -39 -49 -59 -69 0+ ages of chron estimated G RAGE MEASUR nic kidney di GFR by age [2 RED GFR BY A AVERAGE M sease (CKD) 24]. AGE IN PEOPL MEASURED G ) [23] LE WITHOUT GFR (mL/min/1. 116 107 99 93 85 75 CKD2 73 m2)
dialysi with ag when e decade 1.3.2 In Inciden a given popula (point Figure Total i patient cases p 2010, t is or a kidne ge, even in evaluating k e in the gene ncidence, pr nce is defin n period of ation at a sp prevalence) 1-10. Causes incident dia ts received a per million to 348 [25] ey transplan people with kidney func eral populat revalence an ed as the nu f time. Prev pecific perio ). s of ESRD [1 alysis cases a pre-emptiv population, . As of Dec nt is necessa hout kidney ction. Table tion [24]. nd causes o umber of new alence of C od of time ( 13] in USA ros ve transplan , which has cember 31, ary to surviv y disease, it e 1-2 shows f ESRD wly-diagno CKD is the (period prev se 0.27 perc nt as their fir been relati 2010, preva ve. However is necessary s the averag sed patients number of valence) or cent in 2010 rst ESRD m vely steady alent popula r, since GFR y to take thi ge values of s in a specif CKD cases at a particu 0, to 114,08 modality. Th y since 2000 ation includ R declines g is into cons f estimated fic populatio s existing in ular momen 83, while on he rate of ne 0, fell 2.0 p ded 383,992 gradually ideration GFR by on during n a given nt in time nly 2,863 w ESRD ercent in 2 patients
on hemodialysis and 29,733 on peritoneal dialysis, as well as 179,361 with a kidney transplant; the total treated ESRD population thus rose to 593,086 [25].
Diabetes has become the most common single cause of end-stage renal disease (ESRD) in the U.S.A, accounting for ~44% of new cases of treated ESRD in 2011. The second most common cause is high blood pressure or hypertension [26] (Figure 1-10).
1.4 Diabetes Mellitus (DM)
1.4.1 Prevalence and cost of diabetes
Diabetes mellitus is a group of metabolic diseases characterized by hyperglycemia resulting from defects in insulin secretion, insulin action, or both. The chronic hyperglycemia of diabetes is associated with long-term damage, dysfunction, and failure of a variety of organs, especially the kidneys, nerves, eyes, heart, and blood vessels [27]. The vast majority of cases of diabetes fall into two broad etiopathogenetic categories: type 1 diabetes (T1D) and type 2 diabetes (T2D).
T1D is characterized by the destruction of the pancreatic beta cells, resulting in absolute insulin deficiency. This is usually due to autoimmune-mediated destruction of the beta cells (type 1A). Islet cell antibodies (ICA) or other islet autoantibodies (such as antibodies to GAD65, insulin, IA-2) can be found in the serum [27]. However, some patients have no evidence of autoimmunity and have no other known cause for beta-cell destruction (type 1B). T2D is by far the most common type of diabetes in adults and accounts for ~90–95% of those with diabetes. The patients have insulin resistance and usually have relative (rather than absolute) insulin deficiency. Most of them are obese, and obesity itself causes some degree of
insulin increas Figure SEA: S Americ An est from th million Accord States— have d with di n resistance. sed percenta 1-11. Globa South-East A ca and Caribb timated 382 he Internati n by 2035 ding to Am —8.3% of t diabetes. Fro iabetes, brin Even patie age of body al Prevalence Asia, SACA bean, EUR: E million peo onal Diabet (Figure 1-1 merican Dia the populati om 2010 to nging the tot
ents who are fat distribu e of DM [28 A: South and Europe. ople worldw tes Federati 11), when o abetes Socie ion—have d o 2020, anot tal to appro e not obese uted predom 8]. AFR: Af d Central A wide have d on (IDF). T one in ever ety, 25.8 m diabetes [29 ther 1.2 mi ximately 3.7 by tradition minantly in th frica, MENA America, WP diabetes in 2 The IDF exp ry 10 peop million child 9]. In Cana llion people 7 million [3 nal weight c he abdomina A: Middle Ea P: Western P 2013, accord pects that nu ple will hav dren and ad ada, more th e are expec 30]. criteria may al region [2
ast and Nort Pacific, NA ding to a ne umber to ris ve the disea dults in the han 3 millio ted to be d y have an 7]. th Africa, AC: North ew report se to 592 ase [28]. e United on people diagnosed
The gl and U person in the diabete dollars disease of diab Figure 1.4.2 P Diabet macrov obal health S$ 490 bill n are anticip United Sta es is expect s), which is e is expecte betes now ac 1-12. Cost o Pathogenesis tes is charac vascular pa expenditure lion in 2030 pated to be s ates in 201 ted to be ab an increase ed to rise by ccounts for f Diabetes in s of diabetic cterized by c athologies. e on diabete 0. Globally spent on dia 2 were $24 bout $12.2 e of $5.9 bill y another $4 about 3.5% n Canada [32 c complicati chronic hyp The microv es is expecte , 12% of th abetes in 20 45 billion [ billion in 2 lion or near 4.7 billion b % of public h ] ions erglycemia vascular co ed to total a he health ex 010 [31]. To [29]. In Ca 2010 (measu rly double it by 2020 [30 healthcare sp
and the dev omplications at least US$ xpenditures otal costs of anada the e ured in infl ts level in 2 ] (Figure 1-pending in C velopment o s are due t $ 376 billion and US$ 1 f diagnosed economic bu lation-adjust 000. The co -12). The di Canada. of microvasc to damage n in 2010 1330 per diabetes urden of ted 2005 ost of the irect cost cular and to small
blood vessels and include nephropathy, retinopathy and neuropathy. The macrovascular complications affect larger blood vessels, including cardiovascular diseases, such as heart attacks and strokes. Many hypotheses have been proposed to explain underlying mechanisms. A large body of evidence indicates that oxidative stress is the common denominator link for the major pathways involved in the development and progression of diabetic micro- as well as macrovascular complications of diabetes [33].
1.4.3 Reactive Oxygen Species (ROS) and oxidative stress
ROS are composed of a series of oxygen intermediates, including the free radical superoxide anion (O2−), the highly reactive hydroxyl free radical (HO·), the nonradical hydrogen peroxide (H2O2), peroxynitrite (ONOO−), hypochlorous acid (HOCl) and lipid radicals. Excessive amounts of ROS, overwhelming the detoxification capacity of various endogenous anti-oxidative defensive mechanisms, oxidize various tissue biomolecules, such as DNA, protein, lipids and carbohydrates, and this disastrous state has been commonly referred to as an oxidative stress [33]. In mammalian cells, potential sources of ROS include mitochondrial respiratory chain, NADH/NADPH oxidases, xanthine oxidase, NO synthase and other certain hemoproteins.
1.4.3.1 Mitochondrial origin of ROS
Glucose generates ATP, NADH and FADH2 via glycolysis and oxidative phosphorylation. The electrons from NADH or FADH2 are transferred to molecular oxygen (O2) in the mitochondrial respiratory chains complex I – IV to generate ATP. During this process, most of the O2 is reduced to water under normal physiological states, and less than 1% of O2 is converted to superoxide anion, O2−. However, under mitochondrial dysfunctional or
hyperg comple increas [34]. Figure 1.4.3.2 NAD(P reducti origina is prod associa glycemic sta ex I and ano se in the re 1-13. Mitoc 2 NADPH o P)H oxidase ion of O2 ally found in duced to ki ated p22phox ates there is other at the duction of hondrial RO oxidase e is a multi-by using e n neutrophi ill the inva
x and p91pho s an excessi interface be O2 to O2− a S production -subunit enz either NAD ls and phag ading micro ox (also term ive leakage etween coen and increase n [34]. zyme that c DPH or NA gocytic cells oorganisms. med as NAD of electron nzyme Q an e in the pro catalyzes the ADH. The p s [35]. In the This enzym DH Oxidase s at two ma nd complex oduction of e generation prototype o ese cells a l me has five e 2 “NOX2” ajor sites, o III. This lea f ROS (Figu n of O2− thr of this enzy arge quantit e units: me ”), cytosolic ne at the ads to an ure 1-13) rough the yme was ty of O2− embrane-c subunit
p47phox subuni NAD(P of O2− Figure The ne oxidas Duox2 x, p67phox, its transloca P)H oxidase [36] (Figur 1-14. Assem ew homolo es. This fa 2 (Figure 1-1 p40phox, an ate to the e multi-subu re 1-14). mbly of the ph gs along w amily has s 15). nd GTPase cytochrom unit comple hagocyte NA with gp91ph seven memb Rac1 or R me complex,
ex, which tra
ADPH oxidase
hox are now bers: Nox1 Rac2. Upo , leading t ansfers elec e NOX2 [37] w designate , Nox2, No n stimulati o the form ctrons to O2 ]. ed the Nox ox3, Nox4, ion, these c mation of a with the ge family of Nox5, Du cytosolic an active eneration NADPH uox1 and
NOX1 differe expres Figure function p22pho NOX2 activati contribu species reconst native N DUOX , NOX2, a entially exp sed in the m 1-15. Activa n, NOX fam ox, NOXO1 requires p22 ion. Althoug ute to activat s dependent, titute systems NOX4-expre X1, and DUOX and NOX4 press NAD mesangial ce ation of NA mily enzymes (or possibly 2phox, p47ph gh not absolu tion. C: NOX and the req s, it is consti essing cells, a X2 are activa have all b DPH oxidas ell, podocyte ADPH oxidas s differ in th p47phox in hox, p67phox utely require X3 requires p quirement of itutively activ activation, po ated by Ca2+ been identif se subunits es, endothel se isoforms. heir mechan some cases) x, and Rac; p ed, p40phox p22phox and Rac is still ve without th ossibly includ and do not a fied within : p47phox lial cells, va Despite thei nism of activ ) and NOXA p47phox phos x also associ NOXO1; th debated. D: he requireme ding Rac, ha appear to requ the kidney , p67phox ascular smoo ir similar stru vation. A: NO A1, and the s
sphorylation iates with th e requiremen NOX4 requ ent for other as been descri uire subunits y [38]. Ren and p22p oth muscle c ructure and e OX1 activity small GTPas is required f his complex nt for NOXA uires p22pho subunits. Ho ibed. E and F s [37]. nal cells phox are cells, enzymatic y requires e Rac. B: for NOX2 and may A1 may be ox, but in owever, in F: NOX5,
fibroblast, thick ascending limb, distal convoluted duct including macula densa cells and cortical collecting ducts; Nox-2 in podocytes, mesangial cell and endothelium; Nox-4 in glomerulus, proximal tubule and distal convoluted tubule; and Nox-3 in fetal kidney [39]. Of the renal Noxes, Nox4 is most abundantly expressed and hence was originally termed Renox [40, 41]. NOX4 is a p22phox-dependent enzyme, however it does not require cytosolic subunits for its activity [37]. NOX4 requires p22phox, but in reconstitute systems it is constitutively active without the requirement for other subunits. In native NOX4-expressing cells, however, a Rac requirement for activation has been documented [37].
The Nox5 gene is absent from the mouse and rat genomes, making the use of conventional animal models unfeasible. Unlike other Nox family members, Nox5 does not require membrane-bound or cytosolic components, such as p22phox or p47phox, for its activity, but is tightly regulated by changes in intracellular calcium levels [42]. Interestingly, Holterman and colleague [42] recently generated transgenic mice expressing human Nox5 in a podocyte-specific manner (Nox5pod+). Nox5pod+ mice exhibited early onset albuminuria, podocyte foot process effacement, GBM thickening, interstitial fibrosis, and elevated systolic blood pressure (BP). Subjecting these mice to STZ-induced diabetes further exacerbated these changes. Furthermore, kidney biopsies from diabetic patients showed increased NOX5 expression compared with nondiabetic subjects.
1.4.3.3 SOD, Catalase, GPX and Nrf2 (a) SOD
Superoxide dismutase (SOD) is the main defense against O2•−, catalyzing its dismutation to
the cytoplasm, SOD2 (MnSOD) is in the mitochondria, and SOD3(extracellular SOD;EC-SOD) is extracellular [43]. Mitochondria are both a major source of ROS production from respiratory chains as well as a major target of ROS-induced cellular injury. Thus, mitochondrial Mn-SOD is thought to play an important role in cellular defense against oxidative damage by ROS [44]. Complete loss of the gene encoding MnSOD results in a lethal phenotype with some live births [45, 46], but heterozygous knockout mice have a normal lifespan [47]. Cu, Zn SOD is the major isoform of SOD in the renal cortex and glomeruli, accounting for more than 90% of total SOD activity in these tissues [48]. Deficiency of SOD1 accelerated renal injury in STZ-induced diabetic mice , while treatment of these mice with the SOD mimetic tempol for 4 weeks suppressed albuminuria, glomerular transforming growth factor β, collagen α1(IV), nitrotyrosine, and glomerular superoxide [48].
(b) Catalase (Cat)
Catalases are enzymes that catalyse the conversion of H2O2 into water and oxygen according to the equation: 2H2O2 → 2H2O + O2. They use either an iron or manganese cofactor with a high catalytic rate. Cat is encoded by a single gene, which is highly conserved among species. It is expressed in all mammalian tissues and can be found in the liver, kidneys and erythrocyte with high concentration [49]. High Cat activity is detected in peroxisomes. Cat is also found in the cytosol of erythrocytes [50]. Cat is a tetramer of four polypeptide chains, each over 500 amino acids long. Cat contains four porphyrin heme (iron) groups that allow the enzyme to react with the hydrogen peroxide[51]. In the kidney, Cat is localized predominantly in the cytoplasm of proximal tubules of the superficial cortex. Cat was not detected in the glomeruli, loop of Henle, distal tubules, and collecting ducts [52]. Cat deficiency in STZ-induced diabetic
mice increased mitochondrial ROS and fibronectin expression in response to free fatty acids, which were effectively normalized by catalase overexpression or N-acetylcysteine [53].
(c) Glutathione peroxidases (GPxs)
The “classical” glutathione peroxidase, now called GPx1, was first discovered as an erythrocyte enzyme that specifically reduces H2O2by GSH, but later shown to reduce a broad scope of organic hydroperoxides [54]. There are eight distinct GPxs in mammals, most of which are selenoproteins. Only GPx1, 3 and 4 have been functionally characterized to some extent [49]. Low levels of both GPx1 and GPx3 are associated with the development of vascular disease.The patients of CVD with low erythrocyte GPx1 activities had increased recurrent events [55]. Lack of functional GPx1 accelerates diabetes-associated atherosclerosis via upregulation of proinflammatory and profibrotic pathways in apolipoprotein E (ApoE) knockout mice [56], whereas ebselen, a GPx mimetic, could attenuate diabetic nephropathy and diabetes-associated atherosclerosis in ApoE/GPx1 double knockout mice [57].
(d) Nuclear factor erythroid 2-related factor (Nrf2)
The genes encoding SOD, Cat and GPx contain antioxidant response elements (AREs) in their regulatory regions. Nrf2 is the principal transcription factor that binds to the ARE. Actin-tethered Keap1 is a cytosolic repressor that binds to Nrf2, keeps it in the cytoplasm, and promotes its proteasomal degradation [58]. Nrf2 activators modify specific cysteine residues of Keap1 and cause conformational changes that render Keap1 unable to repress Nrf2. Once released Nrf2 migrates into the cell nucleus, binds to AREs and activates the transcription of antioxidant genes [59]. Bardoxolone methyl is among the first orally available antioxidant
Nrf2 activators [60]. Bardoxolone methyl was first advanced into the clinic to assess its anticancer properties. In phase 1 trials that included cancer patients, bardoxolone methyl decreased serum creatinine levels, with a corresponding improvement in estimated glomerular
filtration rate (eGFR) [61]. Phase 2 trials, including persons with T2D and stage 3b or 4
CKD, have shown that bardoxolone methyl can reduce the serum creatinine concentration for up to 52 weeks [62]. However phase 3 trials showed that among patients with T2D and stage 4 CKD, bardoxolone methyl did not reduce the risk of ESRD or death from cardiovascular causes. Moreover, significantly increased risks of heart failure and of the composite cardiovascular outcome prompted termination of the trial [62].
1.5 Diabetic Nephropathy (DN)
The earliest clinical evidence of nephropathy is the appearance of low but abnormal levels (≥30 mg/day or 20 µg/min) of albumin in the urine, referred to as microalbuminuria, and patients with microalbuminuria are referred to as having incipient nephropathy. Without specific interventions, ~80% of subjects with T1D who develop sustained microalbuminuria will progress to overt nephropathy or clinical albuminuria (≥300 mg/24 h or ≥200 µg/min) [63]. Recent findings showed that there existed another marker of early DN, early renal function decline (ERFD), i.e. the presence of a progressive loss of GFR over time even if it remains in the normal range [64]. There are three major histologic changes in the glomeruli in diabetic nephropathy: mesangial expansion; glomerular basement membrane thickening; and glomerular sclerosis [65]. An abnormality in late stage is Kimmelstiel-Wilson lesion and has been considered as a hallmark of DN (Figure 1-17). This lesion has a nodular appearance, with an acellular, hyaline matrix core, surrounded peripherally by sparse, crescent-shaped
mesang tubular fibrosi hyalini endoth Figure patient afferent Figure Right: efferent atrophy gial nuclei r hypertrop s and tubul ization of t helia (Figure 1-16. Left: N with diffus t (double thin 1-17. Left: Renal biop t (left thin a y (long thick [66]. Path hy followed ar atrophy ( the afferen e 1-16). Normal kidn e (long thic n arrows) and Glomerulu psy from a T arrow) glome arrow). [67] hological ch d by thicke (Figure 1-17 nt arterioles
ney (PAS sta ck arrow) an d efferent (si us from a T1 T2DM patien erular arterio hanges in th ening of the 7). Vascular and interl ining). Right nd nodular ( ingle thin arr
1DM patient nt with hyal oles, interstit he tubuloin e tubular b r changes ty lobular arte t: Glomerulu (short thick row) arteriola t with nodul linosis of th tial expansio nterstitial co asement me ypically inc eries with e us from a typ arrow) mesa ar hyalinosis lar (Kimmel he afferent (r on (short thic ompartment embrane, in clude thicke effacement pe 1 diabetic angial expan [67] lstiel-Wilson right thin ar ck arrow) an t include nterstitial ning and of their c (T1DM) nsion and n) lesions. rrow) and nd tubular
After 20 years of diabetes duration, around 30% of T1D patients develop DN. Over 5% of newly diagnosed T2D patients already have renal dysfunction. Another 25-40% of T2D patients will develop DN after 25 years of diabetes; they will also manifest a high tendency to progress to ESRD.
1.5.1 Pathogenesis of DN
Although the pathogenesis of DN is not completely understood, several factors are closely relevant to DN. Briefly, they are: (1) Hypertension and hemodynamic factors; (2) augmented ROS formation; (3) enhanced activity of the aldose reductase pathway; (4) increased formation of AGEs; (5) PKC activation; (6) Hexosamine pathway flux; (7) heightened activity of growth factors, TGF-β1; (8) activation of cytokines (e.g. angiotensin II or Ang II). The relationship of these major factors to the development of DN is discussed below.
1.5.1.1 Hypertension and DN
Diabetic patients who progressed to albuminuria had higher baseline arterial pressures than the patients who stayed normoalbuminuria [68]. Patients with T2D and hypertension have a sevenfold greater risk of progression to ESRD compared to patients with T2D and normal blood pressures [69].
Clinical studies have established that tight control of blood pressure can slow kidney disease progression in both T1D and T2D [70, 71]. Studies in recent years have focused on the primary prevention of microalbuminuria [72]. Tight achievement of recommended blood pressure goals may also prevent or delay the new onset of microalbuminuria and in doing so,
halt the development of later stages of overt nephropathy. As a result, new preventative strategies for hypertension management continue to be explored [73].
At diagnosis of T2D, hypertension is already present in 50% of patients. Sixty percent of hypertensive patients with T2D develop diabetic kidney disease. In T1D patients with normoalbuminuria, the prevalence of hypertension varied between that of the general population (4%) [74] and 19%, as reported in a cross-sectional Danish study [75]. In T1D, hypertension typically occurs in those with microalbuminuria or overt kidney disease. A large number of epidemiologic studies and clinical trials have established that high blood pressure (particularly systolic) is a risk factor for accelerated progression in proteinuric conditions such as diabetic CKD.
1.5.1.2 Oxidative stress in DN
The cell susceptibility to glucose-induced toxicity is determined by its expression of glucose uptake mechanisms and by the ability of these cells to downregulate glucose uptake in the setting of hyperglycemia [76]. Enhanced glucose uptake has been identified in many of the cell populations within the diabetic kidney, including glomerular epithelial cells, mesangial cells, and proximal tubular cells [77]. As mentioned before, more ROS have been generated by mitochondria.
Another important source of ROS is NADPH oxidase. Nox4 is the most abundant NOX in the kidney. The levels of both NOX4 and p22phox mRNA were increased in the kidney of streptozotocin (STZ)-induced diabetic rats as compared with control rats. Immunostaining analysis revealed that the expression levels of NOX4 and p22phox were clearly increased in both distal tubular cells and glomeruli from diabetic rats [78]. Nox4 protein expression was
increased in diabetic kidney cortex compared with non-diabetic controls and antisense oligonucleotides for Nox4 downregulated NOX4, reduced whole kidney and glomerular hypertrophy, and attenuated fibronectin expression [79]. Although Nox2 levels are not affected in the renal cortex from T2D db/db mice [80], Nox2 is increased in the cortex from T1D rats [79]. However, lack of Nox2 does not protect against diabetic kidney disease in T1D and this may be due to upregulation of renal Nox4 [81]. Data from Nox4 knockout mice are contradictory. In models of transient or permanent cerebral ischemia, Nox4-deficient mice and mice treated with the Nox4 inhibitor VAS2870 were protected from oxidative stress, neuronal apoptosis, and blood-brain barrier leakage [82]. On the contrary, Schroder et al [83] showed that in global Nox4 deficient mice, ischemia-induced angiogenesis is attenuated and that in tamoxifen-inducible Nox4 deficient mice, Ang II–mediated aortic inflammation, vascular hypertrophy, and endothelial dysfunction are exaggerated. Thus further studies are needed to unriddle the Nox4 paradox.
1.5.1.3 Aldose reductase and DN
In the setting of hyperglycemia there is increased shuttling of glucose metabolism into the sorbitol/polyol pathway [84]. The glucose is oxidized into sorbitol by the enzyme aldose reductase, a reaction that requires NAD(P)H. Sorbitol is subsequently reduced to fructose by sorbitol dehydrogenase, during which NADH is generated (Figure 1-18). Since NAD(P)H is required for the glutathione reductase reaction in which glutathione disulfide is reduced to glutathione, the consumption of NAD(P)H will finally reduce the levels of cellular glutathione and ultimately also the antioxidant activity. Furthermore, the newly generated NADH is utilized by the respiratory chain reaction resulting in excess generation of superoxide anion
[85]. I reducta Figure 1.5.1.4 AGEs ketone groups glycati develo mediat compo traffick n diabetic r ase inhibitor 1-18. Aldose 4 Advanced are norma e) groups of s in a varie ion product opment of t ted interact onents of ex king and b rats there is r, Tolrestat e reductase an Glycation E lly formed f reducing ty of protei ts via the the DN vi tions [88]. xtracellular breakdown s clear evide [86]. nd the polyo End product nonenzyma sugars, such ins, lipids, Maillard r ia two gen The form matrix (EC [89]. Glyc ence of red l pathway [8 ts (AGEs) a atically by h as glucos and nucleic reaction (Fi neral mecha mer mechan CM) molec cation of c duced protei 7] and DN the interac se, and with c acids, wh igure 1-19) anisms, rece nism includ cules and a collagens l inuria on tre ction of car h lysine and hich results ). AGEs a eptor-depen des modifi alterations o eads to str eatment wit rbonyl (alde d N-termina in the form are involved ndent and r ications of of protein ructural alt th aldose ehyde or al amino mation of d in the receptor-f various function, terations,
includi stiffne links m mesang resultin phenot Figure mechan Althou transfe ing changes ss, reduced may act as gial expans ng in chang type [92]. 1-19. The nisms, leads t ugh there a erase compl s in surface thermal sta a sticky we sion. Cell-m ges in cellula formation o to DN [93]. are a num lex protein e charge an ability, and eb nonspeci matrix inter ar adhesion of advanced mber of AG 48 (AGE-R nd packing resistance t ifically trap actions may [91], altere glycation e GE recepto R1) and 80K density, and to proteolyti pping macro y also be d ed cell grow end product ors, includi K-H protein d results in ic digestion omolecules disrupted b wth and loss s (AGEs), t ing lactofer n (AGE-R2 n increased n [90]. Matr and contrib by matrix g of the epith through a v rrin, oligos ), galectin-3 collagen rix cross-buting to glycation, helial cell variety of saccharyl 3
(AGE-R3), th identif [94, 95 endoth 1.5.1.5 PKC, a α, -β1, glucos Figure by hyp he most we fied membe 5] and expre helia, monoc 5 Protein Kin a family of , -β2, -δ and e, as well as 1-20. Phys perglycemia ell studied in er of the im essed on the cytes, lymph nase C (PK serine/threo d -ε, has bee s in the glom siological ef a [100]. n the devel mmunoglobu e surface of hocytes and C) and DN onine kinase en documen meruli of dia ffects and c lopment of ulin superfa a variety of d neuronal ce es that consi nted to be ac abetic rats cellular mec DN is the R amily of cel f cell types, ells [95]. ists of at lea ctivated in m [96-99] (Fig chanisms of RAGE. The ll-surface a including s ast 15 isofor mesangial c gure 1-20). f DAG–PKC e RAGE is ssociated m smooth mus rms, includi ells exposed C activation a newly molecules scle cells, ng PKC-d to high n induced
In mesangial cells cultured in high concentration of glucose, enhanced fibronectin accumulation is mediated by a sustained activation of PKC and prevented by calphostin C (a potent inhibitor of PKC) [96, 97]. Some studies have demonstrated enhanced PKC activity in the glomeruli of STZ-induced diabetic rats [101, 102]. Furthermore, the PKCα isoform has been found to be significantly increased in the glomeruli, interstitial capillaries and endothelial cells of larger arteries in diabetic rats [98].
The implication of PKC causing elevated production of ECM and TGF-β is further supported by several reports showing that LY333531 (PKCα-selective inhibitor) prevents hyperglycemia-increased ECM production and TGF-β expression in mesangial cells [99]. Menne et al reported that protein kinase C alpha (PKCα)-deficient mice are resistant to the development of albuminuria under diabetic conditions [103]. They also found that PKCα is involved in reduction of nephrin surface expression and in PKCα-/- mice, hyperglycemia-induced downregulation of nephrin was prevented [104].
1.5.1.6 Hexosamine pathway flux and DN
Hexosamine pathway is required for proteoglycan synthesis and the formation of O-linked glycoprotein and provides the substrate, UDP-N-acetylglucosamine. When intracellular glucose is high, it enters the glycolytic pathway. The intermediate fructose-6-phosphate (Fruc-6-P) is converted to glucosamine-6-phosphate by the enzyme glutamine: fructose-6-phosphate amidotransferase (GFAT) (Figure 1-21). Glucosamine-6-phosphate is then converted to UDP-N-Acetylglucosamine. Specific O-GlcNAc transferases use this for post-translational modification of specific serine and threonine residues on cytoplasmic and nuclear proteins by O-linked N-Acetylglucosamine. O-GlcNAcylation of the transcription factor Sp1 augments
the syn In add dynam (eNOS activat hyperg which Figure A unif Specifi hexosa culture nthesis of fa dition to tr mically mod S) activity in tion site of glycaemia m collectively 1-21. The he fied mechan fic inhibitor amine pathw e or animal actors, such ranscription ified by O-n arterial eO-n f eNOS pr may result i y contribute exosamine pa nism rs of aldo way flux e l models. M h as TGF-β1 n factors, m -linked GlcN ndothelial c otein [105] in many ch to the patho athway [87] se reductas each amelio Moreover, al 1 and plasm many other NAc. For e cells can be ]. Thus, ac hanges in bo ogenesis of se activity, orate variou ll the four minogen acti r cytoplasm example, en inhibited b ctivation of oth gene ex diabetic com PKC acti us diabetes-abnormaliti ivator inhibi mic and nu ndothelial n by O-GlcNA f the hexos xpression an mplications ivation, AG -induced ab ies are rapi
itor-1 (PAI-uclear prot nitric oxide Acylation at samine path nd protein f . GE formati bnormalities idly correct - 1) [87]. teins are synthase t the Akt hway by function, ion, and s in cell ted when
euglyc mecha overpr the ac (GAPD interm pathwa ribose, the nu induce (Figure Figure cellular cemia is res anisms desc roduction of ctivity of t DH) [87]. mediates that ays describe , which is m cleus in an es DNA stra e 1-22. Schem r damage [10 tored. Thus cribed abov f superoxide the key gl When GA t are upstrea ed above. R made by pol inactive fo and breaks, P matic showi 05] s, it has bee ve stem fr e by the mi lycolytic e APDH activ am of GAP ROS modif ly (ADP-rib orm, awaitin PARP is act ing elements en demonstr from a sin itochondrial enzyme gly vity is inh PDH increas fies the GA bose) polym ng DNA da tivated, ther s of the uni rated that al gle hyperg l electron-tr yceraldehyde hibited, the se. This the ADPH activi merase (PAR amage to ac reby leading ifying mech ll of the 4 d glycemia-ind ransport cha e 3-phosph e level of en increases ity through RP). Normal ctivate it. W g to the four hanism of hy different pa duced proc ain, which d hate dehyd all the g s the flux in polymers o lly, PARP r When increas r pathway fl yperglycemia athogenic cess, i.e. decreases drogenase glycolytic nto the 4 of ADP-resides in sed ROS lux [105] 1-20). a-induced


![Table 1 Table 1 T 20- 30- 40- 50- 60-70 1-1. The 5 sta1-2. Average TABLE : AVERAGE (Years)-29-39-49-59-690+ ages of chronestimated GRAGE MEASUR nic kidney di GFR by age [2RED GFR BY A AVERAGE M sease (CKD)24]](https://thumb-eu.123doks.com/thumbv2/123doknet/2067452.6385/32.892.120.745.223.571/table-average-table-average-chronestimated-measur-kidney-average.webp)

![Table 1-4. Selected mouse models of diabetes studied for DN [229]](https://thumb-eu.123doks.com/thumbv2/123doknet/2067452.6385/79.892.117.788.270.1062/table-selected-mouse-models-diabetes-studied-dn.webp)