1.1.7 .02
Selection
and
ldentification
of Lumped
Modets of
the
Arterial
Vasculature
Using
Multiple
Regression and
Backward Blimination in
the
Time
Domain.
Thierry
Pochet, Paul Gerard, Bernard Lambermont,
Olivier Detry, Vincent
D'Orio,
Jean-Olivier Defraigne, Anny Fossion,
andRaymond
Limet
Hemodynamics Research Centre
(Hemoliege),
University of
Liege
6,
quai Banning,
8-4000
Liege,
Belgium
Abstract: Although electrical networks are
usedwith
increasing insistence
in
both clinical and
experimental investigationsto
describe hemodynamic properties of
the arterial
vasculafure,the rationale
for
the
selectionof a particular model is, however,
rarely
discussed.In
most
cases
the
mathematical procedure
is
time
consuming,
highly
specific and thereby,
reproduciblewith
great difficulties. The aim of the
presentpaper
isto
provide
a rapid
method
of
analysiswhich
supportsthe
identification
of
parameters together
with
thechoice
of
the
best
analog model.
Five
models with
gradual complexity and described
by a
secondorder
differential
equation
are
considered. Selection
andidentification
is
performed
through
il
multiple
regression
in
thetime
domain. INTRODUCTIONSimple electrical networks are becoming
of
increasing interest to provide insights into the hemodynamic behaviorof
the
pulmonary
tU
and
the
systemic
t2l
arterial vasculature aswell
as of organ networks[3].
Furthermore, they are also usedto quantiff
the coupling between nativeor
prosthetic
ventricles
and
their
respective vascular output.However,
to
the
extent
that
collected hemodynamic data may be analyzed owingto
the useof
lumped models, the capacityof
interpretationof their
parameters is relatedto the
successto
overcometwo main
problems. Thefirst
one
is
relatedto the
choiceof
the best and most suitable analog model. The second one is the capability to computethe
values
that
characterizethe
network
components. Unfortunatelythe
rationalethat
subtendsthe
choiceof
a particular model remains often scarce.Thereby,
the main
objectiveof
the present studyis
to provide a consistent time domain method which enables to solve thesetwo
fundamental
problemsby
meansof
a systematic and time sparing procedure which can be easilyrun
using usual and widespread softwares.It
is
presentedusing
hemodynamicdata coming
from the
pulmonary circulation.METHODS
A
large
classincluding
the
most usual
models are describedby
a
secondorder linear differential
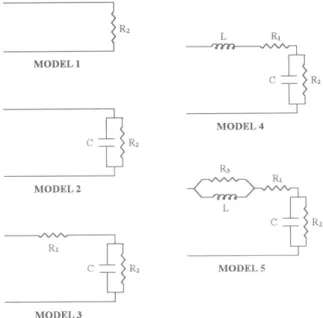
equation.Five
such analog modelsof
increasingcomplexity
have been considered.They are
composedof
resistances&
(i:1,...,3),
a
complianceC
and
an
inertanceL.
Their electrical representation are given on figure 1.)R, I MODEL I
MODEL3
Figure
l.
Electrical representation of the 5 analog models. After integration of their equation, the following general equation is obtained :IQ:
Cr IP + C2 Pr + C: Qr + CaDQr + CsDPr
(1)with
: trq =
[q.at,
Qr:
Q(t) -Q(b)
] DQr:
Q'(t)
- Q'(t0) ;o tp
=
[t.at,
Pr:
P(t) - P(to) ; DPr:
P'(t)
-P'(to)
Q);o
where Q is the flow, P the driving pressure,
Q'
andP'
theirfirst
derivativeswith
respect to timet.
The coefficients Ci(i:1,...,5) are
known
functions
of
the
model
RCL parameters[4].
When successivelysimpliffing
the modelsfrom
model5
to
model
l,
the last term
of
equation(l)
disappears at each step.The
fitting
of
the
models
is
performedthrough
amultiple
regressionof
the
dependent variableIQ
on
thefive
explanatory variablesIP, Pr, Qr, DQr
and DP1' The standard stepwise proceduresof
baclcrvard eliminationof
the explanatory variables
to
be includedin
the regression equation is applied to decide which one of the models is to be chosen [4].The
choice
of
a
model
is
always
the
result
of
a compromise between quality of thefit
and simplicity of theMODEL4
MODEL2
Medical & Biological Engineering & Computing Vol. 34, Supplement 1, Part 1, 1996
300 200
100 30
20
model.
This
stepwizebackward
elimination
procedurestarts
with the
most complex model
and
sequentially remove useless variables.At
each step,the variable
for which the damaging effect on thefit
is the least whenit
is removed, is withdrawed from the model. The process stops when any deletion leadsto
significant deteriorationof
thefit.
Furthermore,any
model
with
estimated regression coefficientsleading
to
spurious
(for
example negative) values of the RCL elements must be rejected.The
procedureis
highlighted
in
this
paper
on
one exampleof
data set comingfrom the
pulmonary arterial vasculafure of apig.
Pressure andflow
were recorded by a pressure catheter (Sentron) locatedin
the pulmonary artery and a perivascular flow probe (Transonic) encircled around the pulmonary artery. The output pressure was taken equal to the observed capillary pressure (7 mmHg). The pressure andflow
signals recordedduring
one beatare given in
frgure 2. The sampling interval was 0.005 s.
0 - 100
0.0 0.2 0.4
0.6 Time (s)0.0 0.2 0.4
0.6 Time (s) DISCUSSIONGrant et
al.
[]
had already discussed the problemof
the
choice among electrical networks
in
the
spectraldomain.
We
proposeanother
stratery
of
fitting
and selectionof
models.In
order to provide atool
that allows the treatmentof
large amountsof
datafiles
in
a standard way, our method satisfies the fourfollowing
requirements:1)
it
is
rapid, nontime
consuming, usinga
non iterative methodin
the time
domain;2)
it
objectively allows the choiceof
a model; 3)it
can be implemented on a spread-sheet software;4)
it
is
easily understandableallowing
aclear discussion among members of a research team.
A
systematic useof
this
processis
usefuland
save.avoiding useless complexity and damaging simplification.
For
example,if
the process stopsat
model4,
it
probably means that the inertial properties cannot be neglected. Buta
process stoppingat
model
3
implies that the
inertial effects,if
present, aretoo
weakto
be
revealedby
the recorded data.Equation
(l)
was
used insteadof
the
second order differential equationto
avoid the often delicate numerical evaluationof
the second order derivatives. The backwardelimination
procedurewas
used insteadof
the
forward selection method because this process could stop too early.CONCLUSION
We
proposea
methodthat allows
simultaneously arapid and systematic choice of a lumped model for the
arte-rial
networks andthe
identificationof the
parametersof
the selected model. The method can easily run on popular spreadsheet
or
statistical softwares. Such a procedure may encourageto
examine more frequently,on
large samplesand
with
repeated measurements,the
evolution
of
the hemodynamic variables in various physiological situations.Acknowledgments: This work was supported
by
grant ARC 94/99-
177 of the Communaute Frangaise de Belgique. REFERENCESUl B.J.
Grant andL.J.
Paradowski, "Characterizationof
pulmonary
arterial
input
impedancewith
lumped parameter models,"Am.
J.
Physiol.,vol.
252
(Heart Circ.Physiol.2l),
pp. H585-H593, 1987 .[2]
D.S. Berger and J.K.J.
Li,
"Concurrent compliance reductionand
increased peripheral resistancein
the manifestation of isolated systolic hypertension," Am. J. Cardiol., vol. 65, pp.67-71, 1990.[3] P.A. Harris., S. Bosan, T.R. Harris, M.H. Laughlin and
K.A.
Overholser, "Parameter identificationin
coronary pressureflow
models:a
graphical
approach," Ann. Biomed. Eng., vol. 22, pp. 622-637, 1994.t4l P. Gerard, Th. Pochet, B. Lambermont, O. Detry, V.
D'Orio,
O. Defraigne, A. Fossion, and R. Limet,"A
time domain method to select lumped models of the arterial vasculature to
identi$
their parameters," to be published.Figure 2. Recorded pressure and flow waves.
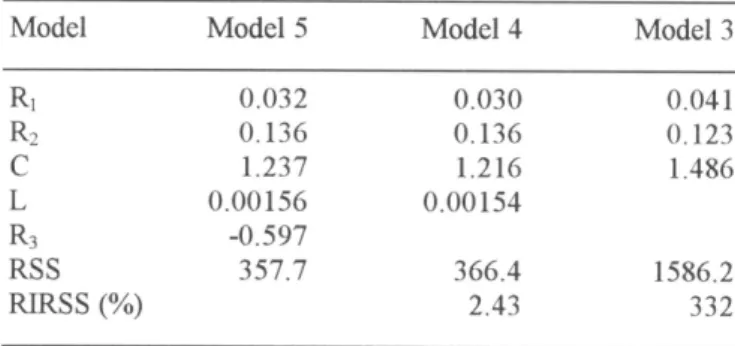
RESULTS
The results of the identification procedure are given
in
Table 1.
The backwardelimination
process startedwith
model 5 leading to a negative value
for
&.
Thus, model 5was rejected and
the
procedure continuedwith
model 4.Fitting
of model 3 ledto
a substantial deteriorationof
thefit
measured by the relative increase of the residual sumof
squares. Therefore,
model
4
was
selectedas
the
most appropriate model among the five models.Table 1. Results of the identification procedure.
Model Model 5 Model 4 Model 3
R1 R, C
L
R3 RSS RrRSS (%) 0.032 0.136 r.237 0.00156 -0.597 357.7 0.030 0.136t.216
0.00154 366.4 2.43 0.041 0.123 1.486 1586.2 332Resistances Rr, Rz and
&
arein
mmHg sml-',
complianceC is
in
ml.mmHg-rand
inertanceL
is
in
mmHg.s2.ml-r. RSS is the residual sumof
squares, RIRSSis
the relative increase of the residual sum of squares.Medical & Biological Engineering & Computing Vol. 34, Supplement 1, part 1, 1996
The 1Oth Nordic-Baltic Conference on Biomedical Engineering, June g-13, 19S0, tampere, Finland Flow (rnVs)
Pressure (rnrnHg)