Comprehensive two-dimensional gas chromatography with isotope
dilution time-of-flight mass spectrometry for the measurement of dioxins
and polychlorinated biphenyls in foodstuffs
Comparison with other methods
q
Jean-Franc¸ois Focant
a,∗, Gauthier Eppe
a, Marie-Louise Scippo
b, Anne-C´ecile Massart
a,
Catherine Pirard
a, Guy Maghuin-Rogister
b, Edwin De Pauw
aaCART Mass Spectrometry Laboratory, Chemistry Department, University of Li`ege,
All´ee de la Chimie 3, B-6c Sart-Tilman, B-4000 Li`ege, Belgium
bCART Laboratory of Analysis of Foodstuffs of Animal Origin, University of Li`ege,
Boulevard de Colonster B-43bis Sart-Tilman, B-4000 Li`ege, Belgium
Available online 11 July 2005
Abstract
A comprehensive two-dimensional gas chromatography time-of-flight mass spectrometry (GC × GC–TOF-MS) experimental setup was tested for the measurement of seven 2,3,7,8-substituted polychlorinated dibenzo-p-dioxins (PCDDs), ten 2,3,7,8-substituted polychlorinated dibenzofurans (PCDFs), four non-ortho-polychlorinated biphenyls (PCBs), eight mono-ortho-PCBs, and six indicator PCBs (Aroclor 1260) in foodstuff samples. A 40 m RTX-500 (0.18 mm I.D., 0.10 mm df) was used as the first dimension (1D) and a 1.5 m BPX-50 (0.10 mm
I.D., 0.10 mm df) as the second dimension (2D). The GC × GC chromatographic separation was completed in 45 min. Quantification was
performed using13C-label isotope dilution (ID). Isotope ratios of the selected quantification ions were checked against theoretical values
prior to peak assignment and quantification. The dynamic working range spanned three orders of magnitude. The lowest detectable amount of 2,3,7,8-TCDD was 0.2 pg. Fish, pork, and milk samples were considered. On a congener basis, the GC × GC–ID-TOF-MS method was compared to the reference GC-ID high resolution mass spectrometry (HRMS) method and to the alternative GC-ID tandem-in-time quadrupole ion storage mass spectrometry (QIST-MS/MS). PCB levels ranged from low picogram (pg) to low nanogram (ng) per gram of sample and data compared very well between the different methods. For all matrices, PCDD/Fs were at a low pg level (0.05–3 pg) on a fresh weight basis. Although congener profiles were accurately described, RSDs of GC × GC–ID-TOF-MS and GC–QIST-MS/MS were much higher than for GC–ID-HRMS, especially for low level pork and milk. On a toxic equivalent (TEQ) basis, all methods, including the dioxin-responsive chemically activated luciferase gene expression (DR-CALUX) assay, produced similar responses. A cost comparison is also presented. © 2005 Elsevier B.V. All rights reserved.
Keywords: Comprehensive two-dimensional gas chromatography (GC × GC); Time-of-flight mass spectrometry (TOF-MS); Quadrupole ion storage mass spectrometry (QIST-MS); Tandem-in-time mass spectrometry (MS/MS); High-resolution mass spectrometry (HRMS); Dioxin-responsive chemically activated luciferase gene expression (DR-CALUX); Polychlorinated dibenzo-p-dioxins (PCDDs); Polychlorinated dibenzofurans (PCDFs); Polychlorinated biphenyls (PCBs)
1. Introduction
The measurement of selected polychlorinated dibenzo-p-dioxin (PCDD), polychlorinated dibenzofuran (PCDF), and
q
Second International Symposium on GC × GC, Atlanta, August 2004.
∗Corresponding author. Tel.: +32 04 366 35 31; fax: +32 04 366 43 87.
E-mail address:JF.Focant@ulg.ac.be (J.-F. Focant).
polychlorinated biphenyl (PCB) concentrations at the ultra-trace level in biological matrices is a challenge for analysts. The main reasons are obviously the low levels to measure (parts-per-billion [ppb] to parts-per-quadrillion [ppq]) and the large number of compounds to consider (>35 out of a total of >400). However, an additional major difficulty is the implementation of efficient sample pre-treatment prior to measurement. Foodstuffs are of prime interest because 0021-9673/$ – see front matter © 2005 Elsevier B.V. All rights reserved.
they are responsible for more than 95% of human intake and, therefore, subject to strict regulation[1].
As 2,3,7,8-substituted PCDD/Fs (the toxic congeners[2]) and dioxin-like PCBs (non- and mono-ortho-substituted) are lypophilic compounds, they tend to bio-accumulate in fat up at the higher end of the food chain. Consequently, analysts have to be able to extract the analytes from the lipid com-partment and remove as many matrix-related interferences as possible prior to gas chromatography (GC) analysis. Several approaches exist and necessitate the use of state-of-the-art extraction techniques, as well as automated preparative chro-matography instrument[3,4].
Classically, GC coupled to 13C-labelled isotope dilu-tion (ID) sector high-resoludilu-tion mass spectrometry (HRMS) is used for accurate identification and measurement of PCDD/Fs and PCBs in cleaned extracts[5]. Due to high finan-cial investment, high operating cost, and high qualification requirements for operators, alternative approaches have been investigated during recent years. The European Union distin-guishes reference methods from screening methods[6]. The only reference method is GC–ID-HRMS using sector ments. Screening methods can still be based on MS instru-ments or may consist of bioassays or immunoassays. In the mass spectrometric area, the most studied alternative method is GC coupled to bench-top low resolution quadrupole ion storage mass spectrometry (QIST-MS)[7,8]. The loss in mass resolution is counter-balanced by a gain in specificity by oper-ating the QIST-MS in tandem mode. Specificity is ensured by the monitoring of daughter ions issued from the partic-ular fragmentation of target parent ions[9]. The sensitivity is high enough to allow analyses at similar levels to HRMS [10,11]. Because HRMS and QIST-MS perform, respectively, in selected ion monitoring (SIM) and in multiple reaction monitoring (MRM) mode, chromatograms have to be split in time windows, for which different SIM descriptor ions are defined. Although SIM improves instrument sensitivity, its major drawback is the necessity of redefining SIM windows every time the chromatographic parameters are modified. This risks the missing of compounds that are no longer in their time window. Additionally, because of scan rate limitations, the SIM approach is not compatible with the measurement of a large number of compounds characterized by different masses inside the same window.
Time-of-flight mass spectrometry (TOF-MS) offers the advantage of a comprehensive mass analysis in a broad dynamic range [12]. Because TOF-MS is a non-scanning technique, all ions included in the mass range are virtually recorded at the same time and are represented at the same point on the chromatographic peak profile. Constant ion ratio across the GC peak is thus ensured. High quality mass spectra are produced and deconvoluted if more than one compound is present at the time mass spectra are recorded, as is the case when two compounds chromatographically co-elute. How-ever, GC–TOF-MS has relatively poor instrumental limits of detection (LODs), compared with HRMS and QIST-MS. One solution to improve these LODs is to operate in fast
GC (FGC) mode. The resulting peak compression conducts somewhat more intense (narrower) peaks and, in practice, instrumental LODs of 0.5 pg have been reported in the case of PCBs[13]. However, in the case of PCDD/Fs, such an FGC approach would both compromise the already limited chromatographic resolution (observed, for example, in the case of hexa-chlorinated congeners), and lead to undesirable co-elution problems.
Because it also offers zone compression of chromato-graphic peaks while improving the peak capacity of the sep-aration system, comprehensive two-dimensional gas chro-matography (GC × GC)[14,15], represents a potential solu-tion to enhance the sensitivity TOF-MS without scarifying chromatographic resolution. In the case of PCBs, it has been reported that LODs of a GC × GC–TOF-MS system can be up to 10-times lower than its GC–TOF-MS equivalent and be in the range of 0.2–0.5 pg injected[16]. GC × GC–ID-TOF-MS has recently been successfully used to analyze soil and ashes for PCDD/Fs[17], but also to measure a large set of analytes consisting of a mixture of 38 PCBs, 11 OCPs (organochlo-rine pesticides), and 10 PBDEs (polybrominated diphenyl ethers) in human body fluids[18]. All analytes (and their cor-responding13C-labels) were separated chromatographically or by mean of mass spectral deconvolution.
MS based screening methods have to fulfill the same requirements as GC–HRMS in terms of the following: ID standards used, spiking, control of recovery rates, and GC separation. Cell-based bioassays, on the other hand, have to comply with specific requirements regarding the use of reference samples, calibration, precision, and LODs[6]. Cur-rently, one of the assays that fits best with the requirements for the screening of dioxins and dioxin-like PCBs in foodstuffs is the dioxin-responsive chemical-activated luciferase gene expression (DR-CALUX) bioassay[19]. Like its CALUX homologue[20] based on mouse cell lines, it uses geneti-cally modified rat cell lines into which the firefly luciferase gene has been incorporated and is under the control of the aryl hydrocarbon (Ah) receptor. This is the receptor to which xenobiotics, such as some dioxins and PCBs, bind once in the cell media[21]. The quantity of dioxins and PCBs present in a sample extract submitted for bio-testing is estimated in terms of the luminescence that results from the enzymatic activity of the firefly luciferase produced. Details on the basics of the bio-assay approach are available elsewhere[22].
The present study focused on the development and testing of a GC × GC–ID-TOF-MS method for the measurement of selected PCDD/Fs and PCBs in foodstuffs for which regula-tory levels have been set by the European Union[1]. The set of compounds consisted of seven 2,3,7,8-substituted PCDDs, ten 2,3,7,8-substituted PCDFs, four non-ortho-PCBs, eight mono-ortho-PCBs, and six indicator PCBs (Aroclor 1260), from a total of 35 compounds. GC × GC–ID-TOF-MS results were compared to the confirmatory reference GC–ID-HRMS method, to the alternative screening GC–ID-QIST-MS/MS method, and to the DR-CALUX bioassay screening method.
2. Experimental
2.1. Chemicals
All solvents were Pestanal reagents (Riedel-de Ha¨en, Seelze, Germany). Nonane puriss analytical-reagent grade, standard for GC, was purchased from Fluka (Steinheim, Germany). Sodium sulfate anhydrous was Baker-analyzed (J.T. Baker, Deventer, The Netherlands). Liquid nitrogen was purchased from Air Liquide (Liege, Belgium). Chro-matographic pure grade helium gas, 99.9999%, was pur-chased from Air Products (Vilvoorde, Belgium). The internal standard solution of the seventeen 2,3,7,8-chloro-subsituted 13C
12congeners labeled PCDD/Fs (EDF-4144), the calibra-tion standard solucalibra-tion (EDF-4143), and the syringe (recov-ery) standard (EDF-4145) were purchased from Cambridge Isotope Laboratory (Andover, MS, USA). The EDF-4143, EDF-4144, and EDF-4145 concentrations of the native and labeled congeners are summarized in a previous report[23]. The 13C
12-labelled PCB internal standard spiking solution 5023), as well as the 10-point calibration solutions (EC-5022), were obtained from CIL. For PCDD/Fs and non-ortho-PCBs, a mixture of [13C]TeCB-80, [13C6]1,2,3,4-TeCDD, and [13C]1,2,3,4,7,8,9-HpCDF was used as the recovery stan-dard. Non-ortho-PCB recovery rates were calculated against 13C-TeCB-80. TeCDD/F and PeCDD/F recovery rates were calculated against [13C6]1,2,3,4-TeCDD. HxCDD/F, HpCDD/F, OCDD/F recovery rates were calculated against [13C]1,2,3,4,7,8,9-HpCDF. For mono-ortho-PCBs and indi-cator PCBs,13C-TeCB-80 was used as the recovery stan-dard. Details on MS standards are available elsewhere[24]. The bioassay 2,3,7,8-TeCDD standard solution in DMSO (dimethyl sulfoxide) (purity >98%) came from Wellington Labs. (Campro Scientific, Veenendaal, The Netherlands). 2.2. Sample preparation
Biological samples consisted of fish, pork, and cow’s milk. Fish samples were filleted and minced North Sea her-ring. All samples were part of the dioxins in food and feed – reference methods and new certified reference materials (DIFFERENCE) European project[25]. Samples were issued from homogenized pools and canned in sub-samples prior to shipping to the laboratory. Samples were analyzed twice in triplicate (in two independent series). Except for the bioassay, internal13C-labelled standards were added prior to extrac-tion. Recovery standards were added to the GC vials prior to injection. Beef fat and milk QC samples, as well as method blanks, were incorporated into a series of unknowns. Further-more, for the bioassay, for each biological sample, a reference sample was available and analyzed by both GC–ID-HRMS and DR-CALUX.
2.2.1. Sample preparation for mass spectrometric analysis 2.2.1.1. PCDD/Fs and dioxin-like PCBs. Fish samples were mixed with sodium sulfate (2 equivalent in weight) prior
to extraction by pressurized liquid extraction (PLE) using a Dionex ASE 200 extractor (Sunnyvale, CA, USA). Hex-ane was used, 20 ml of hexHex-ane per cycle, 5 min cycle time, 2 cycles per extraction, pressure of 1500 psi. Extracts were dried by filtration through sodium sulfate, evaporated at 40◦C using a rotary evaporator (Laborota 4000, Heildolph, VWR International, Leuven, Belgium). The extractable lipid con-tent was determined gravimetrically and the fat was diluted in 50 ml of hexane prior to further clean-up. The sample sizes were 15 g. Pork samples were mixed with sodium sulfate (3 equivalent in weight) prior to extraction by PLE and received identical treatment to the fish samples. Sample sizes ranged between 31 and 33 g. Whole milk samples were sonicated at 35◦C for 30 min and then Liquid–liquid extracted with a mixture of ethanol, ammoniac, diethyl ether, and hexane (4:1:5:5) for 30 min. Sample sizes ranged between 100 and 130 g. As for fish and pork, extracts were dried for lipid determination and a final volume of 50 ml of hexane was obtained.
Sample clean-up was carried out using an auto-mated system (Power-Prep, Fluid Management Systems, Waltham, MA, USA) [4]. The disposable column sets were made of multi-layer (acidic, basic and neutral) sil-ica columns, basic alumina columns, and carbon-celite columns. The mono-ortho-PCB fraction was collected when flushing the carbon column in a forward direction with a hexane–dichloromethane mixture (1:1). The PCDD/F and non-ortho-PCB fractions were collected when back-flushing the carbon column with toluene. Details of the fraction-ation procedure have been reported previously [23,26,27]. Cleaned extracts were evaporated using a Turbovap II work-station (Zymark, Paris, France) after the addition of 10 ml (PCDD/Fs and non-ortho-PCBs) and 20 ml (mono-ortho-PCBs) of nonane. For GC–ID-HRMS injections, final vol-umes were 10 ml (PCDD/Fs and non-ortho-PCBs) and 100 ml (mono-ortho-PCBs). Extracts were stored in GC vials at −20◦C prior to GC–MS injection.
2.2.1.2. Indicator PCBs. Fish and pork samples (1.2–1.7 g) were treated as follows: Water and isopropanol (3 ml each) were added to the sample. Liquid–liquid extraction was car-ried out with 10 ml of a mixture of diethyl ether–hexane (3:97). Two extraction cycles with 30 min shaking each were performed at room temperature. Extracts were filtered on sodium sulfate (1 g) and evaporated to 2 ml under a gentle stream of nitrogen. Whole milk samples (7 g) were soni-cated at 35◦C for 30 min and then liquid–liquid extracted with a mixture of ethanol, ammoniac, diethyl ether, and hex-ane (4:1:5:5) for 30 min. Extracts were filtered on sodium sulfate (1 g) and evaporated to 2 ml under a gentle stream of nitrogen.
Sample clean-up was carried out according to the Bel-test I014 method[28]. From top to bottom, the open column was made of 0.5 g of sodium sulfate, 1 g of deactivated alu-mina, and 4 g of acidic silica. Hexane was used as the solvent (twice 10 ml). Cleaned extracts were evaporated using a
Tur-bovap II workstation after the addition of 20 ml of nonane. For GC–ID-HRMS injections, final volumes were 100 ml. Extracts were stored in GC vials at −20◦C prior to GC–MS injection.
2.2.2. Sample preparation for DR-CALUX analysis Fish and pork samples (30 g) were treated as follows: Water and isopropanol (45 ml each) were added to the sam-ple. Liquid–liquid extraction was carried out with 90 ml of a mixture of diethyl ether–hexane (3:97). Three extraction cycles were performed at room temperature (60 min shaking, once, followed by 30 min shaking, twice). After the addition of sodium sulfate (1 g) and filtration on silane treated glass wool, the extracts were evaporated to dryness at 40◦C using a rotary evaporator (Laborota 4000, Heildolph, VWR Inter-national, Leuven, Belgium). Whole milk samples (150 g) were sonicated at 35◦C for 30 min and then Liquid–liquid extracted with 450 ml of a mixture of ethanol, ammoniac, diethyl ether, and hexane (4:1:5:5) for 30 min. Extracts were filtered on sodium sulfate (1 g) and evaporated to dryness. The fat weight was determined, and 2 g of fat was used for the clean-up.
Sample clean-up was carried out according to the method proposed by BioDetection System (BDS)[29], slightly mod-ified. From top to bottom, the open column consisted of 2 g of sodium sulfate, 20 g of 20% sulfuric acidic/silica, 20 g of 33% sulfuric acidic/silica and glass wool. Hexane/diethyl ether (97:3) was used as a solvent (135 ml). Cleaned extracts were evaporated using a Turbovap II workstation. Just before completing evaporation of the solvent, DMSO was added and the remaining solvent was evaporated under a gen-tle stream of nitrogen. In the case of method blanks, the same procedure was applied to the solvent instead of the sample.
2.3. Measurement 2.3.1. GC–ID-HRMS
2.3.1.1. PCDD/Fs and non-ortho-PCBs. Concentrations were measured on an Autospec Ultima (Micromass, Manch-ester, UK) coupled to an Agilent 6890 Series (Palo Alto, CA, USA) gas chromatograph equipped with an A200SE autosampler (CTC Analytics, Zwingen, Switzerland). The MS transfer line temperature was 275◦C. The column was a 50 m VF-5MS (0.20 mm I.D., 0.33 mm df) (Varian, Sint-Katelijne-Waver, Belgium). Helium was used as the carrier gas at a constant flow rate of 1 ml/min. 5 ml of the final extract in nonane were injected into a PTV injector ramped as follows: 40◦C for 3 min, at 720◦C/min to 320◦C for 4 min, at 720◦C/min to 330◦C for 43 min. The oven tem-perature program was: 60◦C for 1.5 min, at 70◦C/min to 200◦C, at 3.2◦C/min to 235◦C for 1.5 min, at 3.2◦C/min to 270◦C for 10 min, and at 15◦C/min to 310◦C for 13 min. The HRMS instrument was operated in SIM mode at a minimum mass resolution of 10 000. The ion source tem-perature was 270◦C and the EI energy was 40 eV. Additional
GC and HRMS parameters, including performing conditions, followed isotope ratio checks and quantifying ions, and qual-ity control for measurements were as described previously [23].
2.3.1.2. Mono-ortho-PCBs and indicator PCBs. Concen-trations were measured on an MAT95XL (Thermofinni-ganMAT, Bremen, Germany) coupled to an Agilent 6890 Series (Palo Alto, CA, USA) gas chromatograph equipped with an A200SE autosampler (CTC Analytics). The MS transfer line temperature was 275◦C. The column was a 25 m HT-8 (0.22 mm I.D., 0.25 mm df) (SGE, Austin, TX, USA). Helium was used as the carrier gas at a constant flow rate of 0.8 ml/min. Two microlitres of the final extract in nonane were injected into a split/splitless injector held at 275◦C in splitless mode. The oven temperature pro-gram was: 140◦C for 2 min, at 15◦C/min to 220◦C for 7.5 min, at 6◦C/min to 250◦C, at 2◦C/min to 260◦C, and at 12◦C/min to 320◦C. The HRMS instrument was oper-ated in SIM mode at a minimum mass resolution of 10 000. The ion source temperature was 250◦C and the EI energy was 50 eV. The ion dwell time ranged between 20 and 80 ms, depending on the ion window. The inter-scan time was 10 ms.
2.3.2. GC–ID-QIST-MS/MS
2.3.2.1. PCDD/Fs and non-ortho-PCBs. Concentrations were measured using a low resolution Finnigan PolarisQ ion trap mass spectrometer (Austin, TX, USA). The separation was performed on a 50 m VF-5MS (0.20 mm I.D., 0.33 mm df) (Varian). Helium was used as the carrier gas at a constant flow rate of 1 ml/min. Five microlitres of the final extract in nonane were injected into a PTV injector ramped as fol-lows: 140◦C for 0.1 min, at 720◦C/min to 160◦C for 0.5 min, at 720◦C/min to 340◦C for 45 min. The oven temperature program was: 100◦C for 5 min, at 52◦C/min to 210◦C, at 2.9◦C/min to 300◦C for 12 min. Details on measured ions are available elsewhere[11].
2.3.2.2. Mono-ortho-PCBs and indicator PCBs. concentra-tions were measured on a low resolution GCQ (Finnigan). Separation was performed on a 25 m HT-8 (0.22 mm I.D., 0.25 mm df) (SGE) column. Helium was used as the car-rier gas at a constant flow rate of 0.8 ml/min. 2 ml of the final extract in nonane were injected into a split-splitless injector at 275◦C. The oven temperature program was: 140◦C for 2 min, at 15◦C/min to 220◦C for 7.5 min, at 6◦C/min to 250◦C, at 2◦C/min to 260◦C, at 12◦C/min to 320◦C.
The ion trap was connected by a heated transfer line (300◦C) to a Thermoquest Trace GC 2000 (Milan, Italy) gas chromatograph equipped with a Combi Pal autosampler (CTC Analytics). The ion source temperature was 210◦C and the EI energy was 70 eV. The scan time was 250 ms. Xcalibur 1.2 was used for data acquisition. Details are available in a previous report[11].
2.3.3. GC × GC–ID-TOF-MS
The GC × GC–TOF-MS instrument was the Pegasus 4D (Leco, St Joseph, MI, USA). This system is based on a non-moving quad-jet modulator consisting of two permanent cold nitrogen jets and two pulsed hot-air jets, which are respon-sible for the trapping and refocusing of compounds eluting from the first dimension (1D) column. This modulator was mounted in an Agilent 6890 GC oven and liquid nitrogen was used to create the cold jets. The column set was made of a 40 m RTX-500 (0.18 mm I.D., 0.10 mm df) (Restek) in the first dimension (1D) and a 1.5 m BPX-50 (0.10 mm I.D., 0.10 mm df) (SGE) in the second dimension (2D). The modu-lation period (PM) was 4 s. The hot pulse duration was 750 ms. Helium was used as the carrier gas at a constant flow rate of 0.8 ml/min. 1.2 ml of the final extract in nonane were injected into a split/splitless injector held at 250◦C in splitless mode and equipped with a press-tight Restek Uniliner. The pri-mary oven was programmed as follows: 140◦C for 1 min, at 10◦C/min to 240◦C, at 1◦C/min to 260◦C for 5 min, at 10◦C/min to 330◦C for 5 min. The secondary oven tempera-ture offset was 20◦C. The modulator temperature offset was 40◦C. The secondary oven temperature program was: 160◦C for 1 min, at 10◦C/min to 260◦C, at 2.8◦C/min to 350◦C for 5 min. The MS transfer line temperature was 280◦C. The ion source temperature was 250◦C with an EI energy of 70 eV. The collected mass range was 100–550 mm. The scan rate was 60 scans/s and the detector voltage was 1800 V. Data processing and display of the GCxGC chromatograms were achieved using integrated Leco ChromaTOF software, ver-sion 2.10 (Pegasus Driver 2.12). Peak apexes were found automatically and were further corrected manually when required.
2.3.4. DR-CALUX
The DR-CALUX was developed by Wageningen Univer-sity[19]and is distributed by BioDetection System (BDS, The Netherlands). This assay consists of the rat hepatoma H4IIE cell line stably transformed with an AhR controlled luciferase reporter gene construct. Analyses were performed by exposing the cells (triplicates, 96-well plates) during 24 h to sample extracts and to 2,3,7,8-TeCDD standard solutions in DMSO diluted in culture medium (a-MEM, Invitrogen, Merelbeke, Belgium) containing 10% (v/v) of fetal calf serum (FCS, Invitrogen). The final concentration of DMSO in cul-ture medium was 0.4% (v/v) for fish and milk samples and 1% for the pork sample. After cell lysis and substrate addition [buffer containing 0.01% (w/v) luciferin (Promega, Charbon-nieres, France) and 0.5 mM ATP (Roche Diagnostics, Vilvo-orde, Belgium)], luminescence was measured using a lumi-nometer Orion II (Berthold Detection System, Pforzheim, Germany). DR-CALUX concentrations were calculated from a standard calibration curve, ranging from 0 (blank DMS0) to 20 pg 2,3,7,8-TeCDD/well, and established in triplicate on each 96-well plate. Dose response curves were fitted using a user-defined curve fit. See previous report for full details [30].
3. Results and discussion
3.1. Optimization of GC × GC separation
GC × GC separation had been optimized to enable the seven 2,3,7,8-substituted PCDDs, ten 2,3,7,8-substituted PCDFs, four non-ortho-PCBs, eight mono-ortho-PCBs, and six indicator PCBs (Aroclor 1260) to be separated in a sin-gle injection. However, we decided to consider two sepa-rate injections for the present study for two reasons: firstly, because we knew from a previous method development exercise[18]that data handling and processing were major issues for the GC × GC–TOF-MS instrument and secondly, because the sample preparation we use produces two sepa-rate fractions (the first one containing indicator PCBs and mono-ortho-PCBs, the second one containing the PCDD/Fs and non-ortho-PCBs). This permitted a reduction in data processing time to less than 2 min per calibration stan-dard, when computing the calibration curves, and a reduc-tion in real sample processing time to less than 10 min. The data files were around 120 Mb for each processed sample, although separated PCB and PCDD/F calibration files still required multiple 4.7Gb-DVD session space for backup.
From among the various column combinations reported earlier for PCBs and dioxin analyses[31–34], a1D carborane-based dimethyl polysiloxane stationary phase[35]was cou-pled to a2D medium polarity 50% phenyl polysilphenylene-siloxane phase of lower diameter and lower film thickness than 1D. The high thermal stability of those two phases allowed work at temperatures as high as 370◦C, ensuring the production of narrow2D peaks with 150ms and 60ms of peak width at the base and at half height, respectively. Under opti-mized conditions (see Section2: Experimental procedures), three to four2D peaks were produced for each analyte after modulation (PM= 4 s).
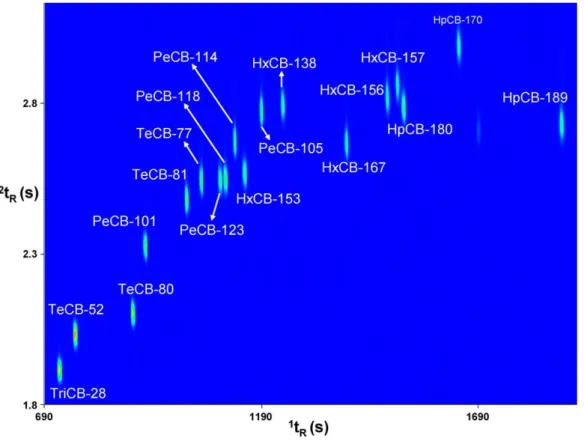
Figs. 1 and 2illustrate the chromatographic distribution of analytes into the GC × GC separation space. One can see the successful separation of PeCB-123 and PeCB-118. Those two congeners have different toxic equivalence to 2,3,7,8-TCDD[2]and must be reported separately. Additionally, in the case of fish, for which the bioaccumulation pathway is known to be different from terrestrial species, another crit-ical PCB separation was attained. HxCB-163 (not included in the monitoring set of congeners) was chromatographically separated from HxCB 138 (Aroclor 1260). Details concern-ing the elution pattern of PCBs on a GC × GC column set consisting of a 1D carborane based dimethyl polysiloxane phase and a2D 50% phenyl polysilphenylene-siloxane phase are available in a previous report[36].
InFig. 2, the elution of the 17 PCDD/Fs and of the 4 non-ortho-PCBs is illustrated. The hexa-chlorinated congeners (3 PCDDs and 4 PCDFs) were baseline-separated with the exception of 1,2,3,4,7,8-HxCDF and 1,2,3,6,7,8-HxCDF for which attention was needed for the assignment of potentially overlapping2D peaks. As illustrated inFig. 3, two2D peak
Fig. 1. GC × GC–ID-TOF-MS contour plot of a standard solution containing a mixture of the six indicator-PCBs, two non-ortho-PCBs, the eight mono-ortho-PCBs, and TeCB-80 at a concentration of 40 pg/ml. RIC based on the following ions: m/z 258 + 294 + 326 + 360 + 394 × 4 + 304 × 4.
Fig. 2. GC × GC–ID-TOF-MS contour plot chromatogram of a standard solution containing a mixture of seven substituted PCDDs, ten 2,3,7,8-substituted PCDFs, four non-ortho-PCBs, as well as TeCB-80 and 1,2,3,4-TCDD in a concentration range from 2.0 to 300 pg/ml. RIC based on the following ions: m/z 28 × 3 + 304 + 334 × 3 + 318 × 2 + 368 × 3 + 352 × 3 + 338 + 372 + 402 × 3 + 386 × 3 + 436 × 3 + 420 × 4 + 472 × 3 + 456 × 3.
Fig. 3. GC × GC–ID-TOF-MS peak clusters of [13C]1,2,3,4,7,8-HxCDF (X)
and [13C]1,2,3,6,7,8-HxCDF (Z) at a level of 125 pg in a standard solution. clusters (X and Z) can be defined to describe the two com-pounds. This, however, requires manual peak assignment to ensure that X4 and Z1 are seen as part of different clus-ters. Not only are the first dimension retention time (1tR) and second dimension retention time (2tR) similar, but the mass spectra are also identical for 1,2,3,4,7,8-HxCDF and 1,2,3,6,7,8-HxCDF. Consequently, the two traces cannot be automatically deconvoluted. For standard solutions, this was the only situation for which manual input was necessary to ensure proper 2D peak combination and assignment. The chromatographic separation was in agreement with the Euro-pean Commission Directive 2002/69/EC[6], which requires less than 25% of peak overlapping for these two hexa-chlorinated furans. The case of OCDD and OCDF illustrates the efficiency of the2D phase in separating those two com-pounds that co-elute in1D.
3.2. Calibration of the GC × GC–ID-TOF-MS setup For mono-ortho-PCBs and indicator PCBs, the concen-tration of calibration standards ranged from 0.4 to 140 pg/ml for the12C-native compounds, with a constant concentra-tion of 20 pg/ml for the corresponding 13C-labels. Each of the analytes had its own internal standard. For all analytes, the 0.4 pg/ml standard always gave a signal-to-noise (S/N) ratio of greater than 5. As illustrated in Table 1, two ions were summed for quantification of all compounds (natives and labels). The couple [M + 2] and [M + 4] was selected in all cases, except for TriCBs, TeCBs, TeCDF, and 2,3,7,8-TeCDD, where [M] and [M + 2] ions were used. For the low end of the calibration curve, only one2D peak was produced, due to the small amount of compound. Relative response fac-tors (RRFs) ranged from 0.91 to 1.2, with the larger deviation from the unit value observed for the lowest part of the con-centration range. As in the case of unknown samples, isotope ratios of the selected quantification ions were compared to theoretical values (Table 1). A deviation of 20% from the theoretical value was accepted for the data to be validated.
PCDD/F and non-ortho-PCB calibration standard con-centrations differed depending on analytes. A complete list
of the standards has been reported previously [23]. The dynamic working range was 0.5–7.5 pg/ml, 0.2–35 pg/ml, 0.5–7.5 pg/ml, 1–10 pg/ml, 1–7.5 pg/ml, 1.25–25 pg/ml, 5–25 pg/ml, 10–100 pg/ml, 2–7.5 pg/ml, and 50–500 pg/ml, for TeCDF, TeCDD, PeCDFs, PeCDD, HxCDFs, HxCDDs, HpCDFs, HpCDD, OCDF, and OCDD, respectively. RRF values ranged from 0.89 to 1.32. For PCDD/Fs, the minimum accepted S/N value was decreased to 2. Signals greater than 2, with a calculated isotope ratio inside the accepted 20% deviation range, were considered as valid. The dynamic working range for non-ortho-PCBs was 4–80 pg/ml, with RRF values from 0.97 to 1.03 for PeCB-126 and HxCB-169, and 1.12 to 1.29 for TeCB-77 and TeCB-81, for which blank levels were elevated in the laboratory during the time that the project was running.
During the study, two independent sets of calibrations were produced for both groups of compounds. The first order linear calibration curves were forced to origin for all com-pounds. Most of the correlation coefficients were greater than 0.999. The unknown samples were split into two series of triplicates; each series was quantified against a different cal-ibration curve.
3.3. Comparison of congener-specific methods
As for GC–ID-HRMS and GC–ID-QIST-MS/MS, ID based on the use of 13C-labelled compounds was used for quantification. The ratios of12C-native areas over13C-label areas were calculated and corrected by RRF values issued from the calibration curve calculations. The major difference using GC × GC–ID-TOF-MS was that areas of 2–42D peaks had to be summed up prior to quantification. This exercise significantly increases the processing and reviewing time, but is important for accurate quantification [18]. To reduce the influence of sample extraction and clean-up on the com-parison exercise, the same sample sizes were extracted and identical sample preparation steps were performed for the three MS techniques.
Recovery rates, based on the addition of recovery (sur-rogate) standards prior to GC–MS injection, were therefore similar for all methods. They complied with the requirements of the European Commission Directive 2002/69/EC[6], in which a range of 60–120% has been defined for confirma-tory methods and a range of 30–140% for screening methods. Although GC–ID-QIST-MS/MS and GC × GC–ID-TOF-MS are strictly defined as screening methods in the Directive, recovery rates ranged in the interval defined for confirmatory methods. Blank (BC) analyses were performed by carrying out the entire analytical procedure to which unknown sam-ples were exposed. Because BC levels are mainly dependent on sample preparation procedure, levels were similar and no significant influences of MS measurement on BC levels were recorded during the study. All data reported here were BC-corrected.
In order to compare the responsiveness of the three MS-based methods without any sample matrix influence, an
Table 1
Principal chromatographic and mass spectrometric parameters for the GC × GC–ID-TOF-MS separation of the selected PCBs and PCDD/Fs Peak number Congenera 1t
R(s) 2tR(s) Quantification masses Theoretical isotope
ratios Acceptable range (20%) 12C 12-natives 13C12-labels 1 TriCB-28 727 1.91 258 256 270 268 0.98 0.78–1.18 2 TeCB-52 751 2.09 290 292 302 304 0.77 0.62–0.92 3 TeCB-80b 895 2.11 – – 302 304 0.77 0.62–0.92 4 PeCB-101 923 2.34 328 326 340 338 0.65 0.52–0.78 5 TeCB-81 1025 2.27 290 292 302 304 0.77 0.62–0.92 6 TeCB-77 1061 2.32 290 292 302 304 0.77 0.62–0.92 7 PeCB-123 1094 2.56 328 326 340 338 0.65 0.52–0.78 8 PeCB-118 1106 2.56 328 326 340 338 0.65 0.52–0.78 9 PeCB-114 1126 2.69 328 326 340 338 0.65 0.52–0.78 10 HxCB-153 1150 2.57 362 360 374 372 0.82 0.66–0.98 11 PeCB-105 1186 2.79 328 326 340 338 0.65 0.52–0.78 12 HxCB-138 1233 2.81 362 360 374 372 0.82 0.66–0.98 13 1,2,3,4-TeCDDb,c 1252 2.56 – – 328 – – – 14 2,3,7,8-TeCDF 1264 2.56 304 306 316 318 0.77 0.62–0.92 15 2,3,7,8–TeCDD 1292 2.46 320 322 332 334 0.76 0.61–0.91 16 PeCB-126 1340 2.46 328 326 340 338 0.65 0.52–0.78 17 HxCB-167 1381 2.69 362 360 374 372 0.82 0.66–0.98 18 HxCB-156 1476 2.84 362 360 374 372 0.82 0.66–0.98 19 HxCB-157 1496 2.89 362 360 374 372 0.82 0.66–0.98 20 HpCB-180 1512 2.81 396 394 408 406 0.98 0.78–1.18 21 1,2,3,7,8-PeCDF 1559 2.61 342 340 354 352 0.65 0.52–0.78 22 2,3,4,7,8-PeCDF 1675 2.61 342 340 354 352 0.65 0.52–0.78 23 1,2,3,7,8-PeCDD 1691 2.54 358 356 370 368 0.66 0.53–0.79 24 HxCB-169 1711 2.42 362 360 374 372 0.82 0.66–0.98 25 HpCB-189 1875 2.76 396 394 408 406 0.98 0.78–1.18 26 1,2,3,4,7,8-HxCDF 2025 2.52 376 374 388 386 0.82 0.66–0.98 27 1,2,3,6,7,8-HxCDF 2037 2.54 376 374 388 386 0.82 0.66–0.98 28 1,2,3,4,7,8-HxCDD 2185 2.42 392 390 404 402 0.82 0.66–0.98 29 1,2,3,6,7,8-HxCDD 2197 2.42 392 390 404 402 0.82 0.66–0.98 30 2,3,4,6,7,8-HxCDF 2209 2.46 376 374 388 386 0.82 0.66–0.98 31 1,2,3,7,8,9-HxCDD 2264 2.37 392 390 404 402 0.82 0.66–0.98 32 1,2,3,7,8,9-HxCDF 2296 2.54 376 374 388 386 0.82 0.66–0.98 33 1,2,3,4,6,7,8-HpCDF 2436 2.39 410 408 422 420 0.98 0.78–1.18 34 1,2,3,4,6,7,8-HpCDD 2519 2.46 426 424 438 436 0.98 0.78–1.18 35 1,2,3,4,7,8,9-HpCDFb 2543 2.69 – – 422 420 0.98 0.78–1.18 36 OCDD 2703 2.94 458 460 470 472 0.88 0.70–1.05 37 OCDF 2707 3.15 442 444 454 456 0.88 0.70–1.05
aNumbering of PCBs, according to IUPAC. b Congeners used for recovery calculation. cThis congener is13C
6-1,2,3,4-TeCDD only.
unknown standard solution containing all the target ana-lytes had been analyzed.Table 2 presents the mean values issued from two sets (triplicates) of measurements performed against two independent sets of calibration data. Results from GC–ID-HRMS measurements were set as the refer-ence data to which the GC × TOF-MS and GC–ID-QIST-MS/MS methods were compared. For PCDD/Fs, the precision of the three measurements methods was similar, with RSD ranges of 0.6–11%, 1.4–12.9%, and 2.5–9.5% for GC–ID-HRMS, GC × GC–ID-TOF-MS, and GC–ID-QIST-MS/MS, respectively. In the case of PCBs, RSD ranges were even lower for GC–ID-HRMS and GC × GC–ID-TOF-MS, with values of 0.9–3.5% and 0.9–5.8%, respectively. GC–ID-QIST-MS/MS seemed to suffer from a lower preci-sion, with an RSD range of 2.1–16.3% but, for most of the analytes, the precision still complied with the maximal value
of 15%, described in the EU recommendations for confirma-tory methods[6]. Both GC × TOF-MS and GC–ID-QIST-MS/MS were within the range of 80–110% compared with the GC–ID-HRMS reference values. No explanation for the low OCDF GC × GC–ID-TOF-MS response case has yet been found and is still under investigation.
Real fish, pork, and milk samples were analyzed.Fig. 4 illustrates the results for the non-ortho and mono-ortho-PCBs. These PCBs are the ones that express similar toxicity pathways to 2,3,7,8-TCDD and that contribute to the toxic equivalence (TEQ) calculation[2]. They usually contribute between one third and one half of the 2,3,7,8-TeCDD-like toxicity in foodstuff samples. FromFig. 4, it appears that all methods performed similarly for the three investigated matrices independent of the levels. Lower RSDs were repro-ducibly observed for the reference GC–ID-HRMS method.
Table 2
Comparison between GC–ID-HRMS, GC × GC–ID-TOF-MS and GC–ID-QIST-MS/MS for the measurement of the selected PCBs and PCDD/Fs in an unknown standard solution
Congenerapg/g solution
GC–ID-HRMS GC × GC-ID-TOF-MS Relative to GC–ID-HRMS (%)b GC–ID-QIST-MS/MS Relative to GC–ID-HRMS (%)b
Mean RSD (%) Mean RSD (%) Mean RSD (%)
2,3,7,8-TeCDD 18.7 2 14.9 12 80 16.9 6 91 1,2,3,7,8-PeCDD 22.2 4 24.6 1 111 21.5 9 97 1,2,3,4,7,8-HxCDD 9.5 5 7.9 12 83 8.2 5 86 1,2,3,6,7,8-HxCDD 24.4 3 23.3 10 96 27.9 9 114 1,2,3,7,8,9-HxCDD 16.0 1 13.6 7 85 13.8 5 86 1,2,3,4,6,7,8-HpCDD 34.4 1 26.3 4 76 31.9 6 93 OCDD 107.3 3 92.6 10 86 108.5 5 101 2,3,7,8-TeCDF 16.3 1 12.9 12 79 13.8 2 85 1,2,3,7,8-PeCDF 11.8 2 9.1 4 77 11.1 4 95 2,3,4,7,8-PeCDF 44.9 2 35.3 7 79 36.5 4 81 1,2,3,4,7,8-HxCDF 10.3 1 9.1 5 89 8.8 6 86 1,2,3,6,7,8-HxCDF 31.4 2 23.4 7 75 24.5 9 78 1,2,3,7,8,9-HxCDF 7.7 3 5.9 3 77 6.1 7 79 2,3,4,6,7,8-HxCDF 14.5 1 12.2 13 84 14.1 9 97 1,2,3,4,6,7,8-HpCDF 16.1 1 17.1 8 106 16.2 5 100 1,2,3,4,7,8,9-HpCDF 22.4 11 – – – 21.5 4 96 OCDF 35.0 1 21.6 6 62 30.4 4 87 TeCB-77 243.0 1 222.5 3 92 226.6 4 93 TeCB-81 26.2 1 23.9 2 91 24.9 4 95 PeCB-126 74.9 1 68.2 2 91 69.7 2 93 HxCB-169 22.5 3 21.6 6 96 21.4 2 95 PeCB-105 111.7 1 104.1 1 93 109.7 6 98 PeCB-114 33.2 2 30.4 3 92 30.5 15 92 PeCB-118 224.4 3 197.7 1 88 238.5 8 106 PeCB-123 55.1 1 52.4 4 95 51.0 7 93 HxCB-156 44.7 4 43.0 2 96 41.8 11 94 HxCB-157 33.6 2 31.2 1 93 31.8 6 94 HxCB-167 33.2 3 31.6 4 95 29.2 5 88 HpCB-189 54.7 1 47.3 1 86 46.5 16 85 TriCB-28 392.7 1 351.6 3 90 360.6 7 92 TeCB-52 229.9 1 223.4 1 97 226.1 9 98 PeCB-101 233.8 2 226.7 0 97 192.1 13 82 HxCB-138 146.6 1 147.5 3 101 129.6 10 88 HxCB-153 239.8 1 236.2 1 99 215.2 8 90 HpCB-180 283.9 1 254.4 6 90 318.2 5 112
aNumbering of PCBs according to IUPAC.
b Ratio calculated by dividing the GC × GC–ID-TOF-MS (or GC–ID-QIST-MS/MS) values by the reference GC–ID-HRMS values times 100.
Measurements of the six indicator PCBs were also performed on these samples. The method comparison exercise did not indicate any significant differences between the three MS-based methods. Concentrations ranged from 500 to 6000 pg/g fresh weight (fw) for fish, from 600 to 12,000 pg/g fw for pork, and from 30 to 70 pg/g fw for milk (data not shown). Such levels are well above the instrumental LODs for the alternative methods that were characterized by similar RSDs to GC–ID-HRMS (2–15%). One should, however, mention that, due to the low sample intake and the large variations in blank levels, TriCB-28 and TeCB-52 were below the limits of quantification (LOQs) for all methods in the case of pork and milk.
For PCDD/Fs (Fig. 5), levels in the unfortified matri-ces were much lower than for PCBs and can be consid-ered as the background levels currently encountconsid-ered in the EU. For fish, because of the relatively high levels and
the relatively large sample sizes (15 g), both GC × GC–ID-TOF-MS and GC–ID-QIST-MS/MS compared well with HRMS. However, although the RSDs for HRMS were 7–14%, GC × TOF-MS and GC–ID-QIST-MS/MS RSDs ranged from 10 to 60% and from 5 to 30%, respectively. In practice, such concentrations were very close to the lower end of the working range defined by the cal-ibration standards and on the edge of the LOQs. For example, the 15 g sample size and the 0.4 pg/g fw level of 1,2,3,7,8-PeCDF represent 1.1 pg of compound injected (75% recovery rates, 1.2 ml injected out of 5 ml).Fig. 6illustrates how low the signal for such levels can be regarding the total ion current and the 13C-labelled compounds. Three modulation cycles (PM= 4 s) are represented. The signal inFig. 6A is based on the TIC and is mainly a result of matrix interferences still present after the sample preparation procedure. Fig. 6B is the reconstructed ion current (RIC) based on the ions of the
Fig. 4. Comparison of GC–ID-HRMS with GC × GC–ID-TOF-MS and GC–ID-QIST-MS/MS for the measurement of non-ortho and mono-ortho-PCBs in fish (A), in pork (B), and in milk (C) samples (n = 6).
label compound (m/z 352 + 354) at a concentration of approx-imately 85 pg (10 ml of a 50 pg/ml standard solution, 75% recovery rates, 1.2 ml injected out of 5 ml).Fig. 6C is the RIC of the native (12C) 1,2,3,7,8-PeCDF (1.1 pg), only one 2D peak was obtained because of the very low level. That native peak signal was several orders of magnitude lower than the
TIC trace. Increasing sample sizes is not feasible in practice because the larger the sample size, the larger the quantities of solvents and sorbents, the higher the BC levels, and the higher the LOQs.
Conversely, in some cases, large standard deviation might be attributed to the fact that the system was measuring
out-Fig. 5. Comparison of GC–ID-HRMS with GC × GC–ID-TOF-MS and GC–ID-QIST-MS/MS for the measurement of PCDD/Fs in fish (A), in pork (B), and in milk (C) samples (n = 6).
side the working range. This is the case for 2,3,7,8-TeCDF for which the 3.1 pg/g fw values represent 8.4 pg injected (15 g sample size, 75% recovery rates, 1.2 ml injected out of 5 ml), although the highest point of calibration was 7.5 pg. Increasing the sample size would accentuate the problem. The
calibration standard concentrations were selected to cover as much as possible of the working range but out-of-calibration situations can always arise, depending on the congener dis-tribution in the sample. From this study, it appeared that GC × GC–ID-TOF-MS was more affected by this type of
Fig. 6. GC × GC–ID-TOF-MS raw chromatogram for 1,2,3,7,8-PeCDF in a fish sample. (A) TIC trace, (B) RIC trace for the13C label, and (C) RIC
trace for the native (1.1 pg injected).
out-of-calibration situation. In the case of pork (30 g sample size) and milk (130 g sample size), which are characterized by low background levels, the RSDs were higher (up to 90%). Such variations were not acceptable. Despite the poor preci-sion, the congener distribution was still well defined for all matrices and can be used to describe specific matrix patterns for contamination source tracking or fingerprinting of sets of samples.
3.4. Comparison of methods on a TEQ basis
Because all congeners do not express the same toxic-ity, results of dioxin and dioxin-like compound analyses are commonly reported in terms of 2,3,7,8-TCDD TEQs [2]. Regulations on admissible levels in foodstuffs are based on
sample TEQ values[1]. Data issued from the MS-based meth-ods can be converted into TEQs using toxic equivalent factor (TEF) tables[2].
As mentioned earlier, for regulation purpose, global mea-surement can also be made using bioassays, such as the DR-CALUX assay. In this case, a global response is obtained. The same fish, pork, and milk samples were run on the DR-CALUX (two independent sets of replicates) and data were compared to the reference GC–ID-HRMS results. All reported DR-CALUX results met the following basic quality criteria: for the 2,3,7,8-TeCDD calibration curve, the maxi-mum induction factor was at least six-fold, the EC50 value was in the range 0.4–2.4 pg TeCDD/well, R2 of the fitted curve was > 0.98, and the RSDs of the mean of the rela-tive light units (RLU) measured in triplicate was <15%. For samples, the sample response was below the response corre-sponding to the 2,3,7,8-TeCDD EC50and RSDs were <30%, as required by the European guidelines[6]. The quantifica-tion limits were 0.08, 0.02 and 0.03 pg DR-CALUX TEQ/g product for fish, pork and milk, respectively.
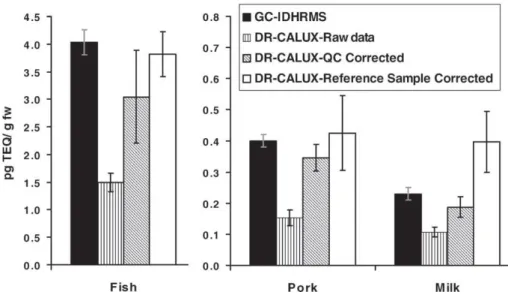
As shown inFig. 7, a large discrepancy appeared between the GC–ID-HRMS data and the raw DR-CALUX data. The biological method clearly and systematically underestimated the total TEQ (PCDD/Fs and dioxin-like PCBs) concentra-tions in each case. For the biological measurement, because the use of ID based on13C-labelled internal standards is not possible, it is difficult to account for the loss of analytes dur-ing the sample preparation procedure and an underestimation of sample burden is likely to happen. Two approaches were investigated to correct the raw DR-CALUX data.
First, the biological data were corrected by a factor tak-ing into account the ratio between results obtained for a well characterized fortified (PCDD/Fs and dioxin-like PCBs) beef fat quality control (QC) sample included in both GC–ID-HRMS and DR-CALUX series. This spiked beef fat QC contained 3.1 pg WHO-TEQ per g (34% of PeCB-126, 17% of PeCDD, 17% of TeCDD, 9% of 2,3,4,7,8 PeCDF), as measured by GC–ID-HRMS, and an average of 1.8 pg DR-CALUX TEQ/g. This significant variation accounted for the rather large difference we reported earlier[30]between the relative potencies (REP) of WHO-TEF and the DR-CALUX for PeCB-126 and PeCDD, two major components of the QC sample. The QC corrected DR-CALUX thus gets closer to the reference GC–ID-HRMS data but the trend of underestima-tion was still present for all samples. Addiunderestima-tionally, because the QC samples consisted of fat, they were not submitted to the entire sample preparation procedure (no extraction step required). Therefore, correcting raw DR-CALUX data using a factor based on this fat QC did not account for potential analyte losses during the extraction step.
The second approach was based on the use of matrix-specific reference samples for raw DR-CALUX data cor-rection. Each reference sample followed unknowns through the entire matrix-specific sample preparation procedure. This constitutes a better approach because similar congener dis-tributions, and thus similar assay responses, can be expected
Fig. 7. Raw and corrected responses of the DR-CALUX assay versus GC–ID-HRMS for the investigated samples. in identical matrices. Also, because the reference value is
calculated by GC–ID-HRMS, having a matrix specific ref-erence sample helps to reduce the effect of the diffref-erences between TEFs and REPs. The ratio of the total TEQ (sum of PCDD/Fs and dioxin-like PCBs) concentration measured by GC–ID-HRMS over the DR-CALUX response was used as a correction factor applied to the raw DR-CALUX data. Results for the congener-specific GC–ID-HRMS measurement of those DR-CALUX matrix-specific reference samples were the following: for the fish reference sample, 42% of PeCB-126, 27% of 2,3,4,7,8-PeCDF and 10% of 2,3,7,8-TeCDF; for the pork reference sample, 24% of 2,3,4,7,8-PeCDF, 15% of PeCB-126, 11% of 2,3,7,8-TeCDD, 10% of both HxCB-156 and 157; for the milk reference sample, 40% of PeCB-118, 28% of PeCB-126, and 9% of 2,3,4,7,8-PeCDF. Both pork and fish reference samples had a congener profile correspond-ing to a classical background contamination (similar to the pattern of the analyzed sample) and good correlations with the GC–ID-HRMS data were observed (Fig. 7). The situation was not as good for milk because the pattern observed in the reference sample (PeCB-118 was unusually high) was dif-ferent from a classical background congener distribution for milk and this influenced the raw data correction, as though a non-matrix specific reference sample had been used. The direct consequence led to an unexpected low recovery for the milk sample, inducing an over-estimation of the corrected DR-CALUX data.
Fig. 8summarizes the comparison of all methods in terms of TEQs. Quite surprisingly, although we previously pointed out much higher variations in the GC × GC–ID-TOF-MS and GC–ID-QIST-MS/MS responses for PCDD/Fs on a congener basis, as well as the difficulty for those methods to detect the low pg levels of analytes, the TEQ results compared favor-ably with GC–ID-HRMS (lower part in the bar graph in Fig. 8). In fact, a rather good description of the TEQ contrib-utors (2,3,7,8-TCDD [TEF = 1], 1,2,3,7,8-PeCDD [TEF = 1], 2,3,4,7,8-PeCDF [TEF = 0.5], see[2]for complete list of the
TEFs) was achieved using the alternative methods. The PCB contribution to the TEQ was similar for the three MS-based methods. The lower GC × GC–ID-TOF-MS value for pork was due to the lower reported concentration for PeCB-126, the most important PCB contributor (TEF = 0.1) to the TEQ. The MS-based method TEQs and the DR-CALUX reference sample corrected TEQ compared well (see earlier for milk discrepancy), although DR-CALUX RSDs were significantly higher (10–28%), which is acceptable for a screening method [6].
From a practical point of view, the slight variations observed around the reference GC–ID-HRMS value for the alternative methods can have important consequences. For example, the maximum acceptable level for PCDD/Fs in milk has been set at 3 pg PCDD/F TEQ/g on a lipid basis in the EU[1]. If one lipid corrects the data (3.3% lipids,
gravimetri-Fig. 8. TEQ comparison of GC–ID-HRMS with GC × GC–ID-TOF-MS, GC–ID-QIST-MS/MS, and DR-CALUX (reference sample corrected) for the measurement of PCDD/Fs (bottom part) and dioxin-like PCB (non-ortho and mono-ortho-PCBs) (upper part) for the investigated samples.
cally measured by six replicates), the concentrations become 2.77 ± 0.18 pg/g lipid weight (lw), 2.98 ± 0.94 pg/g lw, 3.52 ± 0.52 pg/g lw, and 11.91 ± 2.92 pg/g lw, for GC–ID-HRMS, GC × GC–ID-TOF-MS, GC–ID-QIST-MS/MS, and DR-CALUX, respectively. Of course, milk DR-CALUX data are known to be subject to reference sample-related prob-lems in the present study and the number also includes the response due to PCB content, although the regulation is based on PCDD/Fs only. But, for the MS-based techniques, the numbers could be used as such to check compliance with regulations, and the difference between those numbers might constitute a critical situation for decision makers. Currently, a sample is defined as non-compliant with the regulation maximum level if the measured value exceeds the maxi-mum level beyond a reasonable doubt, taking into account measurement uncertainty[37]. In other words, the measured value minus the estimated uncertainty (including additional parameters than just the RSDs issued from multiple mea-surements) must be above the regulation level for the sample to be declared non-compliant [38]. In the example of the milk, GC–ID-HRMS and GC × GC–ID-TOF-MS measure-ments would clearly define the sample as compliant, although GC–ID-QIST-MS/MS would conduct to an uncomfortable situation, right on the edge of non-compliance for the sam-ple.
3.5. Comparison of method costs
A cost estimate can be drawn for the different methods based on the following: 1000 unknown samples to be run yearly, including scientist employment, instrumentation pur-chase and paying-off (5 Years), reagents, sample preparation, ID standards, consumables, technology licensing and royal-ties (DR-CALUX), and costs relating to the incorporation of the required amounts of blanks and quality control samples in the series of unknowns. The cost estimate can vary, depending on several additional parameters, but the relative comparison of the methods presented here is based on similar operat-ing conditions and parameters (DR-CALUX cost is based on duplicate sample measurement). InTable 3, a relative cost comparison is shown and indicates that the costs involved in alternative techniques are not much lower than for GC–ID-HRMS. A closer look indicates that the cost distribution is, however, different. In fact, for the three alternative meth-ods, if the cost contribution related to the measurement itself
Fig. 9. GC × GC–ID-TOF-MS apex plot based on the retention data of the 37 compounds.
is reduced, the cost for scientific employment is increased. Using potentially more simple (cheaper) measurement tech-nologies seems to result in higher human input requirements (data processing, reviewing, and reporting).
In the case of GC × GC–ID-TOF-MS,Table 3 data are based on two separate injections, one for PCDD/Fs and non-ortho-PCBs, and one for mono-ortho-PCBs and indicator PCBs (see chromatograms inFigs. 1 and 2). The instrumental time can be compressed and the method simplified by per-forming multi-group analyte measurement, a single injection for the measurement of all analytes of interest instead of two separate injections. The apex plot inFig. 9illustrates the ana-lyte distribution inside the chromatographic area. The apex plot was created by combining the separate injection data to demonstrate the separation efficiency when the 37 com-pounds of interest are grouped together. The distribution of the two groups of compounds in the chromatographic space can be defined as bimodal with slight overlap between the groups of PeCBs and TeCDD/Fs (seeTable 1for numbering correspondences). Therefore, no additional co-elution prob-lems are recorded when pooling the two sets of analytes in a single injection. The total run time can then be 45 min for the separation of all 37 analytes (0.8 analyte per min). Currently, due to the complexity of the GC × GC–ID-TOF-MS data, this multi-analyte approach requires much larger processing and manual data reviewing time than the multiple injection approach. The classical manual data reviewing process for a real low level sample can still require up to several hours Table 3
Estimated percent distribution of the cost of the various stages of the measurement methods in the case of feed samples
GC–ID-HRMS GC × GC–ID-TOF-MS GC–ID-QIST-MS/MS DR-CALUXa
Scientist employment 23 35 35 36
Extraction 11 8 11 7
Clean-up 28 27 33 29
Measurement 38 30 21 8
Licensing and royalties – – – 20
Cost per sample (relative) +++++ +++++ ++++ +++
to be completed accurately. However, once those steps are as automated and as rigorous as for classical GC–MS, the expense related to highly skilled labor will fall and the over-all price of this method can be expected to be reduced by up to one third. Newly available and upcoming software features (e.g. raw TOF-MS data re-sampling), as well as enhanced computer power, will help to go in that direction. One should also keep in mind the comprehensive aspect of TOF-MS data collection. Because TOF-MS does not operate in SIM mode, all masses included in the defined mass range are collected. This permits the screening of mass spectral data for other compounds present in the same fractions afterwards, without sample reprocessing or reinjection.
Although, in this study, all MS-based techniques used automated sample preparation steps and DR-CALUX used manual ones, the contribution of sample preparation to the global cost is similar. The use of the DR-CALUX approach does not offer congener-specific data and pattern descrip-tion but permits the cutting of prices by half, making it the most economically efficient screening method. Additionally, because they fulfill the same quality control requirements and offer as much data as does the GC–ID-HRMS, the alternative GC × GC–ID-TOF-MS and GC–ID-QIST-MS/MS methods should not strictly be considered as screening methods, but as complementary methods.
4. Conclusions
The primary goal of the present study was to set up a 13C-labelled isotope dilution GC × GC-TOF-MS method for the measurement of 17 PCDD/Fs and 18 PCBs in foodstuff matrices. GC × GC–ID-TOF-MS showed its suitability to accommodate the task and to offer at least as much qual-ity control capabilqual-ity (isotope dilution quantification, isotope ratio check, dual set of retention time check) as GC–ID-QIST-MS/MS, another potential alternative to GC–ID-HRMS. While not as many dioxin-dedicated samples have ever been run on a GC × GC-TOF-MS instrument as on both GC–ID-QIST-MS/MS and GC–ID-HRMS, the study showed that the particularly large ion volume in the TOF-MS source makes it unlikely to be as influenced by sample extract quality as other classical small source types, a significant advantage for routine use. Furthermore, the TOF-MS instrument showed itself to be more robust than QIST-MS, where the ion trap can easily be contaminated by matrix interfering ions, reduc-ing sensitivity when used on a routine basis.
Although the measurement of PCBs is under control, fur-ther improvement in sensitivity at the sub-picogram level, together with reduced data handling and processing time requirements are still needed in order for GC × GC-TOF-MS to be set up as a true alternative to GC–ID-HRGC-TOF-MS for routine ultra-trace measurement of PCDD/F in challenging foodstuff matrices. Additionally, while the cost per sample for GC × TOF-MS is currently still similar to GC–ID-HRMS, reduction of human input for data handling will also
significantly reduce the cost and make this single injection multi-group method an appealing approach to obtain a quick and complete picture for all the 2,3,7,8-TeCDD toxicity-related congeners.
When comparing the methods on a PCDD/F TEQ basis, even if the differences are small, they could have impor-tant consequences when considering the use of alternative methods for measurement within the framework of a regula-tion based on a single number. In that context, and until the GC–ID-HRMS is considered as the reference method, results issued from both MS-based and biological alternative meth-ods should always be confirmed prior to decision-making regarding compliance with the regulation. Establishing the regulation based on an acceptable range, instead of a locked value, could simplify the situation from an analytical point of view, probably without significantly compromising the qual-ity of our foodstuffs.
Finally, as planned in the near future, the integration of PCBs into the EU regulation will help the DR-CALUX assay and the related simple sample preparation scheme to become truly the screening method of choice for global toxicity eval-uation at a moderate cost. Both of the MS-based alternative method are capable of describing PCB and PCDD/F congener profiles with reasonable precision when source identification is required for contamination tracking. GC × GC–ID-TOF-MS and GC–ID-QIST-GC–ID-TOF-MS/GC–ID-TOF-MS could therefore be defined as complementary methods to GC–ID-HRMS, rather than screening methods. Aside from the method, the constant decrease in foodstuff background levels, the proactive EU approach based on action and target levels, as well as plans for future lower residue limits will require additional improve-ments in LODs to ensure proper reporting.
Acknowledgements
The authors acknowledge the University of Li`ege, the Walloon Region, and the European Union as part of the DIF-FERENCE (Dioxins in Food and Feed – Reference Methods and New Certified Reference Materials) project (G6D-2001-40002) for their financial support. The samples were part of the certification feasibility study of the DIFFERENCE project.
References
[1] Council Regulation No. 2375/2001 of 29 November, 2001. Setting maximum levels for certain contaminants in foodstuffs, Offic. J. Eur. Commun. L32 (2001) 1.
[2] M. Van den Berg, L. Birnbaum, A.T.C. Bosveld, B. Brunstr¨om, P. Cook, M. Feeley, J.P. Giesy, A. Hanberg, R. Hasegawa, S.W. Kennedy, T. Kubiak, J.C. Larsen, F.X.R. van Leeuwen, A.K.D. Liem, C. Nolt, R.E. Peterson, L. Poellinger, S. Safe, D. Shrenk, D. Tillitt, M. Tysklind, M. Younes, F. Waern, T. Zacharewski, Environ. Health Perspect. 106 (1998) 775.
[4] J.-F. Focant, C. Pirard, E. De Pauw, Talanta 63 (2004) 1101. [5] T. Cairns, L. Fishbein, R.K. Mitchum, Biomed. Mass Spectrom. 7
(1980) 484.
[6] Commission Directive 2002/69/EC of 26 July 2002. Offic. J. Eur. Commun. (6.8.2002) L209/5.
[7] J.B. Plomley, M. Lausevic, R.E. March, Mass Spectrom. Rev. 19 (2000) 305.
[8] J.-F. Focant, C. Pirard, G. Eppe, E. De Pauw, J. Chromatogr. A 1067 (2005) 265.
[9] J.-F. Focant, G. Eppe, E. De Pauw, Chemosphere 43 (2001) 417. [10] D.G. Hayward, K. Hooper, D. Andrzejewski, Anal. Chem. 71 (1999)
212.
[11] G. Eppe, J.-F. Focant, C. Pirard, E. De Pauw, Talanta 63 (2004) 1135.
[12] H. Wollnik, Mass Spectrom. Rev. 12 (1993) 89.
[13] J.-F. Focant, J.W. Cochran, J.-M.D. Dimandja, E. De Pauw, A. Sj¨odin, W.E. Turner, D.G. Patterson Jr., Analyst 129 (2004) 331. [14] J. Dall¨uge, J. Beens, U.A.Th. Brinkman, J. Chromatogr. A 1000
(2003) 69.
[15] J.-M.D. Dimandja, Anal. Chem. 76 (2004) 167A.
[16] J.-F. Focant, A. Sj¨odin, D.G. Patterson Jr., J. Chromatogr. A 1019 (2003) 143.
[17] J.-F. Focant, E.J. Reiner, K. MacPherson, T. Kolic, A. Sj¨odin, D.G. Patterson Jr., S.L. Reese, F.L. Dorman, J.W. Cochran, Talanta 63 (2004) 1231.
[18] J.-F. Focant, A. Sj¨odin, W.E. Turner, D.G. Patterson Jr., Anal. Chem. 76 (2004) 6313.
[19] J.M.M. Aarts, L.H.J. de Haan, M.A.C. Schalk, M.A. Cox, A. Brouwer, Organohalog. Compd. 13 (1993) 361.
[20] I. Van Overmeire, J. Van Loco, P. Roos, S. Carbonelle, L. Goeyens, Talanta 63 (2004) 1249.
[21] J.M.M. Aarts, M.S. Denison, M.A. Cox, M.A.C. Schalk, P.M. Garri-son, K. Tullis, L.H.J. de Haan, A. Brouwer, Eur. J. Pharm. Environ. Tox. 293 (1995) 463.
[22] P. Behnisch, K. Hosoe, S.-I. Sakai, Environ. Int. 27 (2001) 413. [23] J.-F. Focant, G. Eppe, C. Pirard, E. De Pauw, J. Chromatogr. A 925
(2001) 207.
[24] C. Pirard, E. De Pauw, J.-F. Focant, J. Chromatogr. A 998 (2003) 169.
[25] Information available at:http://www.dioxins.nl/Difference/home diff/ framesetdiff.html.
[26] J.-F. Focant, E. De Pauw, J. Chromatogr. B. 776 (2002) 199. [27] C. Pirard, J.-F. Focant, E. De Pauw, Anal. Bioanal. Chem. 372 (2002)
373.
[28] Determination of polychlorbiphenyl in feed, fats of animal ori-gin, eggs, egg products, diary and other food stuffs, I14 BEL-TEST document, available at: (http://mineco.fgov.be/organization market/accreditation/beltest/documents en.htm#I).
[29] Training-manual BDS’ DR-CALUX® bioassay, Version
BDS-031/b/2002, BioDetection Systems, The Netherlands.
[30] M.-L. Scippo, G. Eppe, E. De Pauw, G. Maghuin-Rogister, Talanta 63 (2004) 1193.
[31] P. Haglund, M. Harju, R. Ong, P. Marriott, J. Microcol. Sep. 13 (2001) 306.
[32] P. Koryt´ar, P.E.G. Leonards, J. de Boer, U.A.Th. Brinkman, J. Chro-matogr. A 958 (2002) 203.
[33] M. Harju, C. Danielsson, P. Haglund, J. Chromatogr. A 1019 (2003) 111.
[34] P. Koryt´ar, C. Danielsson, P.E.G. Leonards, P. Haglund, J. de Boer, U.A.Th. Brinkman, J. Chromatogr. A 1038 (2004) 189.
[35] B. Larsen, M. Cont, L. Montanarella, N. Platzner, J. Chromatogr. A 708 (1995) 115.
[36] J.-F. Focant, A. Sj¨odin, D.G. Patterson Jr., J. Chromatogr. A 1040 (2004) 227.
[37] Commission Directive 2004/44/EC of 13 April 2004. Offic. J. Eur. Commun. (20.4.2004) L113/17.
[38] G. Eppe, G. Maghuin-Rogister, E. De Pauw, Anal. Chim. Acta 519 (2004) 243.
![Fig. 3. GC × GC–ID-TOF-MS peak clusters of [ 13 C]1,2,3,4,7,8-HxCDF (X) and [ 13 C]1,2,3,6,7,8-HxCDF (Z) at a level of 125 pg in a standard solution.](https://thumb-eu.123doks.com/thumbv2/123doknet/6302504.165285/7.892.103.381.133.361/fig-peak-clusters-hxcdf-hxcdf-level-standard-solution.webp)