Storage
-Iron Kinetics
VII.
A
BIOLOGIC MODEL FOR
RETICULOENDOTHELIAL
IRON
TRANSPORT
GEORGES
FILLET,
JAMES D.
COOK,
and
CLEMEINT
A.
FINcH
Fromthe Division of
Hematology,
Departmentof
Medicine,
University
ofWashington
School ofMedicine, Seattle,
Washington
98195A BSTR ACT The processing of erythrocyte iron by the reticuloendothelial cell has been characterized by
kinetic measurements of blood
radioactivity
made after the intravenous injection of heat-damaged erythrocytes labeled with'Fe
and of transferrin-bound'Fe.
Theearly reticuloendothelial release of iron, a matter of
hours, was calculated from the plasma turnover rate of
"'Fe
and the plasma reappearance of'"Fe.
Late releasewas calculated from the ratio of the cumulative incor-poration of both tracers into the
circulating
red cell mass over aperiod of 2 wk. There was an initialproces-sing period within the reticuloendothelial cell, after which radioiron either rapidly returned to circulation
(ti 34 min) or was transferred to a slowly exchanging pool of storage iron within the reticuloendothelial cell
(ti release to plasma of 7 days). These pathways were
of equal magnitude in the normal dog. Reticuloendo-thelial release of iron was largely independent of the
pre-existing plasma iron level or transferrin saturation.
Diurnal fluctuations in the plasma iron level were shown
tobethe result of avariablepartitioningof iron between the early and late release phases. Acute inflammation
re-sulted inaprompt andmarked increase inthefraction of
ironstored (late phase), whereasdepletion of iron stores resulted in a marked increase in early release.
This work was presented in part at the 15th Annual Meeting of the American Society of Hematology, Miami, Fla.,December 1972.
Dr. Fillet's present address is the Institute of Medicine,
H6pital de Baviere, University of Liege, B-4000
Lieige,
Belgium. He performed this work under the auspices of the Fonds Belge de la Recherche Scientifique.Received for publication 24 October 1973 and in revised
form 2 February 1974.
INTRODUCTION
Recircuiting
of iron from senescent red cells by the reticuloendothelial cells(RE)'
is an essential link in internal ironexchange.
Previous studies(1,
2) have shown thatpart of the red cell ironprocessedby the RE israpidly
returned to the plasma and anotherportion
exchanges with RE stores and is slowly reutilized. The
kinetics of those components has not yet been charac-terized. A number of studies purporting to characterize RE transport of ironhave employed hemoglobin (3, 4),
without theknowledgethatplasmahemoglobin is cleared
bythehepatocyte (5, 6). Other studies dealingwith RE
uptake of nonviable red cells have used so large an amount as to beunphysiologic (1, 2, 7). In addition, no
firm relationship hasbeen established between the
plasma
iron level and RE iron release, although it isgenerally
acknowledged that plasma transferrin is primarily
de-pendent on the RE for its supply of iron. It has been
suggested on the one hand, that diurnal variations in plasma iron concentration are due to variations in RE iron supply (3) and on the other hand, that RE iron release is affected by the plasma iron level (2). The presentstudy is an attempt to quantify iron transport by
the RE "in vivo" and to evaluate the role of the RE in the regulation ofthe plasma iron level. The dog was
se-lectedas anexperimental model because of thesimilarity
between internal ironmetabolism of dog and man
(8).
METHODSAdult dogs of both sexes weighing 15-22 kg were studied. The animals were inoculated against distemper, dewormed,
treated for ectoparasites, and then observed for a 2-3-wk
'Abbreviations
used in this paper: ACD, citric acid, so-dium citrate, and dextrose; 'DRBC, 'Fe-damaged red cells; PIT, plasma iron turnover; RE, reticuloendothelial cell; TIBC, total iron-binding capacity; TT, mean transittime.
period. They were housed in individual cages and fed with Purina Chow (Ralston Purina Co., St. Louis, Mo.). 13 normal dogs were studied under basal conditions and a repeat study was performed in two of these. Special studies were conducted on an additional 13 dogs that were pre-treated as described below so as to modify internal iron kinetics. All animals had normal hematologic values with a mean hemoglobin of 15.6±1.3 g/100 ml (±1 SD), a mean fasting plasma iron (9) of 151±45 jug/100 ml (range 85-239) with a total iron-binding capacity (TIBC) mea-suredwith MgCO3 (10) of 336+46 ig/I100ml, and a leuko-cyte count below 12,000/mm3. After an overnight fast, these animals were injected simultaneously with 'Fe trans-ferrin and "9Fe-damaged red cells (59DRBC) through an ongoing iv. infusion between 11 a.m. and and 12 noon unlessotherwise noted.
To determine the effect of increasing the plasma iron on RE iron kinetics, eight dogs were given an infusion of ferric ammonium citrate to saturate their circulating transferrin. Saturation of the TIBC (325±34 jug/100 ml) was achieved by the initial injection of 370 pg Fe/kg equal to four-times the unsaturated iron-binding capacity of their plasma; this was followed by a continuous in-fusion at a rate of 140 jig Fe/kg/h. The infusion was stopped after 6 h and radioiron was injected as described above. By bleeding 300 ml iron, depletion without anemia was produced in two dogs placed on an iron-deficient diet. Iron deficiency was established by measurements of spleen nonheme iron (11) which were 77 and 192 jug iron/kg body weight in these two animals as compared with a mean of 1,518 jig (range, 464-3,712) in 13 normal dogs. Three other dogs were injected i.v. with 1
lig
endotoxin/kg either4or18 hbeforeinjectionofradioiron.'
Labeled compounds used for injection were prepared in
the following manner. Radioiron was bound to transferrin by incubating fresh dog plasma with 0.8 jiCi/kg 'FeCls (sp act 9 jiCi/ig) which had been mixed with sufficient
4%o sodium citrate to ensure a molar ratio of citrate to iron of 50 to 1. The iron-binding capacity of the plasma
was at least three times the quantity of radioiron added. Nonviable red cells containing hemoglobin labeled with
5"Fe were prepared in dogs as follows. A dog was injected
repeatedly over a 3-mo interval with intravenous '9Fe citrate in amounts sufficient to maintain a circulating
ac-tivity between 8 and 10
gCi/ml
packed cells. Erythrocytesobtained on the morning of each study were washed three times in saline, resuspended in four times their volume of ACD (4.4 g citric acid, 13.2 g sodium citrate, and 14.7 g
dextrose) and heated to 40.1°C for 11 min. After three additional washings in ACD at room temperature, the DRBC were injected within 30 min. Their disappearance
from the circulation of the recipient animal occurred as a single exponential with a tj of 5.6±2.1 min. Intravascular
hemolysis was monitored after the infusion of these cells by analyzing the 15 min sample of plasma for 'Fe activity. Only 0.75+0.28%o of the activity injected as DRBC was found in the plasma over all iron loads employed. The plasma volume was measured by extrapolated zero time of 'Fe plasmaactivity.
Early RE release was studied according to the following procedure. Each animal was kept quiet by administering
the smallest possible amount of tranquilizer (acepromazine
maleate) and sodium pentobarbital through an ongoing infusion of isotonic dextrose. The total amount of these
drugs was 1.3 and 35 mg/kg, respectively over an 8-h 2Salmonella typhosa, Difco Laboratories, Detroit, Mich.
period. The dogs were also heparinized by injecting 800 IU/kg initially and every 3 h thereafter. After injection
of 'Fe transferrin and "9DRBC, the plasma disappearance rate of 'Fe transferrin was determined from the activity in 1-ml blood samples obtained at 15, 30, 45, 60, 120, 180, 300, and 480 min after injection. Radioactivity of "Fe and "Fe was measured simultaneously by a modification of the
liquid scintillation method of Eakins and Brown (12). Blood 59Fe activity was continuously monitored during the first 6-8 h by extracorporeal circulation of blood through a 15-ft long siliconized polyethylene tube' (ID 0.034 inch)
inserted into the femoral veins through a 19-gauge needle and coiled within the well of an NaI (T1) scintillation counter. Circulation was maintained by a pump' with a flow adjusted to 1 ml/min. The overall capacity of this system was 6 ml of blood two-thirds of which was con-tained within the scintillation well. Activity was recorded at 10-min intervals giving a total of 36-48 points in each experiment. Blood "9Fe activity determined by this extra-corporeal circulation technique was indistinguishable with that obtained by multiple blood sampling. Initial plasma iron levels and TIBC were determined immediately before the injection of the labels. Plasma iron was subsequently measured at 1, 2, 3, 5, and 8 h. The rate of change of the plasma iron during the first 3 h of the study was deter-mined by the slope of the regression line fitted through plasma iron values at 0, 1, 2, and 3 h. Loads of DRBC iron ranging from 10-25
jAg
Fe/kg did not affect the plasma iron level. Higher doses injected into three dogs did in-crease the plasma iron level. The rate of change of plasma iron in these animals was calculated from observed values at each time corrected for the amount of iron derived from DRBC (micrograms DRBC Fe injected times percent '9Fe plasma activity). To determine if the experimental pro-cedure in itself affected the plasma iron concentration dur-ing the 8-h experimental period, measurements over a similar period were made on 12 unanesthetized dogs housed in cages. The degree of variation was similar in the two groups of animals. Previous studies have shown that anes-thesia does not affect the plasma iron level as compared with the injection of saline (13).The calculation of early RE release of iron was based on the rate of clearance of 'Fe transferrin and the re-appearance curve of transferrin "9Fe derived from DRBC (Fig. 1). The fractional plasma iron turnover. rate
(a,
min') was determined by fitting a least-squares regression line to the log of 6'Fe counts plotted against time. If X represented the amount of "9Fe at any time which re-appeared in the plasma (percent of dose injected):dX
=F(t)
-eX,
(1)
where F(t)=rate of entry to the plasma of "Fe released by the RE (percent of dose injected per minute). Values of the reappearance curve of 'Fe, X, and the slope of this curve, dX/dt, were determined at 10-min intervals
through-out the observation period after fitting the observed "9Fe
counts by a least-squares spline routine and a digital com-puter (14). F( t) was calculated from Eq. 1 and integra-tion of F(t) with respect to time then gave a hypothetical
plasma "9Fe radioactivity time curve P(t) which repre-sented the pattern of accumulation of "9Fe in the plasma
3Intramedic, Clay-Adams, Inc., Persippany, N. J.
'Model RL 175, The Holter Company, Division of
Ex-tracorporeal Medical Specialties, Inc., King of Prussia, Pa.
0 0
a,~~~~~~~~~~~~~
a 0a,~~~~~~~~~~~~~~~-
10 10o
0-
0 N.1 0 0 ORateoftFIGURE1Measurement of the early phase of RE~~~~~release
0 0Cumtaa,live
"aFe
oTornsferrin (opFe c rel of
*DROC mar a 0
Hlours Hlours
FIGURE 1 Measurement of the early phase of RE release in a normal dog. On the left is shown the disappearance
curve of 'Fe transferrin (open circles) and the curve of
'D)RBC activity (closed
circles)
measured at 10-mmn in-tervals over an 8-h period. The initial rapid fall in 'RFerepresents the clearance of DRBC while the subsequent reappearance represents 'Fe which has been released to
transferrin by the RE cell. On the right is shown the calculated parameters of RE release of 'Fe as described
in the text. The open circles depict the rate of "nFe entry into the plasma, F ( t), expressed as percent of dose per
minute and multiplied by 100. The closed circles depict the
cumulative 'nFe release, P(t), obtained by integrating F(t)
with respect to time. The accumulative early release was stable after 4 h and represented 50% of the injected dose inthis study.
that would have occurred in the absence of uptake by
tissues. In all studies, F(t) had declined to virtually 0 by 360 min resulting in a plateau of P(t) at that time. The value of P(360) was therefore considered equal to P (00) and taken as the proportion of iron released in the
early phase. After 180 min F(t) could be described by an
exponential curve, the tj of which was used to characterize
the speed of early release (Fig. 1). The mean transit time (TT) of the early radioiron release was defined as the mean time of exit of tracer from the RE minus the mean
time of entrance of tracer into the RE (15), or:
TT d
d
tF(t)dt tedt
TT = - I
cog
co|F(t)dt
|edt
where e is the rate of input of radioactivity in the RE. As DRBC disappear from the circulation according to a
single exponential of slope r, the second term at the right
hand of the equation becomes
h/r.
The lag period was estimated by subtracting the mean release time (release tj X1.44) fromthe TT.The late release was studied by removing 8-10 samples of 1 ml blood during the 2 wk period after isotope
ad-ministration to determine the cumulative incorporation of
'RFe
and'nFe
in the circulating red cell mass (Fig. 2). The late release of 'Fe by the RE was calculated at anytime by the ratio of 'Fe to 'Fe activity (2, 16). Formal proof of this method of calculation is outlined in the Appendix. *When the complement of this ratio (expressed as a percent), was plotted on semilogarithmic paper, late release appeared to be a single exponential curve. After fitting a regression line by least squares, the calculated value of the exponential at the time of reappearance of one-half the final erythrocyte, 'Fe incorporation gave the proportion of radioiron in the late release, whereas the tj
of the exponential was used to characterize the speed of late release.
RESULTS
Ferrokinetic andRE cell kineticparameters observed in normal dogs are listed in Table I. Initial plasma iron levels ranged from 96 to 228 *g/100 ml with a
com-posite mean in 15 studies of 146 ihg/100 ml. During the first 3 h of study, the plasma iron was increasing in seven animals at a rate as high as 14.5 lsg/100 ml/h whereas inthe remaining eight studies, the plasma iron wasfalling at a rate between 1.2 and 12.3
*g/lOO
ml/h. Thetrans-ferrin-bound 'Fe disappearance ti averaged 102 min with a range of62-169. The plasma iron turnoverranged
between 0.56 and 1.00 mg Fe/kg/day with a composite
.0
%jIt 00 0~ .Q DaysFIGURE 2 Measurement of the late phase of RE release in a normal dog. In the upper portion of the figure is plotted the incorporation curves of transferrin 'nFe and
'DRBC into circulating red cells over a 2-wk period. The lower incorporationcurve of`RFe reflects thedelayof radio-iron within RE cells. When the ratio of 'Fe to 'RFe
(middle portion of the figure) is subtracted from 100 and plotted on semilogarithmic coordinates (lower portion of the figure), late release is represented by a single expo-nential curve. The proportion of the injected dose released
in the late phase is obtained by extrapolation of this curve to the half reappearance time of RBC 'Fe while the half time of the curve represents the speed of late release.
TABLE I
RE Cell KineticMeasurementsiWNormalDogs
Early release Laterelease
Pro- RBC RBC Pro- Sum of
Peak por- 55Fe 59Fe por- early
DRBC Initial Plasma Plasma plasma tion incor- incor- tion and
Dog iron plasma iron 55Fe Lag "9Fe early pora- pora- late late
no. load iron change t4 PIT TT phase activity release 4 tion* tion* release t4 release
pg/kg pg/100 ml ;pg/100 min mg/kg! min %of dose min % of dose days %of dose
ml/h day Low dose 1 10.7 119 -12.3 79 0.76 109 60 16.4 34 34 75 58 58 8.3 92 2 10.8 107 -3.3 62 0.77 80 40 20.8 45 28 88 80 43 5.5 88 3 11.2 181 +2.3 168 0.56 99 47 32.5 52 36 71 65 51 4.2 103 4a 11.4 90 +6.1 85 0.57 108 62 32.3 60 32 - - - - -4b1 15.6 191 +14.5 144 0.56 121 79 43.6 66 29 - - - - -5 14.6 228 -7.6 126 0.89 88 60 27.9 50 20 96 78 47 9.5 97 6 15.7 138 -3.8 91 0.80 101 55 17.2 42 32 87 83 54 9.4 96 7 15.9 133 -7.8 81 0.91 94 40 15.9 31 38 - - - - -Mean 13.2 148 -1.5 105 0.73 100 55 25.8 48 31 83 73 51 7.4 95 SEM 0.9 17 3.1 13 0.05 5 5 3.5 4 2 5 5 3 1.1 3 Intermediatedose 8 20.8 110 -7.5 66 0.95 100 45 15.1 36 38 69 59 53 7.0 89 9 21.0 130 -9.5 90 0.86 126 61 12.9 33 45 85 72 62 8.5 95 lOa 22.1 96 -1.2 72 0.69 120 68 18.2 47 36 - - - - -10b 22.7 119 +10.8 76 0.74 112 43 28.0 66 48 - - - - -11 30.0 191 +6.7 108 1.00 105 65 30.9 56 28 87 83 38 6.0 94 Mean 23.3 129 -0.1 82 0.85 113 56 21.0 48 39 80 71 51 7.2 93 SEM 1.7 16 3.9 8 0.06 5 5 3.6 6 4 6 7 7 0.7 2 High dose 12 86.0 176 +0.9 108 0.73 108 58 29.6 55 35 82 75 42 4.6 97 13 116.0 185 +6.2 169 0.60 113 73 40.6 65 28 67 65 36 7.3 101 Composite Mean 28.3 146 -0.4 102 0.76 106 57 26.1 49 34 81 72 48 7.0 95 SEM 7.9 11 2.1 9 0.04 3 3 2.6 3 2 3 3 3 0.6 2 *At15days.
tRepeatstudyperformedat4a.m. 12hafter firststudy.
mean of
0.76.
The red cellincorporation
of'Fe
at2 wkaveraged
81%,
a value almost identical to that observed innormalman(17).
RE kinetics was measured in eight studies after. a
minimaldose of
damaged
cellsranging
from 11 to 16ig
Fe/kg body weight (Table
I).
Analysis
of earlyre-leasecurvesindicated acell TT of 100 min
ranging
from 80 to 121. This wascomposed
of a lag phaseof 55 minfollowed
by
anexponential discharge
ofradioactivity
witha tiof 31 min.Early
releaserepresented
from 31 to66%
of the WDRBCactivity
with a mean of 48%.Analysis
of theerythrocyte incorporation
curves of'Fe
and'Fe
for late release indicated a mean appearance tiof
7.4
days
in this same group ofdogs.
In each study,good
agreementv~as
observed betweenearly
release of radioiron calculated from the immediateplasma
reap-pearance of'Fe
and late release determined from theaccumulative
incorporation
of radioiron into thecir-culating
red cell mass.Thus,
addition of the early andlate releases calculated
independently
accounted for anaverage of
95% (range 88-103)
ofactivity
injected
as DRBC. At the end of 2 wk, an average of12%
of theadministered
'Fe
activity
was still present in the RE cells as determinedby
the ratio of RBCincorporation
'Fe/'Fe
(73/83
=88%
released). Experiments
car-riedoutover
longer periods
of timeshowedthatvirtually
all of the iron had left the RE cellafter 3-4 wk.Additional
studies were carried out to determine thepattern of RE
kinetics
withhigher
loads of DRBC iron.Five studies were
performed
with an intermediate dose(20-30
mgFe/kg)
while two studies were performedwith loads of 86 and 116
sg
Fe/kg (Table I).
Nochanges
in any of the parameters ofearly
or latephasesof RE iron release were observed with higher dosage. Thus the kinetics pattern of RE cell iron transport in
respect to DRBC did not appear dose dependent within
a 10-foldrange.
To examine the
relationship
between RE release andplasma
iron,
thecorrelation ofplasma
iron concentration with thelag phase,
TT,
and the ti of early and latere-1530
G.Fillet,
J.
D.Cook,
and C. A. Finchlease was examined and in no instance was a significant
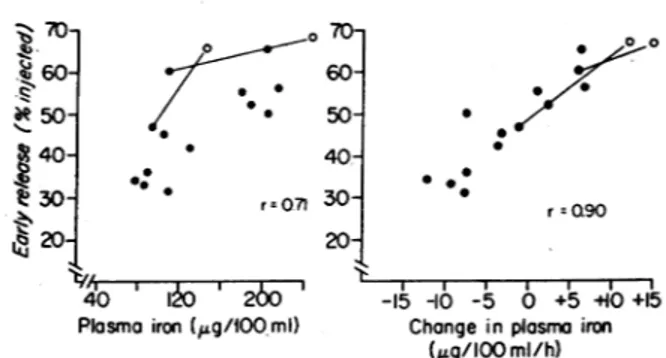
correlation observed (P < 0.1). Whilenocorrelation was observed between the proportion of early release and the
initial plasma iron level (r=0.41, P>0.1), a
signifi-cant positive correlation was observed with the plasma iron level measured 3 h after the injection of the la-bels (80-230
og/100
ml) (Fig. 3). In these same ani-mals, when the rate of change of plasma iron during thefirst 3 h of study was used, an even better correlation with theproportion ofearly release was observed (Fig.
3). This relationship was further examined in two dogs by repeating the initial study 12 h later when an ap-preciable change had occurred in the plasma iron level. The alteration in early release relative to the rate of change of plasma iron in these serial studies was con-sistent with the relationship observed in randomly se-lected normal dogs. It would therefore appear that diur-nal variations in plasma ironconcentration are explained by differences in the partitioning of iron between early and late phases of RE iron release.
To determine whether the degree of transferrin satura-tion influenced iron transport by the RE cell, eight dogs
were infused with ferric ammonium citrate before study to saturate plasma transferrin. Proportioning of iron be-tween the early and late release phases was determined from the RBC incorporation curves of 'Fe and 'Fe after
injection of
12±3 pg/kg
DRBC and was compared with thatobtained in eight control dogs given the same loadof DRBC. The mean plasma iron at the time of injec-tion was
148±47
uig/100 ml in controls as compared to309±35 ug/1OO
ml in the iron-loaded animals. In the latter group 3 h after injection, the mean plasma iron was297±32
ug/100 ml and the transferrin saturation greater than 90%. In the animals with saturatedtrans-ferrin, the proportion of late RE release was
62.8±9.2%
as compared with
50.7±7.8%
in control animals. Thus,despiteatwofold increase in plasma iron, there was only
a 12% increase in the late release fraction (t=2.84, P <0.02). The ti of late release in the study was -similar in the treated and control animals.
Theeffect of acute inflammation on RE iron transport
was studied in three dogs. Endotoxin injected i.v. re-sulted in a rapid fall in the plasma iron to less than 50
ihg/100
ml within a few hours and with a gradual returnto normal by the following day. In two animals,
'Fe
transferrin and WDRBC were injected 4 h after
endo-toxin
administration
at which time the plasma iron wasdecreasing at a rate of 16 and 20
og/100
ml/h. The ticlearance of the'DRBCwas increased to23 and35min.
No plasma wFe reappearance curve was detectable. The proportion of late release as determined by erythrocyte incorporation curves was 91 and 92% with late release ti of 11.2 and5days, respectively. In athird dog, DRBC
were given 18 h after endotoxin at a time when the
0 60 . 8140 30- * .=071 K 20 4P0 200m '
Plosmo iron
(,~g/lOlml)
70-60 50- 40- 30- 20-0 0 0 o 0 0.0 r=Q90 I I -15 -10 -5 0 +5+10+15 Changeinplasmairon(/ig/1O0
ml/h)FIGuRE3 Relationship between the percent of the injected dose of 'DRBC released in the early phase and either the
plasma iron level 3 h after injection (left) or the rate of change in plasma iron during the first 3 h of
study
(right).
A significantly better correlation was observed when early release is related to the rate of change in plasma iron (P<0.001) than to the level of plasma iron (P < 0.01).
The open circles represent studies repeated in the same dog 12 haftertheinitial study.
plasma iron was increased towards normal at a rate of 10
jig/1Q0
ml/h. The late release phase in thisstudy
represented only
40%
of theinjected activity.
A further two studies were
performed
in dogs with iron stores reduced by priorphlebotomy.
Theplasma
iron at the time of the study was 70 and 80Aig/100
ml. Late release in these animals accounted for only 7 and 10%of theinjectedactivityrespectively.DISCUSSION
In the present study, small amounts of
heat-damaged
erythrocytes have been used to evaluate iron
processing
by the RE. The lowest doses of
injected
cellsprovided
inthe range of 10
jig
Fe/kg.
Because the mean clearanceti of the DRBC was 6 min, the rate of iron
input
into the RE was about four times the normal rate of senes-cent red cell destruction in dogs based on a mean lifespanof 100 days
(18,
19)
anda blood volume of 90ml/
kg
(20).
Despitethefact that the normal rateof erythro-cyte iron turnover was exceeded, a more than 10-foldincrease of the iron load to above 100
Ag/kg
produced
noapparent difference in the pattern of
early
or latere-lease of iron by the RE. It may therefore be assumed
that the kinetic pattern obtained in this-
study
does notsignificantly
differ from those obtained under conditions of normalphysiologic
loading of the RE.The experimental approach employed
provides
arela-tively simple and yet precise means of characterizing
iron transport bythe RE. From analysis of kinetic
data,
a model of iron transportby the RE may beconstructed along the following lines. There is an initial-processing
period
or lag phase,presumably
required for red cellphagocytosis and heme catabolism. Iron freed from hemoglobin then enters a labile
pool
from which it is either promptly returned to circulating transferrin withati of 34 min oris transferredto a moreslowly exchang-ing pool within the RE which releases its iron with a ti of 7 days. These twodistinct phases of releaseaccount
for the entire exchange of iron between the RE and
circulating plasma. A sudden increase in the inputof red cell iron to the RE in amounts ranging from 4 to 40
times basal input produces no change in the proportion of iron released in the early or late phases. This does
mean, however, that the immediate output of iron from
the RE is a function of theamount of iron entering the
RE over a relatively wide range.
The study reported here has also demonstrated an
intrinsic mechanism within theRE formodifying plasma iron supply by modifying the relative amount of iron entering the early and late release phases. The high de-gree of correlation between rate of plasma iron change and early release as compared with the negligible effect of change in plasma iron level by iron injection indi-cated that the RE cell was responsible for changes in plasma iron rather than the converse. Thus diurnal vari-ation in plasma iron could be attributed to variations in the proportion of iron immediately released by the RE
cell. Considering that about 80% of the iron leaving the plasma re-enters this pool through the RE (21), it can be calculated that two-thirds of the fluctuations in the plasma iron level under normal conditions are due
to variations in early REoutput.'
It has also been demonstrated that there exists little
or no immediate feedback control of RE output by the levelof the plasma iron. Thus increasing the plasma iron
by continuous perfusion of ferric ammonium citrate had little effect on the proportion of iron between the early and late release phases. Only 12% more iron was re-tained in RE stores despite near complete saturation of transferrin during 6 h. This finding is at variance with a previous study in rats (2) where a single injec-tion of 100 Ag nitrilotriacetic acid iron 3 h before
in-jection of WDRBC was found to markedly depress the
immediate release of RE iron and to proportionately in-creasetheradioironincorporation into ferritin. However,
5In two dogs on whom two studies were carried out at
different times of the day, the total iron inflow into the plasma at each time was calculated by adding the plasma iron change (micrograms per hour) to the plasma iron turnover (PIT) (micrograms per hour). The iron flow through the early RE release phase was obtained by
mul-tiplying
80%o
of the PIT by the proportion of radioironearly released. In those two dogs, the change in RE early outflow amounted respectively to 61 and
67%o
of the change in total inflow into the plasma.In 13 randomly selected dogs having a mean PIT of 62
Ag/100
ml plasma/h, a mean change in plasma iron of 10,ug/100 ml/h was associated with a mean change in the early RE release of 15.3% (Fig. 3). Estimating a total flow through the RE of 50
gg/100
ml plasma/h, 75% ofthe fluctuations in the plasma iron level are due to varia-tions intheearly RE output.
a direct tissue uptake of nitrilotriacetic acid may have influenced the results ofthese studies.
In addition to these physiologic responses, the RE cell handling of iron appears to be markedly altered in certain pathologic states. After reduction in body iron
stores by prior phlebotomy, almost all the iron entering
the RE cell was released inthe early phase. The reverse
phenomenon was observed after endotoxin-induced acute
inflammation. These observations indicate that the RE
system may change its early output from 10 to 90% of the iron entering the cell and in that way determine the availability of iron for erythropoiesis.
It is clear that alternate pathways exist within the RE cell and that changes between them occur which result in alterations in the flow of iron. Such changes may
occur independent of erythron needs, and both diurnal changes andthose withinflammationseem tobeexamples of this. However, there are other reasons to believe that flow is regulated according to marrow needs. The phle-botomized animal responds by the early release of vir-tually all catabolized iron, and in hemolytic anemia the
amount of iron passing through the plasma is increased
to four to five times normal with very little change in plasma iron concentration. Whereas the present study
casts little light on how this adaptation occurs, the method described of quantitating RE behavior should
permit further characterization of this phenomenon. APPENDIX
Let Ri(t), Pi(t), and Es(t) be respectively the amount of radioiron in the RE, the plasma and the erythron, i representing either 'Fe or 5'Fe. In the simplest case,
con-sider the time course of activity in the RE and the plasma
as asingleexponentialcurve:
R59(t) = eat, P55 (t) = e-at.
(1)
(2)
Assuming that all the iron leaving the RE enters the plasma, the exchange of 'Fe between the RE and the plasma is characterized by the differential equation:dP59(t) =
,'R59
(t) -aPs9
(t).
dt (3)
Solution of Eq. 3 for the case where P!, (0) =0 gives:
P59(t) = 0
(emit
-emit)
(3-a
(4)
The time course of radioiron activity in the erythron can be described by the following equation (22):
Jt
Ei
(t)-=
K Pi(t)dt,
(5)where K is the rate constant from the plasma to the
erythron. If RA (t) represents the ratio of rFe to 'Fe
activities in the erythron, substituting Eqs. 4 and 2 in Eq.
1532
G.Fillet,
J. D.Cook,
and
C. A.Finch
5 gives:
E59
(t)
a_(3-/ea(1 -Ess(t) 13-a ( (11-ea)/Consider now that the order of magnitude of a and p are respectively 10 and 10'day-'. In Eq. 6 we have:
(3A
_
13
P-a a
and
1 - emi- 1 (fort 1, e-10 - 1t0-5) Eq.6 may bewritten:
RA(t) -' +
(1-exflt),
a
,8/a being negligible compared with (1 - eve), then:
RA(t) -- 1 -e = 1- R59(t).
Computations of Eq. 6 for various values of a and p have shown the validity of the above approximations. After 24h, the ratio is practically independent of the plasma radioiron
disappearance rate for tj ranging from 40 to 400 min, and it provides a measurement of the amount of 'Fe released by the RE with an error less than 1%.
In a more general case, when Rro(t)=2A;,e~" (where =1), it can be similarly demonstrated that: RA (t) =1-R59 (t) (t > I day).
ACKNOWLEDGMENTS
We gratefully acknowledge the technical assistance of Mary Eng, Marie Mulleda, Sunday Hill, and Paul Davis.
This work was supported by research grant HL-06242,
training grant AM-05130, and Fogarty International
Fel-lowship grant F05 TW 1782 from the National Institutes ofHealth.
REFERENCES
1. Noyes, W. D., T. H. Bothwell, and C. A. Finch. 1960. The role of the reticulo-endothelial cell in iron
metabo-lism.Br. J. Haematol. 6:43.
2. Lipschitz, D. A., M. 0. Simon, S. R. Lynch, J.
Du-gard, T. H. Bothwell, and R. W. Charlton. 1971. Some factors affecting the release of iron from reticuloen-dothelialcells. Br. J. Haematol.21:289.
3. Barry, W. E., R. Tallarida, and B. F. Rusy. 1968. Ki-netics of release of iron from reticuloendothelial sys-tem. RES J. Reticuloendothel. Soc. 5: 412.
4. Najean, Y., C. Dresch, and M. Boulard. 1970. Regula-tion of the iron transport compartment. In Iron
De-ficiency. Pathogenesis, Clinical Aspects, Therapy. L.
Hallberg, H.-G. Harwerth, and A. Vannotti, editors. Academic Press, Inc.,NewYork. 21.
5. Hershko, C., J. D. Cook, and C. A. Finch. 1972. Storage
iron kinetics. II. The uptake of hemoglobin iron by hepatic parenchymal cells. J. Lab. Clin. Med. 80: 624.
6. Bissell, D. M., L. Hammaker, and R. Schmid. 1972. Hemoglobin and erythrocyte catabolism in rat liver:
the separate roles of parenchymal and sinusoidal cells.
Blood. 40: 812.
7. Freireich, E. J., A. Miller, C. P. Emerson, and J. F.
Ross. 1957. The effect of inflammation on the utilization
of erythrocyte and transferrin bound radioiron for red cell production. Blood. 12: 972.
8. Finch, C.A., M. Hegsted, T. D. Kinney, E. D. Thomas, C. E. Rath, D. Haskins, S. Finch, and R. G. Fluharty.
1950. Iron metabolism. The pathophysiology of iron storage.Blood.5:983.
9. International Committee for Standardization in Hema-tology: Proposed recommendations for measurement of serum iron in human blood. 1971. Br. J. Haematol. 20: 451.
10. Cook, J. D. 1970. An evaluation of adsorption methods for measurement of plasma iron-binding capacity. J. Lab. Clin.Med. 76:497.
11. Torrance, J. D., and T. H. Bothwell. 1968. A simple technique for measuring storage iron concentrations in
formalinized liver samples. S. Afr. J. Med. Sci. 33: 9.
12. Eakins, J. D., and D. A. Brown. 1966. An improved
method for the simultaneous determination of iron-55
and iron-59 in blood by liquid scintillation counting.
Int. J. Appl. Radiat. Isot. 17: 391.
13. Cartwright, G. E., L. D. Hamilton, C. J. Gubler, N. M. Fellows, H. Ashenbrucker, and M. M. Wintrobe. 1951.
The anemia of infection. XIII. Studies on
experimen-tally produced acute hypoferremia in dogs and the re-lationship of the adrenal cortex to hypoferremia. J.
Clin.Invest. 30: 161.
14. Marsaglia, G. 1971. Optimal representation of proba-bility density functions. Proc. Lenin Acad. Agr. Sci. USSR. 337.
15. Perl, W., and F. P. Chinard. 1969. Occupancy prin-ciple: nonidentity with mean transit time. Science (Wash.D.C.). 166: 260.
16. Beamish, M. R., A. G. Davies, J. D. Eakins, A. Jacobs,
and D. Trevett. 1971. The measurement of reticulo-endothelial iron release using iron-dextran. Br. J. Haematol. 21: 617.
17. Finch, C. A., K. Deubelbeiss, J. D. Cook, J. W.
Esch-bach, L. A. Harker, D. D. Funk, G. Marsaglia, R. S.
Hillman, S. Slichter, J. W. Adamson, A. Ganzoni, and E. R. Giblett. 1970. Ferrokinetics in man. Medicine
(Baltimore). 49: 17.
18. Brown, I. W., Jr., and G. S. Eadie. 1953. An analytical
study of in vivo survival of limited populations of animal red blood cells tagged with radioiron. J. Gen. Physiol.36: 327.
19. Finch, C. A., J. A. Wolff, C. E. Rath, and R. G. Fluharty. 1949. Iron metabolism. Erythrocyte iron turn-over. J. Lab.Clin.Med. 34: 1480.
20. Reeve, E. B., M. I. Gregersen, T. H. Allen, and H. Sear. 1953. Distribution of cells and plasma in the normal and splenectomized dog and its influence on blood volume estimates with P' and T-1824. Am. J.
Physiol. 175: 195.
21. Cook, J. D.,G. Marsaglia, J. W. Eschbach, D. D. Funk,
and C. A. Finch. 1970. Ferrokinetics: a biologic model for plasma iron exchange in man. J. Clin. Invest. 49:
197.
22. Fillet, G. 1971. The ferrokinetic measurement of mar-row cellularity. Method using a marrow cell-erythroid radioiron ratio. In Platelet Kinetics. Radioisotopic,
Cy-tological, Mathematical and Clinical Aspects. J. M. Paulus, editor. American Elsivier Publishing Co., Inc., New York. 166.