This is an author-deposited version published in: http://oatao.univ-toulouse.fr/ Eprints ID: 3258
To link to this article: DOI:10.1016/j.desal.2008.12.047
URL: http://dx.doi.org/10.1016/j.desal.2008.12.047
To cite this version: Bessiere, Yolaine and Jefferson, Bruce and Goslan, Emma and Bacchin, Patrice (2009) Effect of hydrophilic / hydrophobic fractions of Natural Organic Matter on irreversible fouling of membranes. Desalination, vol. 249 (n° 1). pp. 182-187. ISSN 0011-9164
O
pen
A
rchive
T
oulouse
A
rchive
O
uverte (
OATAO
)
OATAO is an open access repository that collects the work of Toulouse researchers and makes it freely available over the web where possible.
Any correspondence concerning this service should be sent to the repository administrator: staff-oatao@inp-toulouse.fr
Effect of hydrophilic / hydrophobic fractions of Natural Organic Matter on irreversible fouling of membranes
Y. Bessiere1, B. Jefferson2, E. Goslan2, P. Bacchin1,*
1
Laboratoire de Génie Chimique, Université Paul Sabatier, 31062 Toulouse cedex 9, France
2
Centre for Water Science, Cranfield University, SAS, Cranfield MK43 OAL, Bedfordshire, UK
* Corresponding author: bacchin@chimie.ups-tlse.fr, Tel: (33) 5 61 55 81 63, Fax: (33) 5 61 55 61 39
Abstract:
Natural organic matter (NOM) has been identified as a major factor affecting membrane processes performances, but its impact is difficult to quantify from global parameters such as organic carbon content. The extent of fouling due to the different fractions of NOM from surface water has been examined in dead-end ultrafiltration using criteria such as flux decline and irreversibility in regard with organic matter rejection. The most important flux decline was observed during the filtration of the hydrophilic acids fraction whereas fulvic acids led to the most irreversible fouling. Furthermore, the hydrophilic fraction lost its fouling character when mixed with other fractions underlining that interactions between numerous components are possibly more important than the composition itself.
Keywords: ultrafiltration, natural organic matter, irreversible fouling, water treatment, membrane
1. Introduction
The last fifteen years have seen the expansion of membrane processes in water treatment applications. Although the efficiency of membrane processes has been widely reported (Arnal et al., 2004; Bodzek and Konieczny, 1998; Di Zio et al., 2005; Madaeni, 1999), limitations still exist due to the accumulation of material at the surface of the filter known as fouling.
Fouling is most commonly experienced as an increase in transmembrane pressure over time at constant flux requiring either backwashing or chemical cleaning to remove accumulated material.
Since the arrival of membrane processes, many studies have been conducted in order to improve the knowledge about phenomena responsible for fouling with different and complementary ambitions:
- to anticipate and control it by adjusting the process parameters (Crozes et al., 1997; Espinasse et al., 2002)
- to be able to predict filtration performances (Boerlage et al., 2003; Ghidossi et al., 2006; Park et al., 2006; Peng et al., 2004)
- to identify “critical fractions” of water in order to ensure their removal before the membrane filtration by a suitable pre-treatment (Koh et al., 2006; Lin et al., 2001; Mosqueda-Jimenez and Huck, 2006).
Natural organic matter (NOM), which is omnipresent in surface water, is of interest in most of the studies due to its complexity increasing the multiplicity of mechanisms involved during surface water treatment. Although decline of flux is systematically observed in water treatment, the origin and mechanisms of fouling are still difficult to identify and quantify. Fouling by NOM depends, besides hydrodynamic conditions, on characteristics of feed water as well as of membrane surface. Thus some studies evaluated the influence of the hydrophilic character of NOM on fouling: in a general way, humic substances generate a more important fouling than fulvic acids (Aoustin et al., 2001; Jucker and Clark, 1994; Schafer, 1999; Schafer et al., 2000) explained by their low solubility and their hydrophobic character. Lin et al. (2000) identified a more important decline of flux when filtering the hydrophilic fraction on
polysulfone ultrafiltration membrane, despite little rejection. On the other hand the hydrophilic fraction has some times been identified as less limiting (Cho et al., 2000).
Furthermore, it is also important to know the impact of fouling on the process and to evaluate the reversibility of fouling layers. The increasing degree of irreversibility will lead to a rise in operating costs and environment impacts which are important to anticipate: reversible fouling can be removed by rinsing steps (Bessiere, 2005), low irreversible fouling implied the necessity to process backwashes whereas high irreversible matter accumulation can only be removed by chemical cleanings.
The aim of this paper is to further investigate the impact of the different NOM fractions on flux decline and on the appearance of irreversible fouling during dead-end ultrafiltration. To do that, water is fractionated using resins and the effect of each fraction is discussed with regard to their impact during dead-end filtration.
2. Materials and methods 2.1. Fractionation
The raw water investigated in the current study was sampled from Albert Water Treatment Works (AWTW), a moorland water works in the north of England, situated in Halifax. The water source is typical of a NOM rich water which is characterised as having low turbidity (2.0-7.0 NTU), low alkalinity (20 mg.L-1 CaCO3), high colour (44-160 Hazens) and high
dissolved organic carbon (DOC) (6.6-13.3 mg.L-1).
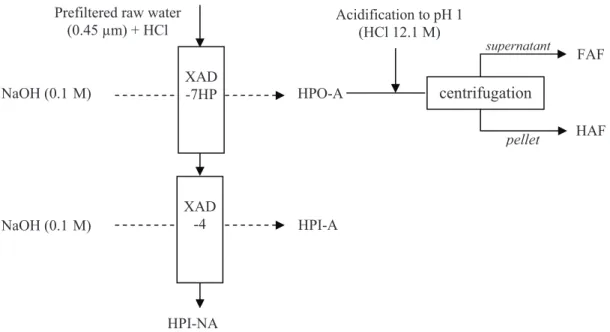
The separation process and the hydrophilic / hydrophobic balance determination are undertaken using resins Amberlite XAD-7HP and XAD-4 successively (Rohm and Haas, Germany).
This method (Fig. 1) leads to separation of dissolved organic matter into four different fractions (Malcolm and MacCarthy, 1992):
XAD -7HP
XAD -4 Prefiltered raw water
(0.45 µm) + HCl HPO-A HPI-NA HPI-A HAF pellet supernatant centrifugation Acidification to pH 1 (HCl 12.1 M) FAF NaOH (0.1 M) NaOH (0.1 M)
Fig. 1: Schematic of the procedure of fractionation
! Hydrophobic acid (HPO-A) adsorbed on resin XAD-7HP at pH 2 (and desorbed with NaOH 0.1M). This fraction consists of humic substances themselves made of fulvic acids (FAF) and humic acids (HAF) separated by centrifugation after acidification.
! Hydrophilic acid substances (HPI-A) adsorbed on resin XAD-4 at pH 2 (and desorbed by NaOH)
! Non-adsorbed hydrophilic substances (HPI-NA) which are recovered in the permeate of XAD-4.
The proportion of each fraction in the raw water is determined by analysis of Dissolved Organic Carbon (DOC) on Shimadzu TOC Analyser 5000A (Milton Keynes, UK) - defined as
the organic carbon that pass through a 0.45µm filter - with respect to the DOC of the raw water (RW): µm µm RW RW fraction fraction V DOC V DOC fraction 45 . 0 45 . 0 100 % " " " #
2.2. High-performance size-exclusion chromatography (HPSEC)
The HPSEC analysis were carried using an HPLC (Shimadzu VP series, Shimadzu, Milton Keynes, UK) with a UV detection set to 254 nm. The column was a TSK – gel G3000SW 7.5 mm (ID) *30 cm and the guard column was a TSK gel 7.5 mm (ID) * 7.5 cm (Tosh Biosep GmbH, Stuttgart, Germany). The mobile phase was 0.01 M sodium acetate at a flow rate of 1 ml min-1. With HPSEC, large molecules are eluted from the column first and smaller molecules after.
2.3. Filtration device
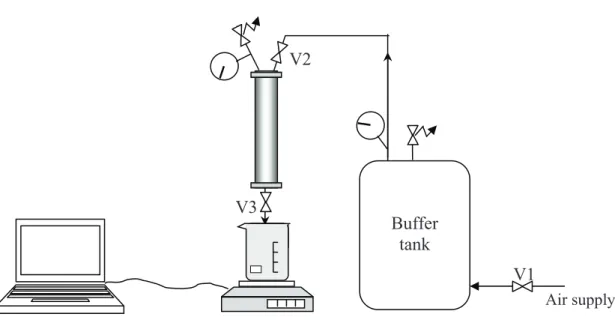
The filtration experiments were carried out with a bench scale unit (fig. 2) with ultrafiltration membranes made of polysulfone having a low molecular weight cut off (100 kDa). This device is made up of a 200 mL filtration cell (KST47, Advantec MFS, Dublin, USA) receiving a flat sheet membrane of 47 mm in diameter corresponding then to a filtration surface of 12.5 cm2.
The pressure was kept constant by the way of a 50 L buffer tank supplied by pressurised air. The permeate was collected in a vessel located on an electronic balance and the cumulated mass was recorded with a 5 s frequency via the software Regkey.
Buffer tank V1 V2 V3 Air supply
Fig. 2: Schematic of the filtration bench scale unit
2.3. Processing
The fouling was evaluated by considering its extent during filtration with regard to its irreversibility as this point is considered as the key parameter to allow a suitable way to run water production (by adjusting hydraulic actions frequencies to take off fouling layers). So the experiment was sequenced in two main parts:
! A filtration step: the cell is filled with the raw water or the fraction being considered, the required pressure (here 1 bar) is adjusted via the valve V1 and the filtration started while opening the valve V3. The filtration was run until 190 mL of permeate was collected.
! A rinsing phase: the remaining suspension was removed and the cell carefully rinsed three successive times with ultrapure water in order to remove all the matter not irreversibly accumulated at the membrane surface (or in the pores). This step allows determination of the instantaneous irreversibility of fouling. This step has also been
done after a 24 h soaking in ultrapure water at 4°C in order to evaluate the long term irreversible fouling.
The permeate flux is linked to the transmembrane pressure ($P) and the additional resistance due to fouling (Rf) through Darcy’s law (Darcy, 1856):
%
Rm Rf&
P J ' " $ # (where µ is the viscosity at the experiment temperature and Rm is the clean membrane
hydraulic resistance (here 7.5 × 10¹¹ m-1 as mean value).
3. Results
3.1. Water characterisation
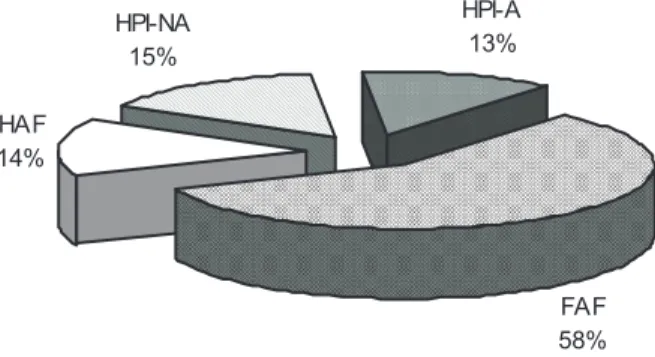
The distribution of natural organic matter in terms of DOC is reported in figure 3: humic substances (HAF and FAF), i.e. hydrophobic compounds, account for 72% of NOM, with a predominance of fulvic acids (58%). The two hydrophilic fractions (HPI-A and HPI-NA) are in equivalent quantities (13% and 15% respectively).
HAF 14% HPI-NA 15% HPI-A 13% FAF 58%
Fig. 3: Natural organic matter distribution
The observed distribution between hydrophilic and hydrophobic compounds is noticeably different of values reported in the literature which often presents equivalent quantities for surface waters (Aouabed et al., 2001; Martin-Mousset et al., 1997).
During filtration experiments, size of compounds is expected to play an important part in mechanisms involved and so on fouling (Fan et al., 2001; Lin et al., 1999). The raw water
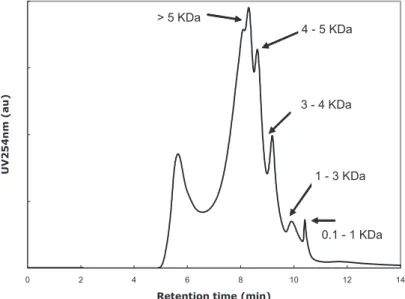
HPSEC (High-performance size-exclusion chromatography) analysis, presented in figure 4, revealed six size peaks where the most abundant peak is > 5 kDa. The size band attributed to each peak was determined using a method described by (Matilainen, 2007).
The relative size of fractions has also been estimated (fig. 5). Those results underline that the HPI-A fraction is made of the smallest compounds whereas HAF presents the upper molecular size.
0 2 4 6 8 10 12 14
Retention time (min)
U V 2 5 4 n m ( a u ) > 5 KDa 0.1 - 1 KDa 1 - 3 KDa 3 - 4 KDa 4 - 5 KDa
Fig. 4: HPSEC chromatogram of raw water
0 2 4 6 8 10 12 14
Retention time (min)
U V 2 5 4 n m ( a u ) FAF HAF HPI-A
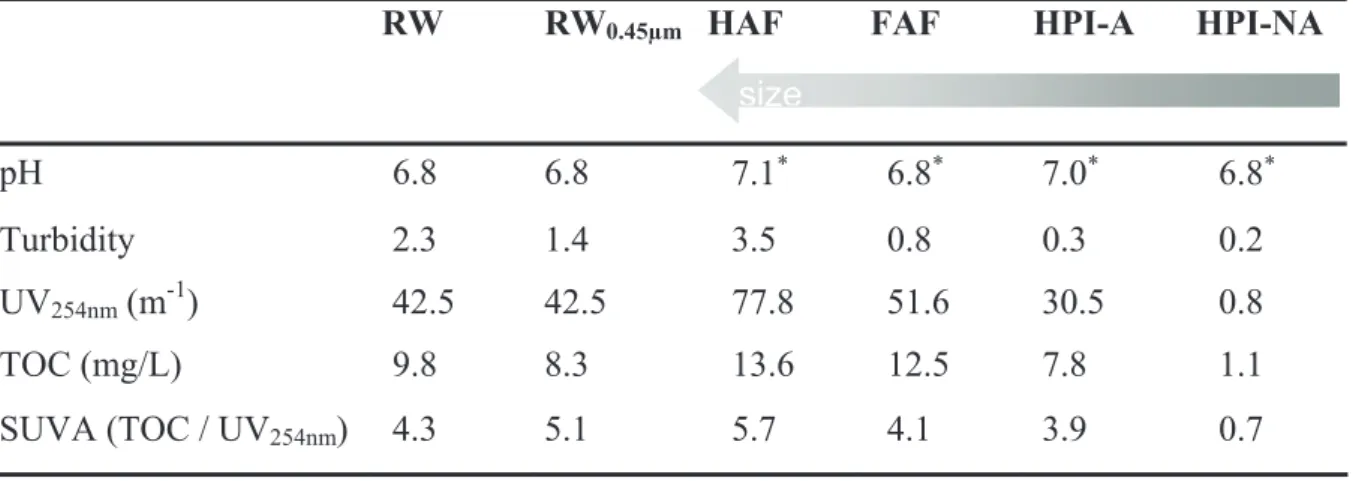
The parameters of each fraction or water undertaken for filtration experiments are reported in table 1.
Table 1: Characteristics of raw water and fractions before filtration
RW RW0.45µm HAF FAF HPI-A HPI-NA
pH 6.8 6.8 7.1) 6.8) 7.0) 6.8) Turbidity 2.3 1.4 3.5 0.8 0.3 0.2 UV254nm (m-1) 42.5 42.5 77.8 51.6 30.5 0.8 TOC (mg/L) 9.8 8.3 13.6 12.5 7.8 1.1 SUVA (TOC / UV254nm) 4.3 5.1 5.7 4.1 3.9 0.7 size )
pH adjusted with NaOH 0.1 M
High values in organic carbon and UV absorption at 254 nm reveals an important organic matter contents; furthermore, the Specific UV Absorbance (SUVA) representing the aromatics components (Edzwald and Tobiason, 1999) is particularly high.
3.2. Filtrations
The extent of fouling with time was evaluated through the evolution of flux versus filtered volume, Vf, during dead-end filtration run at 1 bar. In order to strictly compare fouling by raw water and by the different fractions and thus to disregard the slight differences in concentration, results (relative flux J/J0 or fouling resistance Rf) are reported versus the
organic matter which reached the membrane surface (TOC*filtered volume/surface) as shown in figure 6 a) and b) for relative flux and fouling resistance respectively.
Results clearly underline that HPI-A compounds (adsorbed on XAD-4 resin) lead to the most important decline of flux, leading even to a complete blocking of the membrane. This
complete blocking here appears after a filtration time of 33 minutes corresponding to a filtered volume of 80 L.m-2. Humic acids generate more fouling than raw water whereas fulvic acids lead to the lowest decline of flux.
The impact of fouling generated by HPI-NA fraction, underlined in the past (Fan et al., 2001; Lee et al., 2004), is here difficult to evaluate (Rf < 5 × 10¹⁰ m-1) as its concentration in
organic carbon resulting from the fractionation procedure is low.
0.0E+00 1.0E+12 2.0E+12 3.0E+12 4.0E+12 5.0E+12 0 0.5 1 1.5 2 2.5 g organic carbon / m2 Rf (m -1 ) raw water HAF FAF HPI-A HPI-NA 0.0 0.2 0.4 0.6 0.8 1.0 1.2 0 0.5 1 1.5 2 2.5 g organic carbon / m2 J /J0 raw water HAF FAF HPI-A HPI-NA
Fig. 6: Specific flux versus accumulated mass for the different fractions
For the same quantity of organic carbon reaching the membrane surface, the fouling resistance can be very different (Table 2) according to the NOM fraction considered: a difference of a factor of 10 is observed between the FA and HPI-A fractions for example.
Table 2: Fouling resistance (Rf) after filtration of 0.5 g organic carbon .m-2
Fraction Rf (m-1)
Raw water 4.1 × 10¹¹
HAF 7.5 × 10¹¹
FAF 2.3 × 10¹¹
A surprising observation is that a part of the natural organic matter of the raw water can exhibit propensity to fouling well above that obtained for raw water. To check such a trend was remaining in presence of other fractions, water has been restored by mixing all the fractions within the proportions shown in figure 3.
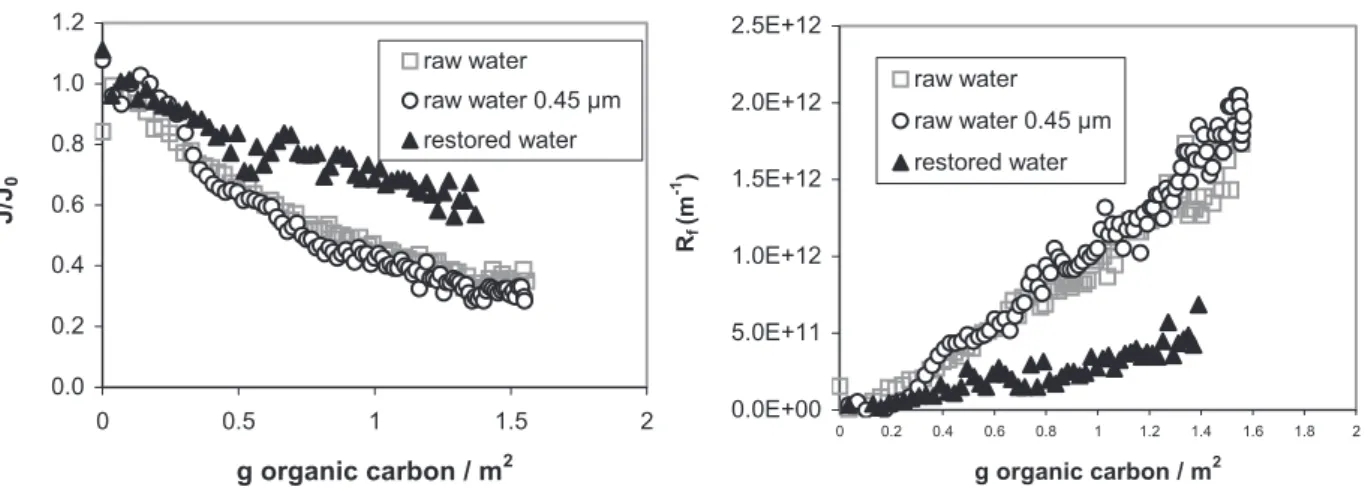
Fouling resulting from the filtration of this restored water is compared to the one induced by the raw water and the prefiltered raw water (fractionation procedure is made on 0.45 µm filtered water as shown in figure 1). The evolution of relative flux and fouling resistance for those three suspensions are reported in figure 7.
0.0 0.2 0.4 0.6 0.8 1.0 1.2 0 0.5 1 1.5 2 g organic carbon / m2 J /J0 raw water raw water 0.45 µm restored water 0.0E+00 5.0E+11 1.0E+12 1.5E+12 2.0E+12 2.5E+12 0 0.2 0.4 0.6 0.8 1 1.2 1.4 1.6 1.8 2 g organic carbon / m2 Rf (m -1 ) raw water raw water 0.45 µm restored water
Fig. 7: Comparison of fouling by raw water, prefiltered raw water and restored water Firstly, raw water and prefiltered raw water present the same decline of flux (up to 70%) – at least for the duration of our experiments – which confirms the impact of dissolved and colloidal material on membrane fouling.
Then, the restored water appeared to be less limiting than the initial raw water. This point can be explained by two aspects possibly simultaneous: the restored water presents some differences in overall characteristics: turbidity is 1.1 NTU, DOC 8.56 mg.L-1 and absorption at 254 nm, 36 m-1 underlining that some of the material is possibly lost during the fractionation procedure. The second hypothesis concerns the likely modifications of structure because of the change in pH during the fractionation.
Similar fouling experiments performed in previous studies (Jarusutthirak et al., 2002) have shown flux reduction around 20 % and 30 % (i.e. relative flux between 70 % and 80 %) after filtration of around 3 g of organic carbon per membrane square meter. These results were obtained during filtration of effluent organic water fractions on a 8 kDa cut-off membrane. Results presented in figure 6 in the current paper show more important flux decline and also more significant differences between water fractions for a similar quantity of organic carbon filtered. These differences could be attributed to membrane material (Polyamide in Jarusutthirak et al., 2002 versus Polysulfone in this work), to the membrane cutoff or the origin of the raw water.
3.3. Irreversibility
As shown in the introduction, irreversibility is a key parameter as it will influence the process through the necessity to make hydraulic or chemical actions having an impact as well on the production costs as well as on the environment.
The reversibility study has been done by evaluating the flux using ultra pure water after a rinsing step and after a 24h soaking in order to estimate reversible polarisation concentration (by comparison with the permeability at the end of the filtration experiment) and possible desorption and/or relaxation of cake respectively.
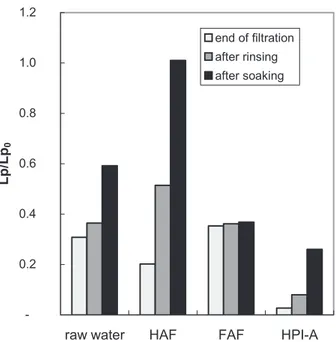
The ratios of the permeability at the end of each step (Lp) by the one of the new membrane (Lp0) are reported in figure 8.
-0.2 0.4 0.6 0.8 1.0 1.2
raw water HAF FAF HPI-A
L p /L p0 end of filtration after rinsing after soaking
Fig. 8: Reversibility after rinsing and soaking step
Although fulvic acids present less fouling during the filtration, they are more limiting when considering the overall process: in fact, rinsing steps as well as soaking are here inefficient to remove the accumulated matter. At the opposite end, fouling induced by humic acids fraction is totally reversible after a soaking step indicating that solute – membrane interactions are here not so strong. Similarly to the raw water, the HPI-A, which exhibits more pronounced fouling, is slightly reversible with a rinsing just after filtration but shows a more important reversibility after soaking: time can lead to relaxation of an important part of mass accumulation.
3.4. NOM removal
Fouling results can be correlated with NOM removal as the rejected solutes are expected to contribute to fouling phenomena.
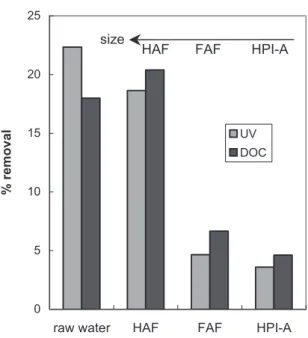
NOM removal, presented in figure 9, has been estimated by measuring UV absorption and DOC in the feed water and in the permeate.
0 5 10 15 20 25
raw water HAF FAF HPI-A
% r e m o v a l UV DOC size
HAF FAF HPI-A
Fig. 9: Estimation of removal of natural organic matter by UV and DOC
Similarities between organic removal and relative size of each fraction (figure 5) exist showing the preponderance of size mechanisms (when considering that adsorption phenomenon on the membrane has reached a stationary state).
Looking at the removal in terms of molecular size (fig. 10) it clearly appears that big compounds are better removed, confirming size mechanisms for the retention.
0 2 4 6 8 10 12 14 Retention time (min)
UV
(au)
raw water 0,45 µm Permeate
Fig. 10: Estimation of removal of natural organic matter by HPSEC
Furthermore, this size of compounds correspond in majority to humic acids, which is in good agreement with important removal observed in terms of UV and DOC (19% and 20% respectively).
4. Discussion
A deeper results analysis can be done by coupling removal with filtration experiments (summarized in table 3): removal of fulvic acids is low which is in good agreement with fouling as it was the fraction leading to the lower flux decline. For the hydrophilic fraction, many questions remain: the removal is low in spite of a great extent of fouling. Several hypotheses can be made:
- this fraction could contain inorganic compounds – non detected by UV or DOC measurements – able to obstruct membrane’s pore by precipitating.
- A fraction in small quantity can lead to important fouling as underlined by Howe and Clark (2002) who showed that 5 % of the organic matter is responsible for fouling phenomenon as proposed in the past.
The analysis of molecular size (fig. 4 and 5) combined with filtration experiments (fig. 6) allows identification the fraction leading to the most important fouling as the one made of smallest compounds (HPI-A). This observation supposes that fouling phenomena are more attributed to internal blocking or adsorption than size effects.
Table 3: Qualitative observations on each fraction
Fractions % in raw water Flux decline Irreversibility Retention
RW 100 ++ +++ ++
HAF 14 +++ ++ ++
FAF 58 + ++++++
-HPI-A 13 ++++++ +++
--When considering the HPI-A fraction, it appears that the fouling induced with this fraction is very pronounced: this fraction seems critical with regard to fouling. It could be interesting to investigate if a correlation can be highlighted between fouling potential of a water and its HPI-A concentration. However, this fraction seems to lose its fouling character when it is mixed with other fractions to recreate the original water: such a trend underlines that interactions between the different fractions can inhibit some of the specificities of isolated fractions. If such a trend is confirmed, we can prejudge that interactions between the multiples components of the water are as important as the composition itself.
Furthermore, it appears that fulvic acid fraction – which does not present significant propensity to fouling – is highly irreversible as well after rinsing and after soaking. As in water production the filtration process is made of successive filtration and backwashes
periods, after a while fulvic acids fraction could be expected to constitute an important part of fouling layer.
5. Conclusion
Different conclusions can be drawn from these results:
- The HPI-A fraction leads to significant fouling (with complete membrane blocking after filtration of 80 L.m-2) of the polysulfone membrane whereas the organic matter removal observed is low (less than 5%).
- This propensity to fouling of HPI-A is less pronounced when this fraction is reintroduced with the others to restore the raw water: it is postulated that interactions between different fractions inhibit the HPI-A fouling character.
- The fulvic acids fraction (FAF) does not exhibit important fouling during the filtration (result correlated with a low retention of about 6%) but can be partly responsible for long term fouling in an industrial plant as this fouling is totally irreversible (after rinsing).
Those results show that the composition of the raw water (in terms of hydrophobic and hydrophilic balance) has important consequences on fouling but can not be directly linked to the fouling propensity during filtration. Those difficulties could come from the chemical composition, although necessary to understand water behaviours, which is not sufficient to describe fouling because of interactions between water components that modify the specificities of isolated fractions. In future, studies on the importance of fouling with different mixtures of fraction could help to improve the prediction of fouling from chemical composition of water.
References
Aouabed A., Ben Aim R. and Hadj-Boussad D. E. (2001) Extraction and characterisation of organic matter from surface waters (reservoir of Keddara in Algeria). Environmental Technology 22, 597-606.
Aoustin E., Schafer A. I., Fane A. G. and Waite T. D. (2001) Ultrafiltration of natural organic matter.
Separation and Purification Technology 22-23, 63-78.
Arnal J. M., Sancho M., Verdu G., Lora J., Marin J. F. and Chafer J. (2004) Selection of the most suitable ultrafiltration membrane for water disinfection in developing countries. Desalination 168, 265-270.
Bessiere Y. (2005) Filtration frontale sur membrane : mise en évidence du volume filtré critique pour l'anticipation et le contrôle du colmatage. Thèse de l'Université Paul Sabatier, Laboratoire de
Génie Chimique
Bodzek M. and Konieczny K. (1998) Comparison of various membrane types and module configurations in the treatment of natural water by means of low-pressure membrane methods. Separation and Purification Technology 14(1-3), 69-78.
Boerlage S. F. E., Kennedy M. D., Aniye M. P., Abogrean E., Tarawneh Z. S. and Schippers J. C. (2003) The MFI-UF as a water quality test and monitor. Journal of Membrane Science 211(2), 271-289.
Cho J., Amy G. and Pellegrino J. (2000) Membrane filtration of natural organic matter: factors and mechanisms affecting rejection and flux decline with charged ultrafiltration (UF) membrane.
Journal of Membrane Science 164(1-2), 89-110.
Crozes G. F., Jacangelo J. G., Anselme C. and Laine J. M. (1997) Impact of ultrafiltration operating conditions on membrane irreversible fouling. Journal of Membrane Science 124(1), 63-76. Darcy H. (1856) Les fontaines publiques de la ville de Dijon. Victor Dalmont
Di Zio A., Prisciandaro M. and Barba D. (2005) Disinfection of surface waters with UF membranes.
Desalination 179(1-3), 297-305.
Edzwald J. K. and Tobiason J. E. (1999) Enhanced coagulation: Us requirements and a broader view.
Water Science and Technology 40(9), 63-70.
Espinasse B., Bacchin P. and Aimar P. (2002) On an experimental method to measure critical flux in ultrafiltration. Desalination 146(1-3), 91-96.
Fan L., Harris J. L., Roddick F. A. and Booker N. A. (2001) Influence of the characteristics of natural organic matter on the fouling of microfiltration membranes. Water Research 35(18), 4455-4463.
Ghidossi R., Daurelle J. V., Veyret D. and Moulin P. (2006) Simplified CFD approach of a hollow fiber ultrafiltration system. Chemical Engineering Journal 123(3), 117-125.
Jarusutthirak C., Amy G. and Croue J. P. (2002) Fouling characteristics of wastewater effluent organic matter (EfOM) isolates on NF and UF membranes. Desalination 145(1-3), 247-255.
Jucker C. and Clark M. M. (1994) Adsorption of aquatic humic substances on hydrophobic ultrafiltration membranes. Journal of Membrane Science 97, 37-52.
Koh L. C., Ahn W. Y. and Clark M. M. (2006) Selective adsorption of natural organic foulants by polysulfone colloids: Effect on ultrafiltration fouling. Journal of Membrane Science 281(1-2), 472-479.
Lee N., Amy G., Croue J. P. and Buisson H. (2004) Identification and understanding of fouling in low-pressure membrane (MF/UF) filtration by natural organic matter (NOM). Water Research 38(20), 4511-4523.
Lin C. F., Huang Y. J. and Hao O. J. (1999) Ultrafiltration processes for removing humic substances: effect of molecular weight fractions and PAC treatment. Water Research 33(5), 1252-1264. Lin C. F., Liu S. H. and Hao O. J. (2001) Effect of functional groups of humic substances on uf
performance. Water Research 35(10), 2395-2402.
Madaeni S. S. (1999) The application of membrane technology for water disinfection. Water Research 33(2), 301-308.
Malcolm R. L. and MacCarthy P. (1992) Quantitative evaluation of XAD-8 and XAD-4 resins used in tandem for removing organic solutes from water. Environment International 18, 597-607. Martin-Mousset B., Croue J. P., Lefebvre E. and Legube B. (1997) Distribution et caracterisation de la
matiere organique dissoute d'eaux naturelles de surface: Distribution and characterization of dissolved organic matter of surface waters. Water Research 31(3), 541-553.
Matilainen A. (2007) Removal of the natural organic matter in the different staes of the drinking water treatment process.
Mosqueda-Jimenez D. B. and Huck P. M. (2006) Characterization of membrane foulants in drinking water treatment. Desalination 198(1-3), 173-182.
Park C., Kim H., Hong S. and Choi S. I. (2006) Variation and prediction of membrane fouling index under various feed water characteristics. Journal of Membrane Science 284(1-2), 248-254. Peng W., Escobar I. C. and White D. B. (2004) Effects of water chemistries and properties of
membrane on the performance and fouling--a model development study. Journal of
Membrane Science 238(1-2), 33-46.
Schafer A. I. (1999) Natural organics removal using membranes. Thèse de l'Université du New South
Wales, Unesco Centre for Membrane Science and Technology
Schafer A. I., Schwicker U., Fischer M. M., Fane A. G. and Waite T. D. (2000) Microfiltration of colloids and natural organic matter. Journal of Membrane Science 171(2), 151-172.