Science Arts & Métiers (SAM)
is an open access repository that collects the work of Arts et Métiers Institute of Technology researchers and makes it freely available over the web where possible.
This is an author-deposited version published in: https://sam.ensam.eu
Handle ID: .http://hdl.handle.net/10985/9487
To cite this version :
JeanPierre MASSAT, Christophe LAURENT, JeanPhilippe BIANCHI, Etienne BALMES -Pantograph catenary dynamic optimisation based on advanced multibody and finite element co-simulation tools - Vehicle System Dynamics - Vol. 52, n°1, p.338-354 - 2014
Any correspondence concerning this service should be sent to the repository Administrator : [email protected]
Pantograph catenary dynamic optimisation based on advanced
multibody and finite element co-simulation tools
Jean-Pierre Massat
‡, Christophe Laurent
π, Jean-Philippe Bianchi
†and
Etienne Balmès
†‡
Innovation & Research Department, SNCF, Paris, France, π Vibrateam (Vibratec Group), Lyon, France, † Arts et Metiers ParisTech & SDTools, Paris, France
This paper presents recent developments undertaken by SNCF Innovation & Research Department on numerical modelling of pantograph catenary interaction. It aims at describing an efficient co-simulation process between Finite Element (FE) and Multibody (MB) modelling methods. FE catenary models are coupled with a full flexible MB representation with pneumatic actuation of pantograph. These advanced functionalities allow new kind of numerical analyses such as dynamic improvements based on innovative pneumatic suspensions or assessment of crash risks crossing areas that demonstrate the powerful capabilities of this computing approach.
Keywords: pantograph catenary interaction; co-simulation process; multibody; finite element; innovative design; infrastructure-rolling stock interaction;
1 Introduction
The performance of railway systems was historically improved by inline tests. Considering the constant traffic increase and the need to cut costs, new assessment methods have to propose higher expertise level at lower prices. Numerical solutions are the most promising way to achieve this goal particularly with tools getting closer from track conditions, while cutting down the computation time. In railways, the development of efficient simulation approaches becomes mandatory to design new components and to optimize maintenance. Various modelling strategies can be used to find the best compromise as it can be illustrated on pantograph catenary dynamic interaction researches (see [1], [2], [4], [2] and [5]).
OSCAR (Outil de Simulation du CAptage pour la Reconnaissance des défauts) has been developed by SNCF for nearly ten years [6][7][8] and certified against the EN50318 European Standard [9] since 2007. It proposes efficient pantograph catenary dynamic analysis tools based on the Structural Dynamics Toolbox for Matlab. Catenaries are modelled using a three-dimensional geometry interacting with simplified lumped mass pantograph model or special purpose multibody pantograph models [10][11]. Several studies showed a really good agreement between simulation results and inline measurements for many catenary designs in Europe [12][13] .
In order to allow very general pantograph models, using specialized software is a necessity but implies the need to use separate strategies for time integration. A co-simulation strategy was introduced to connect the FE model with multi-body solutions provided by MSC Software, in order to take into account realistic pantograph geometry, large kinematic displacements of flexible components, pneumatic actuation and joint non linearities in suspensions and dampers. Section 2 first discusses the FE model. Section 3 then discusses the multi-disciplinary model of a French high speed pantograph describing the structural and pneumatic control components. Section 4 then
discusses the strategy retained for co-simulation and associated validations based on comparisons for lumped mass pantograph models.
The paper finally addresses two applications. Section 5 presents an optimisation process to demonstrate the large improvements that could be foreseen on current collection quality using an enhanced passive pantograph head suspension with innovative pneumatic functionalities. Section 6, finally details a strategy to assess and improve risky catenary sections such as railway switch. This last study is focused on consequences of critical positioning of the Contact Wire (CW) leading to pantograph lateral horn straddling.
2 Finite element catenary modelling
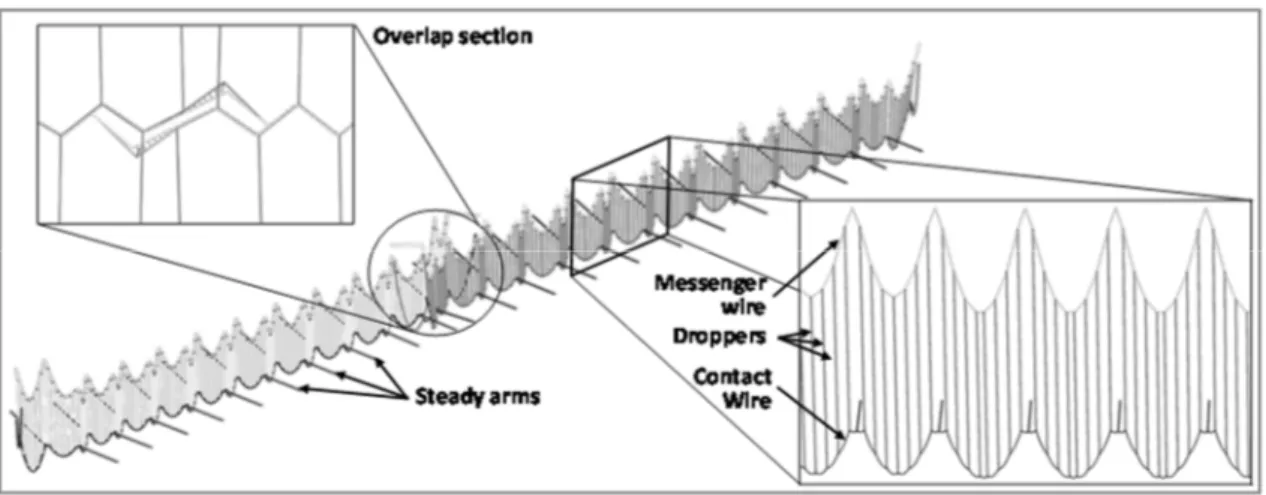
The three dimensional catenary is modelled using OSCAR software. The model is mostly composed of pre-tensioned Euler-Bernoulli Finite Elements but also allows masses, bars, springs, etc. This allows every kind of catenary geometries: conventional or high speed designs, DC or AC lines with one or several contact wires, with or without stitch wires, etc. Several catenary sections can be considered including overlap sections where pantographs run under several contact wires. The pantograph considers lumped masses with possible bumpstops and friction elements in the pantograph. Typical non linearities are dropper compression and pantograph/contact wire contact. In the latter case, shape functions of the contact wire beams and a mass or flexible beam representation of the friction band are used to compute penetration at the moving interface and generate a contact force using unilateral linear contact stiffness. The coupling of these flexible structures was studied in the literature, especially about load moving on a FE mesh [14][15][16][17]. OSCAR has been deeply validated against inline measurements and the catenary model is considered as stable and efficient Erreur ! Source du renvoi introuvable..
Simulation cases in this paper will be focused on the French high speed line between Paris and Tours, named LGV-A, for pneumatic suspension optimisation in section 5 and on simplified pre-tensioned wires for straddling studies in section 6.
Figure 1 - Finite element model for two sections of French High Speed catenary 3 Multibody pantograph modelling
Lumped mass models do not allow the representation of fully realistic mechanical features such as large displacement, joint bushing, realistic actuation system with pneumatic control or even advanced tools to apply external excitations such as
aerodynamic loads or car body displacements. In initial OSCAR developments, the focus was on describing catenary behaviour and a FE model for the pantograph allowed fast computations. For complex pantograph optimization, it is thus desirable to use body software capable of representing all features. This section details the multi-disciplinary pantograph model that was developed for this purpose [17].
3.1 Mechanical model
The choice was made to represent the pantograph geometry with high detail as shown in Figure 2. The main frame of the pantograph, composed of arms and rods, reproduces large displacements. It is actuated by an air spring that applies a torque on the lower arm through a cam-cable link. The shape description of the cam is significant because its design ensures a nearly constant mean contact load whatever the deployment is. In the same way, non-linear dampers on the main frame can be introduced in the model. The upper part, named bow, defines the interoperability capability and the aerodynamic sensitivity of the pantograph and its weight strongly impacts the dynamic interaction quality with the overhead line. As shown in Figure 2, the MB bow is made of friction bands and lateral horns.
Figure 2 - Pantograph key components for multibody modelling
Mechanical and structural parameters for dynamic representation and flexible bodies modelling were fitted from laboratory measurements and a full experimental modal analysis. The resulting model reproduces pantograph dynamic behaviour in three dimensions up to 200Hz [17]. For the pantograph base, the four arms and rods, the cross bar and friction bands, flexible bodies are introduced in the MB model based on the Craig-Bampton reduction that uses static modes at interfaces and fixed interface modes. The usual frequency band of interest for general pantograph/catenary analysis is between 0 and 20Hz. This band contains the three first vertical vibration modes: in phase rigid motion of frame and bow suspension, out-of-phase rigid motion of frame and bow suspension, and out-of-phase first bending mode of upper arm and bow suspension. The pantograph model was adjusted against measurements. The full flexible model is considered as the reference model and accurately reproduces these three different vertical resonances.
Figure 3 compares flexibility for a rigid MB model, a partially flexible with bushing joints, a partially flexible without bushing joints and a full flexible pantograph. Partially flexible takes into account upper arm and pantograph head as flexible bodies.
The rigid MB model represents only the two first vertical modes of the pantograph and amplitudes are highly underestimated. On the contrary, the partially flexible model without bushing slightly overestimates amplitudes. Joint bushing induces a better matching of amplitudes with the full flexible pantograph. Consequences of this modelling level on dynamic interaction with catenary are studied in Table 2.
Figure 3 - Dynamic impedance comparison as a function of pantograph flexible elements in the [0,20Hz] range.
3.2 Control system for pneumatic actuation
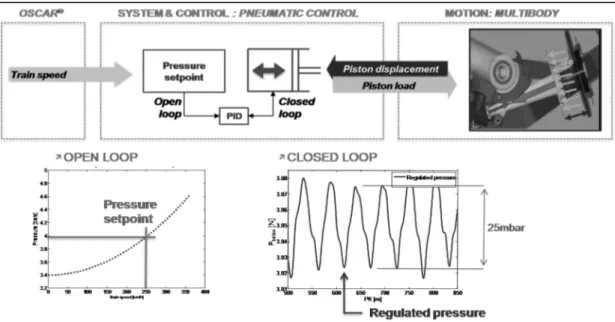
The considered pantograph is deployed by a pneumatic actuator controlled by a pressure related to train speed. The control device is supplied by the general air supply network of the train and delivers compressed air using a pneumatic adjustment system. It is made of two control loops: an open-loop control to establish the pressure target depending on train speed and a closed-loop control to compensate pressure variations in the air spring due to pantograph dynamic movements.
In the model illustrated in Figure 4, the open loop target is computed based on train speed provided by OSCAR. For the closed loop, the mechanical piston displacements is sent by the MB model to the control system that returns the pneumatic load applied on piston surface. The closed loop for pressure regulation is modeled by a PID controller implemented as a second co-simulation process.
Figure 4 - Pneumatic control system block diagram and communication process with multibody pantograph
4 Co-simulation process and numerical validation
4.1 Process description
The objective of co-simulation is to allow the combined use of detailed models for pantograph and catenary. The performance of each model implies the use of different integration strategies. The FE uses large fixed time steps and an implicit Newmark scheme, while the MB uses variable time steps based on Gear time integration method.
Since detailed contact modelling is desired at the contact wire/friction band interface, Hertz contact with Coulomb friction is retained. Integration of such contact and verification of further constraints of impenetrability, gap between bodies, and energy conservation requires low time steps and must thus be done in the MB model.
A key contribution is thus the introduction in the process of short rigid contact wire segments, called communication entities. These segments have their positions enforced by the FE model and account for contact wire deflection and train speed. Interpolation is used to estimate their motion at the shorter time steps of the MB model. The MB solver then computes resulting forces on the two segment end nodes and these are applied as contact loads to the FE model at its time steps as shown in Figure 5. Static positioning is a key aspect, so communication of the CW positions in the catenary static state is needed for the pantograph static adjustment before launching the iterative co-simulation process.
A co-simulation process generally may introduce some difficulties [20][21]. Motion interpolation between different time schemes can lead to incorrect responses. Comparable simulations will be shown next to give nearly identical results, so this issue is not important here. Moreover, the computation time can be strongly impacted because of additional time required to exchange data between software and this will be discussed in section 4.4.
4.2 Verification in comparable cases
The deviations introduced by the co-simulation process need to be numerically validated quantifying possible deviations from current FE solutions that are certified against standards. For this objective multibody co-simulation and classical lumped mass pantographs are modelled with the same rheological values. A first comparison over a simple pre-tensioned wire composed of 200 Euler-Bernoulli beams is made to avoid modifications due to full catenary modelling aspects. A time simulation is performed over 1 second (100m at 100m/s). Statistical deviations are obtained on the average, standard deviation and maximum values of the contact load and given on Table 1. Since every criterion is below 1% of relative difference, no significant deviation is observed.
Unfiltered Fm [N] σ [N] Fmax [N]
OSCAR lumped mass 64.2 Réf. 1.343 Réf. 67.7 Réf. COSIM lumped mass 64.2 <<1% 1.363 1% 67.7 <<1%
Table 1- Contact load statistical results comparison between a classical FE simulation and a co-simulation with a multibody three lumped mass model under a simple pre-tensioned wire
A zoom on one meter of simulation is displayed in Figure 6 and illustrates that element discretization do not introduce any artificial perturbation. The very low difference between the two results establishes the validity of the proposed co-simulation.
Figure 6 - Time history of contact load of three lumped mass under a simple pre-tensioned wire through a FE simulation (grey solid line with circles) and an equivalent co-simulation case (black solid line with
4.3 Influence of the pantograph model
After this first validation step, one can go through the second part of the validation process that aims at quantifying the deviations linked with detail level of the pantograph model: three lumped mass model, rigid multibody, partial and full flexible model and pantograph with pneumatic actuation. These four modelling levels of multibody pantograph are assessed against the reference case of a native lumped mass model. A French high speed catenary is used for the evaluation.
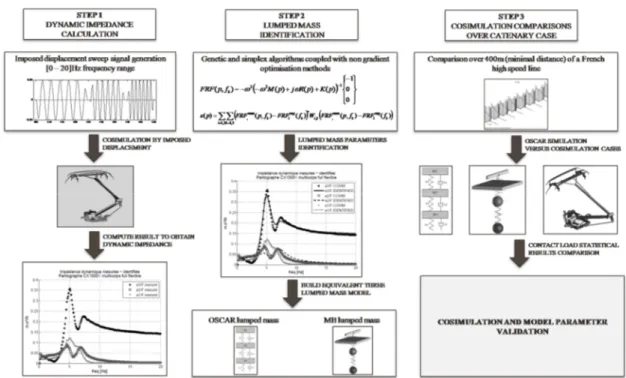
The proposed procedure is composed of three main steps described in Figure 7: dynamic impedance calculation, lumped mass identification and co-simulation comparisons over catenary case. First, a dynamic analysis is performed on the full flexible MB pantograph using imposed displacements. Dynamic impedance is obtained on three positions (friction bands, upper arm, and knee). Second, the simplified three lumped mass model is identified with a Non Gradient Optimisation method (NGO) by fitting the computed Frequency Response Functions. The rheological parameters are obtained after an optimisation process through a genetic algorithm for global optimum and a simplex algorithm to find the local one. Third, the co-simulation over 400m of the French LGV-A catenary is performed and analyzed.
Figure 7 - Co-simulation numerical validation procedure in three steps. First, dynamic impedance calculation. Second, equivalent three lumped mass model identification. Third, temporal contact load
comparison between a classical and MB software co-simulation cases
Table 2 gives results for the different pantograph modelling levels. Average Fm,
standard deviation σ and maximum values Fmax of the contact load are computed and
used as criteria. The contact load average is a simulation input, therefore the same value is applied for each simulation in order to keep the same basis of comparison to study impact of pantograph modelling level.
The classical FE simulation is taken as the reference case. This gives information about assessment of hypotheses and values chosen for contact coupling, time step size necessary for convergence or also on communication entities geometry (length, diameter) to guarantee proper data exchanged with the FE.
Filtered [0 - 20]Hz Fm [N] σ [N] Fmax [N]
FE lumped mass 177.6 Ref. 60.2 Ref. 382.0 Ref. Co-sim lumped mass 175.7 1% 60.2 <1% 382.9 <1% Co-sim full rigid 178.1 <1% 59.4 -1.3% 367.0 -3.9% Co-sim full flexible 176.2 <1% 58.0 -3.6% 364.6 -4.6% Co-sim full flexible + pneumatic 175.9 1% 55.2 -8.3% 347.8 -9.0% Table 2 - Contact load statistical results for various models under 400m of the French High Speed Line
catenary
The three lumped mass shows a perfect agreement with the classical FE run since less than 1% deviation is observed for each of the statistical criteria. This further validates co-simulation.
For a full rigid pantograph, the maximum change is obtained for the maximum contact load with a -3.9% difference. These changes are attributed to differences in the model: only two degrees of freedom are represented (vertical displacement) and the real cam geometry (see Figure 2), non-linear suspension of the curved friction bands are taken into account. This demonstrates that co-simulation strategies as well as contact management remain very efficient to be used with more complex and realistic pantograph models under a realistic catenary simulation case.
When flexible bodies are used in the numerical pantograph model, changes become more significant: -3.6% on standard deviation of contact load and -4.6% on the maximum contact load. Those discrepancies illustrate the influence of flexibility on dynamics even if the lumped mass model rather accurately represents vertical behaviour in [0-20] Hz frequency domain. For instance, the upper arm flexion may interact with catenary resonances and minimize or increase contact wire displacements. Moreover, the contact management becomes more complex because of discretized contact strips modelling.
It is important to note that mechanical piston without pneumatic actuation gives a good approximation. The last comparison is made with the full flexible pantograph model including pneumatic actuation of pantograph air spring. The statistical results, respectively standard deviation and maximum contact load, attain a relative difference of -8.3% and -9.0% compared to a three lumped mass model without co-simulation. The pneumatic regulation has a non-negligible impact on pantograph catenary interaction, but deviation remains relatively small.
4.4 Computation efficiency
The pantograph catenary co-simulation process requires a strong-coupling to exchange data at each time step. To achieve this objective, the implementation used memory mapped files so that all data is efficiently exchanged through the Random Access Memory (RAM). This section gives some figures to illustrate computational times.
The reference simulation run is 400m under the French LGV-A catenary at 300km/h corresponding to 6 seconds real time. The four multibody models defined in the previous section are assessed through the co-simulation process to study simulation time evolution according to pantograph modelling level.
Table 3 gives the computation time and its increase ratio compared to reference. There are two kinds of ratio, first against results without co-simulation and then against the previous model level.
The MB lumped mass model is used with and without co-simulation. In this case, the assessment is focused on the lag introduced by the numerical exchanges during a co-simulation process and the time lost because catenary solver and pantograph solver work sequentially. We can see in Table 3 that 30% total duration increase is observed.
For a fully rigid multibody pantograph, computation time is doubled. This increase can be explained by large displacements taken into account as well as non-linearities such as cam definition, joints bushing, contact management on incurved friction bands. Introducing flexible elements, that significantly improve the dynamic representation of the model, simulation time is very slightly increased. Only 32% simulation duration is added to the case of a rigid multibody pantograph. Thus, those simulation times remain in a very acceptable range for parametric analysis.
Finally, the pneumatic system requires an integration time step ten times smaller to avoid divergence and ensure a good precision on results. Besides, there is a second co-simulation process between the MB and the pneumatic system solvers. This explains the large time duration increase for this case. However, efficiency is kept since simulations last less than ten times the full flexible case.
Time step Computation
time Computation time ratio
OSCAR lumped mass 1.10-4 s 187s Ref.
Co-sim lumped mass 1.10-4 s 240s ×1.3 Ref.
Co-sim full rigid 1.10-4 s 381s ×2.0 ×1.6 Ref.
Co-sim full flexible 1.10-4 s 501s ×2.7 ×1.3 Ref.
Co-sim full flexible + pneumatic 1.10-5 s 4069s ×21.8 ×8.1 Table 3 - Computation time comparison between base simulation and four complexity levels of
pantograph model in co-simulation cases 5 Head suspension optimisation based on pneumatic systems
5.1 Mechanical and pneumatic head suspensions
Pantographs are generally made of two suspension levels: the main frame and the head. They are adjusted to filter respectively large displacements at low frequencies (mast passing and wind gust) and small displacements at high frequencies especially to reduce dynamic interaction with catenary. This second level is located between the main frame and the bow as illustrated on the Figure 2. The current system is made of mechanical springs guided by a ball-bearing to reduce friction damping.
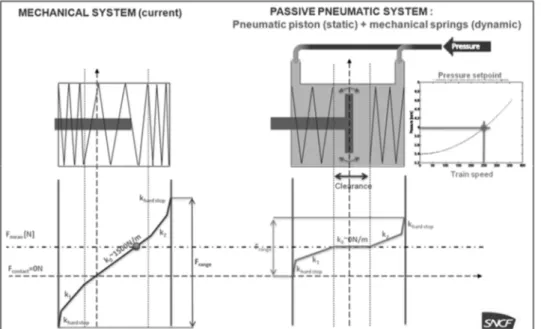
The design gives a piecewise linear stiffness, but in operating conditions, the working spring position is associated with a linear behavior shown as k0 in Figure 8.
This stiffness is meant to compensate the mean contact load with catenary.
It has been shown in a previous study [22] that decreasing drastically this suspension stiffness could lead to substantial improvements of pantograph catenary dynamic interaction. But limits arise from mechanical suspensions since decreasing the stiffness value requires an increased spring length because of preload adjustments.
Thus, it has been proposed to take benefit from air supply network available on pantograph and use pneumatic suspensions. The innovative solution developed by SNCF in a patent [22] is assessed using the multidisciplinary software. The design constraints are to keep the same size as the current system and only use pneumatic energy. The system is made of a passive double effect pneumatic actuator (with two chambers supplied by the same source) and two compression springs without pre-stress,
as shown on the upper part of the right side of Figure 8. The mean contact load is therefore driven by the section ratio between the piston rod and piston head. Pneumatic damping can be controlled both by a flow valve and the designed piston/box clearance. The resulting stiffness behaviour is illustrated on the lower part of the right side of Figure 8. One can see an ideal system with a nearly 0N/m stiffness in working position.
Figure 8 - Current mechanical suspension scheme and its non linear stiffness (left) - Pneumatic device concept and its associated non linear stiffness (right)
The pneumatic solution allows to design a non linear stiffness with a better decoupling of dynamic displacements between the pantograph main frame and its head. The length
clearance may lead to instabilities and thus is reduced to minimum. Four distinct slopes
can be defined by designers: the first corresponds to the lower spring stiffness, the middle one to the operating aera, the third one to the upper stiffness and the last one to the upper pneumatic actuator hard stop. The pneumatic control developed with multi-disciplinary software reproduces the expected behaviour for the response to a triangular input (see Figure 9). This detailed model highlights a hysteresis phenomenon due to the
clearance area.
5.2 Parametric analysis based on multi-disciplinary models
A parametric analysis was performed first with this co-simulation process to compare mechanical or pneumatic head suspensions first using a simplified three lumped mass model with two friction bands (see Table 4), then with the full MB pantograph (see Table 5). The catenary is the French LGV-A section, with post-processing distance of 400m, and comparisons are based on statistical contact load analyses. The mean contact load is imposed at 169N for the three lumped mass and 157N for the full pantograph model. It is carefully checked that pneumatic piston displacements remain in the operational area avoiding hard stop contact. Spring stiffness added to pneumatic device is 10 times lower than the nominal one.
Table 4 describes the parametric comparison of pneumatic systems to the reference mechanical system (Case 1). The pneumatic system with nominal stiffness (Case 2) has a very slight impact on the head suspension dynamic behaviour (<1%). However, dividing spring stiffness by 10 (Case 3) leads to 18% decrease of standard deviation values and 21% decrease of maximum contact load.
The introduction of a clearance (Case 4) increases standard deviation and maximum values. This parameter leads to unstable behaviour and has thus to be avoided. Further calculations, in cases 5 & 6, show the robustness of the system to additive mass of the bow. An increase of the bow mass by 10%, then 50%, reduces the standard deviation improvement to 7%, but remains better than the current system with a lighter mass. INPUTS OUTPUTS Ca se Suspension Stiffness k1=k2 Clearance Bow
mass Fmean [N] σ [N] Fmax [N] 1 Mechanical Nominal - Nominal 168.7 Ref 62.8 Ref 426.9 Ref 2 Pneumatic Nominal 0cm Nominal 168.7 <1% 62.1 -1% 415.9 -3% 3 0.1×Nom 168.9 <1% 51.2 -18% 336.4 -21% 4 2cm 169.5 <1% 52.9 -16% 383.1 -10% 5 0cm 1.1×Nom 168.7 <1% 52.7 -16% 340.7 -20% 6 1.5×Nom 168.6 <1% 58.6 -7% 363.0 -15%
Table 4 - Contact load statistical results of a parametric analysis on pneumatic head suspension device using a three lumped mass model
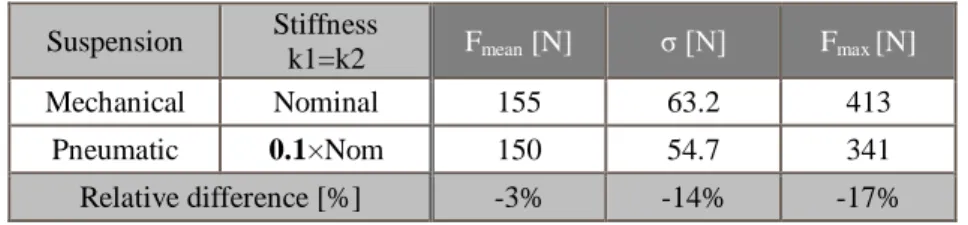
This study was reproduced using a full flexible multibody pantograph. Results show that a large improvement of 14% is reached for standard deviation of the contact load and 17% for the maximum contact load value (see Table 5). The impact of pneumatic suspension is decreased compared with the case of lumped mass models. It can be explained by differences in modelling details (see §3.1) and the fact that the full multibody pantograph is mounted with four bow suspensions instead of only one for the simplified lumped mass model.
Suspension Stiffness
k1=k2 Fmean [N] σ [N] Fmax [N]
Mechanical Nominal 155 63.2 413
Pneumatic 0.1×Nom 150 54.7 341
Table 5 - Statistical results for a comparison between mechanical and pneumatic actuator mounted on full flexible MB pantograph
This preliminary study is very promising for future advanced design optimisation analysis using a pneumatic head suspension. It shows that the detail of MB pantograph models allow designs studies.
6 Reproducing railway switch
This section deals modelling of with risky areas where a contact wire comes from a side track and may lead to failure because of horn straddling. A full analysis of pantograph/catenary adjustment is carried out and underlines the benefits of a detailed geometrical modelling of pantograph.
6.1 Crossing lines and straddling
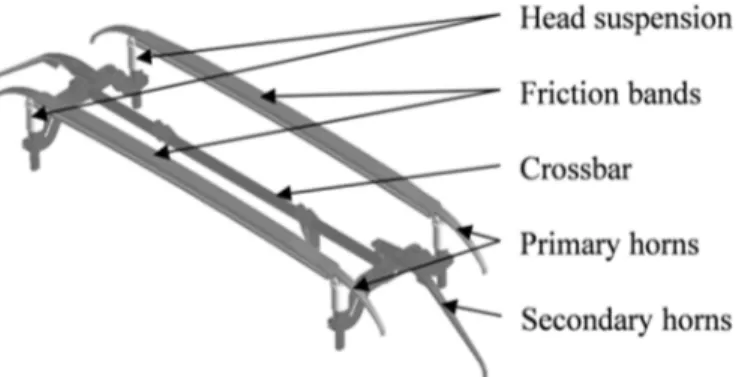
This study is focused on a pantograph design developed for French high speed lines. The bow described in Figure 11 is connected to the main frame through the crossbar. There are primary and secondary horns respectively at each extremity of the two independent friction bands and the crossbar. These horns are designed to avoid any straddling phenomenon.
Figure 10 - Full multibody pantograph bow description with two independent contact strips The railway switch is characterised by a main track that encounters a secondary
track at a crossing point. The main track is the current train running line. The secondary
track comes from pantograph side and impacts the bow at the landing point as detailed in Figure 10. The height and the lateral position of the landing point on the pantograph horns are particularly critical because it can occur below the horn depending on the horizontal and vertical contact wire incident angle. Those parameters are defined by national maintenance rules. Usually, no crash happens because lateral horns are designed to guide contact wire on the top of friction bands. However, some configurations allow crash situations called straddling as illustrated in the Figure 11.
Figure 11 - Top view of a railway switch (top) and pantograph bow straddling phenomenon description (bottom)
The following general methodology is introduced to study such configurations. On the FE side, the main catenary is modelled as usual and the secondary CW is modelled using simple FE pre-tensioned wire. The secondary CW incident angles and landing point positions are parameterized. On the MB side, three communication entities are modelled. Each of them is coupled with a specific pantograph body for contact definition: front and rear communication entities are coupled with friction bands and their primary horns, the middle one to the cross bar and its secondary horn as described in Figure 12. The MB solver then manages possible contacts with these entities. The pantograph model is a partially flexible multibody model: all components are flexible bodies except the pantograph basis. The static load on friction bands depends on pressure defined in the pneumatic actuator.
For the simulation, the pneumatic actuator is adjusted to provide a 80N static load for a train running at 30 km/h. In the simulation, the primary CW applies a vertical load on the bow leading to a slight inclination of the friction bands and, as a result, a displacement of the primary horn extremity. Moreover, the bow suspension preload is considered to position the two friction bands vertically.
Figure 12 - Railway switch modelling. Left: Incident angle on XY plane - Right: Incident angle on the XZ plane
The contact wire of the secondary track is composed of a simple FE pre-tensioned (20kN) wire of 1000m. This length reproduces a typical catenary section distance taking into account wave reflections that may influence horn straddling. A local wire refinement is applied to improve wire displacement computation accuracy at landing position and optimize co-simulation time. Gravity is not applied to the secondary contact wire to avoid deflection and to better control impact position on
secondary horn. This computation case is relevant because of the quasi static state of the simulation.
Left side of Figure 13 shows a case where the secondary contact wire is normally guided by the lateral horns until the top of the friction bands. One can see the deformation of the upper arm because of load on lateral horns. On the right, a case with critical angles is shown. The contact load applied on the secondary horn pushes down the crossing bar and as a consequence increases the clearance between the primary horn and the secondary horn. The lateral wire can slide under the primary horn and then come below the friction band. This situation systematically leads to system breakage on real track. Several other parameters could be considered to complete this analysis: friction bands displacement due to dynamic interaction with the main contact wire, lateral position of the pantograph due to train dynamics, etc.
Figure 13 - Left: Secondary CW is guided by the lateral horns over the friction bands - Right: Secondary CW is going to impact the bottom part of the primary front horn leading to straddling effect 6.2 Parametric analysis for crash prediction
A parametric study is compulsory to define pertinent crash risk indicators and propose pantograph design and catenary adjustment rules. The work proposed here aims at defining secondary contact wire angles that could lead to horn straddling phenomenon described in section 6.1. The design space is defined with a set of 1000 simulation runs. The reference case uses nominal values of the secondary contact wire angle in a railway switch area: 2° (3.5 10-2 rad) in XZ plane and 7.5° (13.1 10-2 rad) in XY plane. Vertical and horizontal angles are independent design parameters randomly selected respectively in the ranges [2°, 6°] and [7°, 14°].
Signal processing is carried out on contact loads to detect horn straddling. Several criteria based on the contact load and contact wire position against friction band position have to be considered. For instance, a zero contact force, which indicates that no contact happened between communication entities and horns, combined to a contact wire position below friction bands means that a straddling occurred. In the same way, a negative vertical contact load indicates a straddling. Several successive phenomena can even be combined and needs to be carefully analysed to succeed in failure case prediction.
Figure 14 displays a lateral force in black and a vertical force in grey in the case of a horn straddling phenomenon. The contact force between contact wire and friction bands keeps a zero value until impact occurs at until 0.14s. Then the vertical contact force becomes negative. At 0.2s, the lateral force also becomes negative. It shows that the communication entity slides under the bottom side of the primary horn. Beyond 0.22s, both contact forces come back to zero stating a contact lost between the
communication entity and the friction band meaning that communication entities are under the friction bands.
Figure 14 - Time histories of lateral contact load (black solid line) and vertical contact load (grey solid line) over crash test on simple pre-tensioned CW
A complete parametric analysis, representing 1000 simulations, is displayed in Figure 15. A cross marker is used to represent each design point. Additional circles are added to identify straddling cases and squares for non-obvious straddling cases, where the crash detection doesn't give a full confidence. Indeed, due to co-simulation configuration and time duration, uncertain cases are detected. For example, it can correspond to a rebound on the primary horn extremity that may lead to friction band damage or even possible break. On Figure 15, a critical area in grey is displayed to define three different domains: no risk of straddling represented by cross markers only, uncertain area of straddling represented by the grey area and an area leading to systematic failure by straddling represented by circle marker.
Figure 15 - Parametric analysis on secondary CW inclination angles results. Design space (crosses), uncertain failure cases (rectangles), failure cases (circles)
7 Conclusion
This paper presented recent developments undertaken in the framework of SNCF Innovation & Research Department projects on pantograph catenary interaction modelling based on finite element simulation of the catenary and advanced multibody simulation of the pantograph including finite element and control system methodologies. This powerful approach, that combines multiphysic computing strategies, brings an answer to growing needs for detailed pantograph catenary analyses reproducing realistic physical behaviour and giving access to a large range of parameters hardly measurable on track or test bench.
The co-simulation is very efficient and do not introduce any significant deviation. The additional cost of co-simulation is marginal for equal pantograph models and acceptable when details are needed.
The influence of flexibility of pantograph components is assessed. It is shown that a full flexible pantograph introduces a marginal deviation with a lumped mass model in [0 - 20] Hz frequency range but remains necessary to take into account higher frequencies. As conclusion, each model leads to specific analysis and studies about pantograph catenary dynamics. For instance, a lumped mass model is limited to dynamics studies and provides short computation time although a full flexible MB model is dedicated to pantograph design and needs longer computation time. The goal of each study defines the right complexity level to use.
The co-simulation process in particular allowed the study of a novel pneumatic suspension. This preliminary study is very promising for future advanced design optimisation analysis using a pneumatic head suspension. It shows that the detail of MB pantograph models allow designs studies. A design optimisation process illustrates the possible improvements that can be foreseen using an innovative pneumatic head suspension. The parametric study describes gains obtained from mechanical and pneumatic aspects separately and defines limits in terms of acceptable mass on board.
The case of railway switches and possible straddling was studied next and it was shown that the process could be used to provide design guidelines for switch geometry. The DoE is used to define critical catenary design and pantograph adjustment parameters that could lead to system breakage according to body flexibility and suspension preload of the pantograph. Results show that three dimensional structural considerations are key factors for this kind of expertise.
Additional parameters, such as head suspension preloads, car body roll, pantograph catenary dynamics induced by the main contact wire, its lateral positioning, etc., could be taken into account to perform further parametric analysis and lead to an enhanced definition of maintenance criteria or component design.
The application fields allowed by this numerical approach are extended to new and more complex kinds of engineering studies involving the pantograph system at a very detailed level.
Acknowledgements
This paper describes work undertaken by SNCF Research and Innovation Department with the precious support of SNCF Infrastructure and Rolling Stock Engineering Departments as well as MSC Software, SDTools and Vibratec companies. The Authors would like to particularly thank Thierry BERNARD from MSC Software for his contribution on pantograph multi-disciplinary modelling and co-simulation process development.
References
[1] A. Collina and S. Bruni, Numerical simulation of pantograph-overhead
equipment interaction. Vehicle System Dynamics, 38: 261–291, 2002.
[2] G. Poetsch, J. Evans, R. Meisinger, W. Kortüm, W. Baldauf, A.Veitl, and J. Wallascheck, Pantograph/catenary dynamics and control. Vehicle System Dynamics, 28: 159–195, 1997.
[3] T. Dahlberg, Editorial - catenary, pantograph, and their interaction. Vehicle System Dynamics, 44: 591–593, 2006.
[4] L. Drugge, T. Larsson, and A. Stensson, Modelling and simulation of
catenary-pantograph interaction. Vehicle System Dynamics, 33 Supp. 490–501, 1999.
[5] T. Yagi, A. Stensson, et C. Hardell. Simulation and visualistaion of the dynamic
behaviour of an overhead power system with contact breaking. Vehicle System
Dynamics, 25: 31–49, 1996.
[6] J.-P. Massat, J.-P. Laine, A. Bobillot, Pantograph-catenary dynamic simulation, In Proceedings of the International Association for Vehicle System Dynamics, Milan, Italia, 2004.
[7] L.-M. Cleon, A. Bobillot, J.-P Mentel, E. Aziz, OSCAR: La caténaire en 3D, In Revue Générale des Chemins de Fer, Vol 155, 2006.
[8] J.-P. Massat, Modélisation du comportement dynamique du couple
pantographe-caténaire, Application à la détection de défauts dans la pantographe-caténaire, In doctoral
thesis, Ecole Centrale de Lyon, 2007.
[9] EN50318:2002: Railway applications. Current collection systems. Validation of
simulation of the dynamic interaction between pantograph and overhead contact line, European standard, 2002.
[10] F. Grases Rauter, Pantograph-catenary interaction using flexible multibody
dynamics methodology, In doctoral thesis, Instituto Superior Técnico, 2011
[11] F. Labergri, Modelisation du comportement dynamique du systeme
pantographe-catenaire. In Doctoral Thesis, Ecole Centrale de Lyon, 2000.
[12] J.-P. Massat, C. Laurent, Simulation Tools for Virtual Homologation of
Pantographs, In proceedings of the First International Conference on Railway
Technology (Railways 2012), Las Palmas de Gran Canaria, Spain, 2012.
[13] A. Bobillot, L.-M. Cleon, A. Collina, O. Mohamed, R. Ghidorzi,
Pantograph-Catenary: a High-Speed European couple, In Proceedings of the World Congress
on Railway Research, Seoul, Korea, 2008.
[14] S. Verichev and A. Metrikine, Instability of vibrations of a mass that moves
uniformly along a beam on a periodically inhomogeneous foundation. Journal of
Sound and Vibration, 260: 901–925, 2003.
[15] L. Sun, Dynamic displacement response of beam-type structures to moving line
loads. International Journal of Solids and Structures, 38: 8869–8878, 2001.
thesis, Delft University, 2002.
[17] T. Dahlberg, Moving force on an axially loaded beam - with applications to a
railway overhead contact wire. Vehicle System Dynamics, 44: 631–644, 2006.
[18] S. Bruni, J. Ambrosio, A.Carnicero López, Y. H. Cho, L. Finner, M. Ikeda, S. Y. Kwon, J.-P. Massat, S. Stichel, M. Tur, W. Zhang, the pantograph-catenary
interaction benchmark, In proceedings of The International Association for
Vehicle System Dynamics, Qingdao, China, 2013.
[19] S. Teppe, C. Clerc, A. Bobillot, F. Grases Rauter, Modélisation du comportement
dynamique d'un pantographe, In Proceedings of the MSC Software Adams Users
Group Congress, 2010.
[20] F. González, M. Ángel Naya, A. Luaces, M. González, On the effect of multirate
co-simulation techniques in the efficiency and accuracy of multibody system dynamics, Multibody System Dynamics, Vol. 25, Issue 4, pp 461-483, 2011.
[21] W. Prescott, D. Tohoneanu, Techniques to incorporate multibody solvers into
multiphysics applications, 1ST International Conference on Innovations, Recent
Trends and Challenges in Mechatronics, Mechanical Engineering and New High-Tech Products, Development, MECAHITECH‘09, Bucharest, Roumania, 2009. [22] A. Bobillot, J.-P. Massat, J.-P. Mentel, Design of pantograph-catenary by
simulations, In proceedings of the World Congress on Railway Research, Lille,
France, 2011.

![Figure 3 - Dynamic impedance comparison as a function of pantograph flexible elements in the [0,20Hz]](https://thumb-eu.123doks.com/thumbv2/123doknet/7365069.214191/5.892.273.612.238.551/figure-dynamic-impedance-comparison-function-pantograph-flexible-elements.webp)