HAL Id: dumas-01887452
https://dumas.ccsd.cnrs.fr/dumas-01887452
Submitted on 8 Oct 2018HAL is a multi-disciplinary open access archive for the deposit and dissemination of sci-entific research documents, whether they are pub-lished or not. The documents may come from teaching and research institutions in France or abroad, or from public or private research centers.
L’archive ouverte pluridisciplinaire HAL, est destinée au dépôt et à la diffusion de documents scientifiques de niveau recherche, publiés ou non, émanant des établissements d’enseignement et de recherche français ou étrangers, des laboratoires publics ou privés.
Comparison of automatic segmentation versus visual
assessment of white matter hyperintensities and
parenchymal atrophy in Alzheimer’s disease
Lison Malaureille
To cite this version:
Lison Malaureille. Comparison of automatic segmentation versus visual assessment of white matter hyperintensities and parenchymal atrophy in Alzheimer’s disease. Human health and pathology. 2018. �dumas-01887452�
AVERTISSEMENT
Ce document est le fruit d'un long travail approuvé par le
jury de soutenance et mis à disposition de l'ensemble de la
communauté universitaire élargie.
Il n’a pas été réévalué depuis la date de soutenance.
Il est soumis à la propriété intellectuelle de l'auteur. Ceci
implique une obligation de citation et de référencement
lors de l’utilisation de ce document.
D’autre part, toute contrefaçon, plagiat, reproduction illicite
encourt une poursuite pénale.
Contact au SID de Grenoble :
bump-theses@univ-grenoble-alpes.fr
LIENS
LIENS
Code de la Propriété Intellectuelle. articles L 122. 4
Code de la Propriété Intellectuelle. articles L 335.2- L 335.10
http://www.cfcopies.com/juridique/droit-auteur
1
UNIVERSITÉ GRENOBLE ALPES
UFR DE MÉDECINE DE GRENOBLE
Année: 2018
COMPARISON OF AUTOMATIC SEGMENTATION VERSUS VISUAL ASSESMENT OF WHITE MATTER HYPERINTENSITIES AND PARENCHYMAL
ATROPHY IN ALZHEIMER’S DISEASE
THÈSE
PRÉSENTÉE POUR L’OBTENTION DU TITRE DE DOCTEUR EN MÉDECINE
DIPLÔME D’ÉTAT
Mme Lison MALAUREILLE
THÈSE SOUTENUE PUBLIQUEMENT À LA FACULTÉ DE MÉDECINE DE GRE-NOBLE
Le : 27/09/2018
DEVANT LE JURY COMPOSÉ DE
Président du jury :
M le Professeur Alexandre KRAINIK (directeur de thèse)
Membres :
Mme le Docteur Sylvie GRAND
M le Professeur Alexandre MOREAU-GAUDRY
M le Docteur Olivier MOREAUD
L’UFR de Médecine de Grenoble n’entend donner aucune approbation ni improbation aux opinions émises dans les thèses ; ces opinions sont considérées comme propres à leurs auteurs.
6
Table des matières
Rappels ... 8
Résumé ... 11
Abstract... 13
Introduction ... 14
Patients and Methods ... 16
Patients ... 16
MRI data acquisition ... 16
MRI data analysis ... 17
A. White matter hyperintensities analysis ... 17
B. Parenchymal atrophy ... 19
Results ... 23
Patients’ characteristics ... 23
White matter analysis ... 24
A. Visual assessment ... 24 B. Automated segmentation ... 24 C. Comparison ... 25 Parenchymal atrophy ... 26 A. Visual assessment ... 26 B. Automated segmentation ... 26 C. Comparison ... 27 Discussion ... 29
White Matter Hyperintensities ... 29
Parenchymal atrophy ... 30
A. Hippocampal atrophy ... 30
B. Frontal and Parietal atrophy ... 31
Relationship between WMH and parenchymal atrophy ... 32
Limitations of the study ... 33
Conclusion ... 34
7 Conclusion signée ... 39 Serment d’Hippocrate ... 41
8
Rappels
La maladie d’Alzheimer représente plus de 70 % de l’ensemble des démences de la personne
âgée.
La démence se définit (selon le DSM IV) par une atteinte des fonctions intellectuelles et
co-gnitives. Sa sévérité entraine une perte d’autonomie dans les gestes de la vie quotidienne ou
dans les interactions sociales. Les troubles doivent évoluer depuis six mois au minimum.
Une entité clinique intermédiaire entre le vieillissement physiologique et la démence a été
défini par le terme : Troubles Cognitifs Légers amnésiques (TCL-A). Il s’agit d’un syndrome
défini par un déclin cognitif plus important que celui que l’on s’attend à trouver à un âge et
niveau d’éducation donnés, mais qui n’a pas de retentissement sur les activités de la vie
quo-tidienne.
Des tests neuropsychologiques sont réalisés chez les patients suspects de démence. Le test le
plus important dans la maladie d’Alzheimer est le test de Gröber & Buschke, ou test du
Rap-pel libre/RapRap-pel indicé à 16 items (RL/RI-16).
Le test est composé de 16 mots appartenant à 16 catégories sémantiques différentes et
com-prend successivement une phase de contrôle de l’encodage, un rappel indicé immédiat, trois
essais successifs de rappels libre et indicé, une phase de rappels libre et indicé différés (20
minutes), suivie par une phase de reconnaissance.
Il permet d’évaluer la présence et la nature des difficultés de mémoire épisodique verbale.
La maladie d’Alzheimer est caractérisée par deux types de lésions, les lésions amyloïdes et les
lésions tau ou dégénérescences neuro-fibrillaires. Si le patient présente ces deux sortes de
9 Des tests paracliniques sont réalisés afin de rechercher indirectement la présence de ces
lé-sions. Une ponction lombaire permet de rechercher un taux de peptide Aβ1-42 bas et des taux de protéine Tau totale et phosphorylée élevés. Une scintigraphie (ou PET-scan) cérébrale à
l’amyloïde permet d’évaluer la densité des plaques. En cas de début précoce, avec ou sans
antécédents familiaux de maladie d’Alzheimer, la recherche de mutations autosomiques
do-minantes sur les gènes APP, PSEN1 et PSEN2 peut également être réalisée.
Les critères diagnostics pour la maladie d’Alzheimer typique ont récemment évolué en 2014,
et ils reposent sur l’association :
- D’un phénotype clinique spécifique évoluant graduellement et progressivement depuis
6 mois et correspondant à un syndrome amnésique de type hippocampique
- Et de critères physiopathologiques de la maladie d’Alzheimer sur les résultats de la
ponction lombaire, du PET-TDM ou des analyses génétiques.
Une imagerie cérébrale systématique est recommandée pour tout trouble cognitif avéré de
découverte récente (recommandations HAS). Le but de cet examen est :
- D’éliminer une cause curable (tumeur cérébrale, infection cérébrale, hydrocéphalie à
pression normale) ou de rechercher des images séquellaires (traumatiques,
vascu-laires).
- D’objectiver une atrophie associée ou non à des lésions vasculaires afin d’orienter vers
une maladie neurodégénérative ou une démence vasculaire.
Cet examen est une imagerie par résonance magnétique nucléaire (IRM) avec des séquences
T1, T2, T2* et FLAIR et des coupes coronales permettant de visualiser l’hippocampe. À
défaut une tomodensitométrie cérébrale est réalisée.
10 Il n’existe actuellement aucun traitement pour guérir ou même modifier l’évolution
anatomo-pathologique de la maladie d’Alzheimer. En revanche, il existe des traitements qui ont pour
but de traiter certains symptômes du malade sans empêcher la progression de la maladie
(in-hibiteurs de l’acétylcholinestérase et la Mémantine qui bloque les récepteurs NMDA).
Un diagnostic précoce est important pour débuter au plus tôt les traitements médicamenteux
actuels, mais également tous les conseils préconisés en matière de prévention, stimuler au
mieux les facultés cognitives et de mémorisation. Il permet aussi au malade de prendre des
dispositions pour l’avenir tant qu’il possède encore ses facultés de discernement et de prise de
décision et pour sa famille, d’anticiper la perte d’autonomie avec la mise en place progressive
11
Résumé
Introduction : Les hyper intensités de la substance blanche et l’atrophie du parenchyme cérébral sont des anomalies courantes chez les patients âgés et les patients atteints de démence. Les logiciels de segmentation automatique pourraient être utiles pour l'analyse des patients adressés pour des troubles cognitifs légers amnésiques (TCLa) ou une maladie d’Alzheimer (MA) probable.
Patients et méthodes : 123 patients pris en charge pour des TCLa ou une MA probable ont été exa-minés par IRM (2D Axial Flair, 3DT1 FFE). Les volumes normalisés des hyper signaux de la subs-tance blanche et des épaisseurs corticales ont été mesurés grâce aux logiciels Pixyl.neuro et FreeSurfer puis comparés aux scores visuels habituels.
Résultats : 110 sur 123 patients (89%) ont été analysés après exclusion d'examens pour des problèmes techniques ou des erreurs de segmentation. Les volumes des hyper intensités de la substance blanche étaient corrélés aux scores visuels de Fazekas (r=0.78). Les volumes hippocampiques étaient corrélés aux scores visuels de Scheltens (r>0.63). Par contre, les volumes d’épaisseurs corticales frontales et pariétales n'étaient pas corrélés aux scores visuels d’atrophie pariétale ni au gradient d’atrophie fronto-pariétale.
Conclusion : Les analyses de segmentation automatique sont fiables pour évaluer les hyper intensités de la substance blanche et les volumes hippocampiques, tels que visuellement estimés. En revanche, la segmentation corticale automatique ne permet pas de mesurer l'atrophie fronto-pariétale telle qu'elle est couramment évaluée dans la pratique clinique.
12
Comparison of automatic segmentation versus visual
assessment of white matter hyperintensities and
parenchymal atrophy in Alzheimer’s disease
Lison Malaureille1, Felix Renard2, Alan Tucholka3, Maud Medici4, Alexandre Krainik1,2,5,6
1Department of Neuroradiology, University Hospital of Grenoble, France 2IRMaGe facility, University Grenoble Alpes, France, France
3Pixyl, Grenoble, France
4CIT803, University Hospital of Grenoble, France 5University of Grenoble Alps, Grenoble, France
13
Abstract
Introduction: White matter hyperintensities (WMH) and parenchymal atrophy are common findings in elderly and in dementia. Automated segmentation could be helpful for quantification in patients referred for amnestic Mild Cognitive Impairment (aMCI) and probable Alzheimer’s disease (AD). Methods: 123 patients referred for probable AD or aMCI had a MRI (Axial Flair, 3D T1-FFE). Nor-malized WMH and cortical volumes were measured using Pixyl.neuro and FreeSurfer and compared to usual visual scores.
Results: 110 out of 123 patients (89%) were analyzed after exclusion because of technical issues or inaccurate segmentation. WMH volumes were correlated with Fazekas’ visual scores (r=0.78). Hippo-campal volumes were correlated with Scheltens’ visual scores (r>0.63). However frontal and parietal cortical volumes were not correlated with visual scores of parietal atrophy and the gradient of fron-toparietal atrophy.
Conclusion: Automated segmentations are reliable to estimate WMH and hippocampal volumes, as visually assessed. However, automated cortical segmentation does not allow to classify frontoparietal atrophy as routinely performed in clinical practice.
14
Introduction
Alzheimer’s disease (AD) is the most common cause of dementia, affecting over 46 million
people worldwide, and may grow up to 131.5 million by 2050.
According to new IWG-2 and NIA-AA criteria for AD, magnetic resonance imaging (MRI) is
necessary for the identification of comorbidity or non-AD conditions and to characterize the
clinical phenotype (1).
In clinical practice, morphological brain imaging rules out other causes of dementia, evaluates
the severity of microangiopathy (2,3) and may strengthen the diagnosis of AD by assessing
the hippocampal atrophy (4) and the medial temporal atrophy, which is the best MRI marker
at a prodromal stage of further progression (1,5).
Hippocampal atrophy is now a widely accepted marker of AD (1,6,7). Visual assessment is
commonly used in clinical practice with a good reliability (8), even when compared to
auto-matic segmentation (6). Hippocampal atrophy is correlated with both tau deposition and
epi-sodic memory deficit (9). However, it has a low specificity. Indeed, hippocampal atrophy is
present in other dementias such as fronto-temporal lobar degeneration, and even normal
age-ing (10,11).
To better characterize cerebral structural abnormalities and improve diagnosis performances,
MRI may also provide additional features of the brain degeneration, such as parietal atrophy
(8,12,13) and microangiopathy (3). It has been established that cortical thinning is related
with white matter intensities (14,15), even though the relation is not well known.
AD dementia is an anatomically heterogeneous disease and several patterns were identified (8,16).
Using these additional imaging biomarkers among patients suspected of AD and MCI with
severe hippocampal atrophy, subgroups were identified. Some patients had a predominant
microangiopa-15 thy without predominant parietal atrophy. Interestingly, subtle changes in executive functions
and memory impairment were identified across groups (8).
All of these results were based on MRI visual rating.
When analyzing structural MRI, differences among inter- and intra-rater agreements were
identified depending on brain imaging experience and parameters (6,8). Computer-based
methods were proposed to provide volumetric quantification to assist the diagnosis, including
classification algorithms that may improve diagnosis performance, especially in less
experi-enced radiologists (17,18).
Automated cortical thickness measurements are often used to assess gray matter changes and
several software such as FreeSurfer or Cat 12 are reliable (19,20).
Yet, there is no consensus for an automated method for quantitative assessment of white
mat-ter hyperintensities (WMH) on magnetic resonance imaging and a few have been studied (21).
The objectives of this retrospective study on patients with AD and amnestic Mild Cognitive
Impairment (MCI) aimed to: i) estimate the relationships between quantitative measures of
regional cortical thinning and WMH with visual rating, ii) assess morphological heterogeneity
among patients and identify subgroups, iii) characterize neuropsychological impairment for
16
Patients and Methods
Patients
We included 123 patients who initially met either diagnostic criteria for probable AD of the
NIA-AA (7) or the research criteria for aMCI due to AD (22).
Demographics data included age, sex, and education level. Factors of cardiovascular risk were
also identified, including diabetes, hypertension, dyslipidemia, smoking, and personal history
of vascular disease.
Exclusion criteria were default MRI acquisition and inappropriate segmentation.
Among these patients, twelve patients had spinal tap to confirm the diagnosis with positive biomarkers.
Seventy-four patients had neuropsychological tests in a lap time of 6 months around the MRI.
Our standardized neuropsychological battery contained tests for attention, language, praxis,
parietal function, visuoconstructive function, verbal and visual memory, working memory,
and frontal executive function. The neuropsychological tests were the visual memory part of
Signoret battery for mnesic efficiency (BEM 84) (23), 16-item free and cued recall (24):
RL/RI-16, including the third immediate free and total recall scores, delayed free and total
recall scores, verbal intrusions score, yes/no recognition performance; forward and backward
digit span (25), the difference between forward and backward digit span, ideo-motor and
con-structive praxis, Bachy test (26), Trail Making Test (TMT) A and B (27), semantic and
alpha-betic fluency (28), a composite executive score; visuospatial and visuoperceptive tests (29).
The institutional review board approved the research protocol on 19 May 2014, IRB 5891.
MRI data acquisition
All examinations were performed on a Philips 1.5T (n=72) or 3T MRI (n=51) (ACHIEVA,
slic-17 es orthogonal to the hippocampus, axial FLAIR (4 mm), axial T2*-WI (4 mm), 3D-GRE
T1-WI (1×1×1 mm). All data were anonymized.
MRI data analysis
A. White matter hyperintensities analysis 1) Visual assessment
We retrieved visual scores previously published by Chapuis et al. (8), namely the
microangi-opathy according to the modified Fazekas’s score, ranging from 0 (no WMH) to 3 (extensive
WMH) (2). Examinations were blindly rated twice by five raters: 1 senior neuroradiologist; 1
senior neurologist; 1 junior neurologist; 2 residents in neuroradiology. Median values of all
these scores were used. For each score, median values were multiplied by 2 to keep integers.
Intra- and interrater agreements were previously detailed (8).
2) Automated segmentation
We used an original software called Pixyl.Neuro (www.pixylmedical.com, Pixyl SA,
Greno-ble, France).
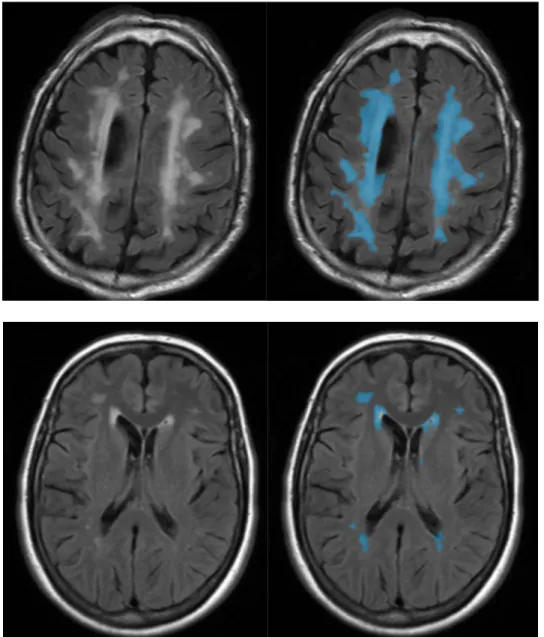
Both T1-weighted and FLAIR images are first brain-extracted using ANTs (30), denoised (31), and corrected for intensity inhomogeneities using the N4 algorithm (32). Prior anatomi-cal information is introduced into the analysis by means of a brain template and associated tissue probabilistic maps that are non-linearly registered to the subject T1 space. The T1-weighted image is co-registered to the FLAIR image using an affine transform. A T1-weighted multi-sequence Markov model (33) is then used to perform the segmentation of normal tis-sues. This algorithm also produces a weight map that indicates how well each voxel fits the model and can therefore be used to identify atypical regions. These candidate lesion voxels
18
are then extracted and processed through a set of post-processing filters to retain only voxels that correspond to characteristic WMH lesion traits.
Segmentation is illustrated in Figure 1.
Figure 1 : White matter hyperintensities segmentation with Pixyl.neuro – Left Slices correspond to native images; On right slices, blue masks correspond to automated segmentation.
All segmented WMH were visually analyzed to check the quality of segmentation.
19 3) Statistical comparisons
Statistical analyses were performed using R software (version ≥ 3.4.1). A correlation analysis was conducted to test the correlation between WMH volumes and Fazekas’ scores.
B. Parenchymal atrophy 1) Visual assessment
We retrieved the different visual scores previously published by Chapuis et al. (8):
- the hippocampal atrophy according to Scheltens’ score, ranging from 0 (no atrophy) to
4 (severe atrophy) (4);
- the parietal atrophy (PA) according to the visual rating score for posterior cortical
at-rophy, ranging from 0 (no atrophy) to 3 (severe atrophy) (12);
- the gradient of frontoparietal atrophy (GFPA) based on anteroposterior enlargement of
the medial sulci of the frontal and parietal lobes ranging from -2 (anterior
enlarge-ment) to +3 (posterior enlargeenlarge-ment) (8) The GFPA has been proposed to easily assess
the selective lobar atrophy, and especially the precuneal atrophy onto parasagittal
views.
Again, median values were used and multipled by 2 to keep integers, as previously described
20 2) Automated segmentation
We used FreeSurfer to measure cortical atrophy.
The surface-based pipeline consists of several stages (described in detail in (34,35)). First, the
volume is registered with the MNI305 (36) atlas (this is an affine registration). This allows
FreeSurfer to compute seed points in later stages. The B1 bias field is estimated by measuring
the variation in the white matter intensity. The main body of the white matter is used to
esti-mate the field across the entire volume. Likely white matter points are chosen based on their
locations in MNI305 space as well as on their intensity and the local neighborhood intensities.
The intensity at each voxel is then divided by the estimated bias field at that location in order
to remove the effect of the bias field. The skull is stripped (Figure 2A; (37)) using a
deforma-ble template model. Voxels are then classified as white matter or something other than white
matter (Figure 2B) based on intensity and neighbor constraints. Cutting planes are chosen to
separate the hemispheres from each other as well as to remove the cerebellum and brain stem.
The location of the cutting planes is based on the expected MNI305 location of the corpus
callosum and pons, as well as several rules-based algorithms that encode the expected shape
of these structures. An initial surface is then generated for each hemisphere by tiling the
out-side of the white matter mass for that hemisphere. This initial surface is then refined to follow
the intensity gradients between the white and gray matter (this is referred to as the white
sur-face). The white surface is then nudged to follow the intensity gradients between the gray
matter and CSF (this is the pial surface). The white and pial surfaces overlaid on the original
T1 weighed image are shown in Figure 2C. The distance between the white and the pial gives
21
Figure 2 Three stages from the FreeSurfer cortical analysis pipeline. A. skull stripped image. B. white matter segmen-tation. C. surface between white and gray (yellow line) and between gray and pia (red line) overlaid on the original
volume.
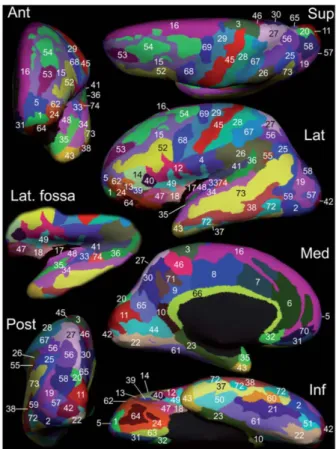
Freesurfer provided the normalized cortical thickness of 74 labels per hemisphere (sulcus or
gyri).
Segmentation is illustrated in Figure 3.
22 A visual verification of the automated segmentation was performed by a five-year trained
radiologist.
3) Statistical comparisons
We conducted correlation analyses to evaluate the relationships between qualitative and quan-titative measurements.
Hippocampal atrophy: we compared for each hemisphere Scheltens’ scores to the automated and normalized hippocampal volumes.
Parietal atrophy: we compared, for each hemisphere, the parietal atrophy visual rating score to: successively: precuneus label - the mean of cortical thickness of precuneus, superior
parietal lobule, supramarginal gyrus and postcentral gyrus - and the mean of cortical thickness
of every parietal label.
GFPA: we compared, for each hemisphere, the GFPA’s scores to successively: - the differ-ence between the cortical thickness of precuneus and superior frontal gyrus - the differdiffer-ence
between the mean of cortical thickness of precuneus, superior parietal lobule, supramarginal
gyrus and postcentral gyrus and the mean of cortical thickness of superior frontal gyrus,
mid-dle frontal gyrus and precentral gyrus, and finally the difference between the mean of cortical
23
Results
Patients’ characteristics
Among the 123 selected patients, 13 patients were excluded because of:
1. Default acquisition: Coronal T2 instead of Axial Flair images (n=1)
2. Pixyl.neuro software’s technical issues (n=4)
3. Inappropriate segmentation
o Erroneous Pyxil.neuro segmentation (n=7) due to inclusion of intra-orbital fat
or cortical bone
o Erroneous Freesurfer segmentation (n=1)
It left 110 patients to study.
Among those, 66 examinations were performed on 1.5T (60%) and 44 exams on 3T MR scan (40%).
There were 23 aMCI (20.9 %) and 87 AD patients (79.1 %), 67 women (60.9 %) and 43 men
(39.1 %). The mean age was 76 years +/- 8 (53 - 89 years).
Cardiovascular disease risk factors, age, sex, and education level did not differ between
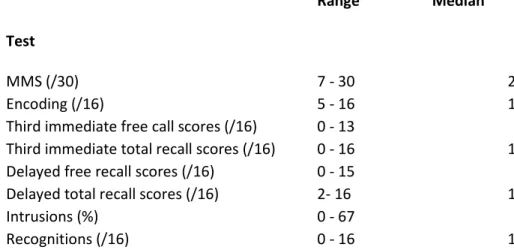
24 Neuropsychological results are summarized in Table 1.
Test
Range Median
MMS (/30) 7 - 30 23
Encoding (/16) 5 - 16 14
Third immediate free call scores (/16) 0 - 13 5
Third immediate total recall scores (/16) 0 - 16 13
Delayed free recall scores (/16) 0 - 15 5
Delayed total recall scores (/16) 2- 16 13
Intrusions (%) 0 - 67 6
Recognitions (/16) 0 - 16 15
Table 1: Patients neuropsychological main characteristics
White matter analysis
A. Visual assessment
The median value of visual assessment’s scores was 2. Median values were multiplied by two
to keep integer, so it corresponds to a score of 1 on Fazekas’ score, that is mild
microangiopa-thy.
B. Automated segmentation
White matter analysis provided the volume of brain microangiopathy lesions. Mean volume
was 17.63±15.7 ml (0.98-88 ml). Mean normalized volume with the total intracranial volume
25 C. Comparison
The correlation analysis was performed twice. First, we tested the effect of MRI strength on
lesional volumes. No difference was detected. Thus, we disregarded this parameter for WMH
analysis.
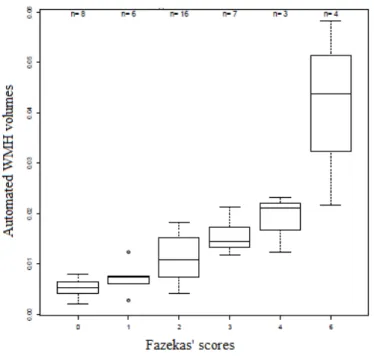
Results are illustrated in Figure 4.
Figure 4: Comparison between automated WMH volumes and Fazekas' scores - Correlation coefficient = 0.78
There is a very good correlation between the lesional volumes and the Fazekas’ scores
26
Parenchymal atrophy
A. Visual assessment
The median value of hippocampal visual assessment’s score was 5 on both right and left side.
The median value was multiplied by two to keep integer. It corresponds to a mild to moderate
hippocampal atrophy.
The median value of parietal atrophy according to the visual rating score for posterior cortical
atrophy was 3 on both right and left side. The median value was multiplied by two to keep
integer. It corresponds to a minimal to moderate parietal atrophy.
The median value of visual assessment of frontoparietal atrophy was 2 on each side. Again,
the median value was multiplied by two to keep integer. It corresponds to a mild posterior
enlargement.
B. Automated segmentation
The automated segmentation provided cortical thicknesses of the 74 regions of interest, for
each hemisphere, that is 148 values for each patient, normalized with total intracranial
vol-umes.
27 C. Comparison
The correlation analysis was performed twice. First, we tested the effect of MRI strength on
lesional volumes. No difference was detected. Thus, we disregarded this parameter for WMH
analysis.
Results are detailed in Figure 5.
Correlation coefficient = 0.63 Correlation coefficient = 0.66 Figure 5: Comparison between automated hippocampal volumes and Scheltens' scores visually assessed
Hippocampal atrophy - There is a good correlation between the hippocampal volumes and
Scheltens’ scores, with correlation coefficient Pearson r = 0.66; p < 0.001 on the left side, and
correlation coefficient Pearson r = 0.63; p < 0.001 on the right side.
Parietal atrophy - There is no significant correlation between the cortical thicknesses and the
parietal atrophy visual rating score in both hemispheres, either using precuneus label, the 4
major labels in parietal lobe or all the labels in parietal lobe: correlation coefficient Pearson r
= 0.24, 0.27 and 0.3 respectively on the left side (p > 0.05); correlation coefficient Pearson r
28
GFPA - There is no significant correlation between the cortical thicknesses in frontal and
pa-rietal lobes and the score based on anteroposterior enlargement of the medial sulci of the
frontal and parietal lobes, in both hemisphere, either using single labels, major labels in
parie-tal and fronparie-tal lobes or using all the labels in parieparie-tal and fronparie-tal lobes: correlation coefficient
Pearson r = 0.2, 0.24 and 0.38 respectively on the left side (p > 0.05); correlation coefficient
29
Discussion
Imaging plays an important role in dementia. Indeed, brain imaging is highly recommended to
conduct etiological inquiry. Besides intracranial diseases that require neurosurgical treatment,
stroke, and neurological involvement in infectious, inflammatory or metabolic diseases, brain
imaging may help to identify markers of neurodegenerative diseases such as AD. Among
those, WMH, hippocampal atrophy and parietal atrophy are currently visually evaluated. In
the recent years, several softwares were proposed to better quantify these markers. Moreover,
computerized based evaluation may help to identify pathological profiles and provide more
accurate evaluations. It could help to accelerate the diagnosis process. An early diagnosis
would allow an early treatment and would benefit the patient. Here, we compared automated
segmentation and visual assessments in patients referred for aMCI and probable AD. We
showed that automated segmentation is in line with visual evaluation of WHM and
hippo-campal atrophy. However, automated cortical segmentation was not appropriate to estimate
frontal and parietal parenchymal atrophy as visually assessed.
White Matter Hyperintensities
WMH are detected on T2/FLAIR-WI in cognitively normal subjects, MCI, AD, and other
conditions. WMH burden is associated to cardiovascular risk factors that have to be diagnosed
and cared. WMH patterns may help to identify small cerebral arteries diseases such
arteriolo-sclerosis related to chronic arterial hypertension and CADASIL. Its clinical relevance has
been debated but several studies showed its cognitive impact. Indeed, WMH burden is
associ-ated with memory impairment in AD (40) and predictive of a faster decline of global
func-tioning in non-disabled older patients (2). A systematic review and meta-analysis provides
strong evidence that white matter hyperintensities predict the risk of stroke, dementia, and
30 Our study is consistent with previous works, showing a very good correlation between
auto-matic segmentation and Fazekas’ scores (42). Here, we used a new original software that
brings support for rapid diagnosis on large population. Seven patients had to be excluded after
visual verification because of erroneous segmentation with orbital-fat or cortical bone
inclu-sion. This was due to thick slices. Pixyl.neuro usually analyses 3mm-thickness slices. In our
work, Flair sequences consisted in 4-mm-thickness slices, resulting with an inaccurate
regis-tration of T1-weighted images to Flair and partial volume effect in about 5% of cases. Visual
check of the 110 patients revealed that Pyxil.neuro segmentation tends to slightly
overesti-mate WMH size. Despite this bias related to partial volume effect on 2D FLAIR images,
le-sional volumes were correlated with Fazekas’s score.
Now, WMH evaluation ought to be performed using 3D FLAIR images instead of 2D images
(43). Indeed, thinner slices with improved signal to noise ratio, improved CSF and flow
satu-ration help to better identity WMH. Thus, improved automatic WMH segmentation is
ex-pected when using 3D Flair images (44).
Parenchymal atrophy
A. Hippocampal atrophy
Hippocampal atrophy is a sensitive but specific marker of AD (4). When present and in case
of clinical suspicion, it helps to advocate for AD (8,45). Thus, It also has been suggested that
MRI-based hippocampal volume measurement could be helpful to monitor AD progression
(45). Our study is in line with previous work which showed that hippocampal analysis was
helpful for differential diagnosis among healthy normal controls, MCI, and AD (46). This
was based on a combination of volumetry, cortical thickness, hippocampal shape, and
hippo-31 campal texture was the most important feature in the algorithm followed by hippocampal
vol-ume, ventricular volvol-ume, and parietal lobe thickness.
Consistent with previous works (47,48), our study showed good correlation between
automat-ic segmented hippocampal volume and Scheltens’ scores. Indeed, previous studies showed
that Freesurfer reported larger hippocampal volume than manual tracing, but it still allows an
accurate classification according to the degree of atrophy (0, 1, 2, 3 or 4 on Scheltens’ score).
B. Frontal and Parietal atrophy
Besides hippocampal atrophy, additional regional atrophy is helpful to better diagnose
neuro-degenerative diseases. Indeed, parietal atrophy alone or when compared to frontal atrophy
such as in gradient of frontoparietal atrophy were identified in AD (8,12). Additionally,
parie-tal atrophy and WMH rating allowed to identify cognitive subgroups among patients with
probable AD (8). We chose FreeSurfer because the cortical thickness measurements allowed
to classify subjects in subgroups of healthy elderly, MCI, and AD (49).
Here, cortical segmentation using FreeSurfer could not help to retrieve subjective parietal
atrophy visual classifications. This result is not in line with alarge multicenter study of
patho-logically proven dementias (50) which demonstrated that visual rating scores (Medial
Tem-poral, Anterior Cingulate, Orbito-Frontal, Anterior TemTem-poral, Fronto-Insula, Posterior) from
routinely acquired structural MRIs were correlated with cerebral atrophy using voxel-based
morphometry (50). Among major differences with our study on AD and patients at risk, this
study was conducted among heterogeneous demented patients, including Lewy bodies
dis-ease, early-onset AD, late-onset AD, frontotemporal lobar degeneration, and cognitively
nor-mal control subjects. Moreover, we used individual values of regional cortical thickness
32 of view, our approach is closer to clinical practice based on individual results instead of
groups comparisons.
These results are important, illustrating the limits of automatic cortical segmentation. Indeed,
visual rating of regional cerebral atrophy is mainly based on the visual assessment of enlarged
subarachnoid spaces related to both white and grey matter atrophy rather than cortical atrophy
alone. It could be proposed to segment regional CSF spaces instead of cortical thickness in
order to retrieve the visual sub-groups.
Relationship between WMH and parenchymal atrophy
The relationship between white matter and grey matter lesions is not clearly understood yet.
The second objective of this work was to study the relationship between WMH and cortical
atrophy using automated segmentation. Previously, we identified within the same population
subgroups of patients (8). Indeed, we observed that the WMH burden was inversely related to
the severity of the parietal atrophy. Causal relationships between these 2 markers are unclear.
Indeed, it seems unlikely that a disease responsible of parietal atrophy would protect against
the occurrence of WMH. Inversely, it also seems very unlikely that WMH may protect against
the occurrence of parietal atrophy.
In fact, the occurrence of WMH is associated with cerebral atrophy in healthy (51) and in
Alzheimer’s subjects (40,52).
Jacobs in 2014 (15) described a negative correlation between WMH and frontal cortical
thin-ning in AD but a positive correlation (higher level of WMH volume associated with higher
cortical thickness) in parietal lobes and in frontal lobes for MCI.
Other studies showed that microangiopathy was inversely associated with cortical thinning in
33 medial temporal lobe atrophy, but PWMH is independently correlated with hippocampal
vol-ume reduction (53).
It reveals relationship between WMH and grey matter loss is definitely not uncovered yet.
Automated analysis could not allow to retrieve the different morphological profiles and we
didn’t succeed to find a significant association between WMH and cortical thinning.
In several study, deep WMH and periventricular WMH (PWMH) were differentiated, due to
probably different origins (14,52,53) which is something we could do in forthcoming study.
Limitations of the study
The main limitations of this study were the lack pathophysiological marker of AD such as
CSF analysis or amyloid PET (1). This was due to a poor acceptance of spinal TAP in the
study group and a local difficulty to access to PET imaging at the time of the study. However,
most patients presented typical clinical phenotypes after 5 years of medical follow-up and 12
patients presented with positive CSF biomarkers. We chose to use a different cohort from
ADNI (Alzheimer’s Disease Neuroimaging Initiative) subjects to corroborate our findings. A
prospective study, integrating positive CSF biomarkers or amyloid PET, could verify our
findings.
The interest into molecular biomarkers is considerable (1,54) because there is a lot at stake for
an early AD’s diagnosis and potential early treatment. But classification accuracy on MRI
visual rating scores in the diagnosis of dementia has been shown to be comparable to the ac-curacy of the CSF beta-amyloid (Aβ1-42) (50,55). Imaging is a crucial milestone in early AD
diagnosis, particularly with automated analysis.
Number of studies demonstrated the interest, that could be very important in the future, of
computerized method (6,17,20). But a considerable issue is that automated analyses require
34 some clinicians leads to the will of doing without it (56,57). It can be argued that this area will
see prompt and substantial progress in the future allowing a routinely use of these
post-imaging analyses.
Conclusion
Automated analysis is close to visual analysis for microangiopathy and hippocampal atrophy.
But automatically measured cortical atrophy was not correlated with visually assessed frontal
and parietal atrophy. It does not allow to retrieve the visually assessed clinical and
radiologi-cal different profiles among AD and aMCI patients. Accelerating AD diagnosis means a very
significant scientific improvement and it may be presumed that there will be room for
auto-mated analysis, maybe with innovative software that measures regional white matter and CSF
volumes in addition to grey matter volume. These could be very interesting tools for
radiolo-gists in the future to reduce intra- and interrater variability, to better quantify abnormalities in
35
References
1. Dubois B, Feldman HH, Jacova C, Hampel H, Molinuevo JL, Blennow K, et al. Ad-vancing research diagnostic criteria for Alzheimer’s disease: the IWG-2 criteria. Lancet Neu-rol. juin 2014;13(6):614‑29.
2. Inzitari D, Pracucci G, Poggesi A, Carlucci G, Barkhof F, Chabriat H, et al. Changes in white matter as determinant of global functional decline in older independent outpatients: three year follow-up of LADIS (leukoaraiosis and disability) study cohort. BMJ. 6 juill 2009;339(jul06 1):b2477‑b2477.
3. Prins ND, Scheltens P. White matter hyperintensities, cognitive impairment and de-mentia: an update. Nat Rev Neurol. mars 2015;11(3):157‑65.
4. Scheltens P, Leys D, Barkhof F, Huglo D, Weinstein HC, Vermersch P, et al. Atrophy of medial temporal lobes on MRI in « probable » Alzheimer’s disease and normal ageing: diagnostic value and neuropsychological correlates. J Neurol Neurosurg Psychiatry. 1 oct 1992;55(10):967‑72.
5. Risacher SL, Saykin AJ, West JD, Shen L, Firpi HA, McDonald BC. Baseline MRI Predictors of Conversion from MCI to Probable AD in the ADNI Cohort. :16.
6. And the Alzheimer’s Disease Neuroimaging Initiative, Boutet C, Chupin M, Colliot O, Sarazin M, Mutlu G, et al. Is radiological evaluation as good as computer-based volumetry to assess hippocampal atrophy in Alzheimer’s disease? Neuroradiology. déc
2012;54(12):1321‑30.
7. McKhann GM, Knopman DS, Chertkow H, Hyman BT, Jack CR, Kawas CH, et al. The diagnosis of dementia due to Alzheimer’s disease: Recommendations from the National Institute on Aging-Alzheimer’s Association workgroups on diagnostic guidelines for Alz-heimer’s disease. Alzheimers Dement. mai 2011;7(3):263‑9.
8. Chapuis P, Sauvée M, Medici M, Serra A, Banciu E, Moreau-Gaudry A, et al. Mor-phologic and neuropsychological patterns in patients suffering from Alzheimer’s disease. Neuroradiology. mai 2016;58(5):459‑66.
9. Frisoni GB, Fox NC, Jack CR, Scheltens P, Thompson PM. The clinical use of struc-tural MRI in Alzheimer disease. Nat Rev Neurol. févr 2010;6(2):67‑77.
10. Laakso MP, Partanen K, Riekkinen P, Lehtovirta M, Helkala E-L, Hallikainen M, et al. Hippocampal volumes in Alzheimer’s disease, Parkinson’s disease with and without de-mentia, and in vascular dementia: An MRI study. Neurology. 1 mars 1996;46(3):678‑81. 11. Du A-T, Schuff N, Kramer JH, Rosen HJ, Gorno-Tempini ML, Rankin K, et al. Dif-ferent regional patterns of cortical thinning in Alzheimer’s disease and frontotemporal demen-tia. Brain. 21 nov 2006;130(4):1159‑66.
12. Koedam ELGE, Lehmann M, van der Flier WM, Scheltens P, Pijnenburg YAL, Fox N, et al. Visual assessment of posterior atrophy development of a MRI rating scale. Eur Radi-ol. déc 2011;21(12):2618‑25.
13. From the Imaging Cognitive Impairment Network (ICINET), Wahlund L-O, Westman E, van Westen D, Wallin A, Shams S, et al. Imaging biomarkers of dementia: recommended visual rating scales with teaching cases. Insights Imaging. févr 2017;8(1):79‑90.
14. Seo SW, Lee J-M, Im K, Park J-S, Kim S-H, Kim ST, et al. Cortical thinning related to periventricular and deep white matter hyperintensities. Neurobiol Aging. juill
2012;33(7):1156-1167.e1.
15. Jacobs HIL, Clerx L, Gronenschild EHBM, Aalten P, Verhey FRJ. White Matter Hy-perintensities are Positively Associated with Cortical Thickness in Alzheimer’s Disease. J Alzheimers Dis. 24 janv 2014;39(2):409‑22.
36 Alzheimer disease: Based on cortical thickness on MRIs. Neurology. 18 nov
2014;83(21):1936‑44.
17. Schmitter D, Roche A, Maréchal B, Ribes D, Abdulkadir A, Bach-Cuadra M, et al. An evaluation of volume-based morphometry for prediction of mild cognitive impairment and Alzheimer’s disease. NeuroImage Clin. 2015;7:7‑ 17.
18. Kloppel S, Stonnington CM, Chu C, Draganski B, Scahill RI, Rohrer JD, et al. Auto-matic classification of MR scans in Alzheimer’s disease. Brain. 7 févr 2008;131(3):681‑ 9. 19. Seiger R, Ganger S, Kranz GS, Hahn A, Lanzenberger R. Cortical Thickness Estima-tions of FreeSurfer and the CAT12 Toolbox in Patients with Alzheimer’s Disease and Healthy Controls: Cortical Thickness of FreeSurfer and CAT12. J Neuroimaging [Internet]. 15 mai 2018 [cité 3 août 2018]; Disponible sur: http://doi.wiley.com/10.1111/jon.12521
20. Möller C, Pijnenburg YAL, van der Flier WM, Versteeg A, Tijms B, de Munck JC, et al. Alzheimer Disease and Behavioral Variant Frontotemporal Dementia: Automatic Classifi-cation Based on Cortical Atrophy for Single-Subject Diagnosis. Radiology. juin
2016;279(3):838‑ 48.
21. Caligiuri ME, Perrotta P, Augimeri A, Rocca F, Quattrone A, Cherubini A. Automatic Detection of White Matter Hyperintensities in Healthy Aging and Pathology Using Magnetic Resonance Imaging: A Review. Neuroinformatics. juill 2015;13(3):261‑ 76.
22. Albert MS, DeKosky ST, Dickson D, Dubois B, Feldman HH, Fox NC, et al. The di-agnosis of mild cognitive impairment due to Alzheimer’s disease: Recommendations from the National Institute on Aging-Alzheimer’s Association workgroups on diagnostic guidelines for Alzheimer’s disease. Alzheimers Dement. mai 2011;7(3):270‑ 9.
23. Signoret J-L. BEM 144: Batterie d’efficience mnésique 144. Fond. IPSEN Paris Else-vier Collect. Esprit Cerveau. 1991;
24. Grober E, Buschke H, Crystal H, Bang S, Dresner. Screening for dementia by memory testing. Neurology. juin 1988;38(6):900–3.
25. Monaco M, Costa A, Caltagirone C, Carlesimo GA. Forward and backward span for verbal and visuo-spatial data: standardization and normative data from an Italian adult popula-tion. Neurol Sci. mai 2013;34(5):749‑ 54.
26. Bachy-Languedoc. Batterie d’examen des troubles en dénomination. Brux. Ed. 1989; 27. Ashendorf L, Jefferson A, Oconnor M, Chaisson C, Green R, Stern R. Trail Making Test errors in normal aging, mild cognitive impairment, and dementia. Arch Clin Neuropsy-chol [Internet]. 21 févr 2008 [cité 4 sept 2018]; Disponible sur:
https://academic.oup.com/acn/article-lookup/doi/10.1016/j.acn.2007.11.005
28. Carlesimo GA, Caltagirone C, Gainotti G, Fadda L, Gallassi R, Lorusso S, et al. The Mental Deterioration Battery: Normative Data, Diagnostic Reliability and Qualitative Anal-yses of Cognitive Impairment. Eur Neurol. 1996;36(6):378‑ 84.
29. Herrera-Guzmán I, Peña-Casanova J, Lara JP, Gudayol-Ferré E, Böhm P. Influence of Age, Sex, and Education on the Visual Object and Space Perception Battery (VOSP) In a Healthy Normal Elderly Population. Clin Neuropsychol. janv 2004;18(3):385‑ 94.
30. Avants BB, Tustison NJ, Song G, Cook PA, Klein A, Gee JC. A reproducible evalua-tion of ANTs similarity metric performance in brain image registraevalua-tion. NeuroImage. févr 2011;54(3):2033‑ 44.
31. Manjón JV, Coupé P, Martí-Bonmatí L, Collins DL, Robles M. Adaptive non-local means denoising of MR images with spatially varying noise levels: Spatially Adaptive Non-local Denoising. J Magn Reson Imaging. janv 2010;31(1):192‑ 203.
32. Tustison NJ, Avants BB, Cook PA, Yuanjie Zheng, Egan A, Yushkevich PA, et al. N4ITK: Improved N3 Bias Correction. IEEE Trans Med Imaging. juin 2010;29(6):1310‑ 20. 33. Forbes F, Doyle S, Garcia-Lorenzo D, Barillot C, Dojat M. Adaptive weighted fusion of multiple MR sequences for brain lesion segmentation. In: 2010 IEEE International
Sympo-37 sium on Biomedical Imaging: From Nano to Macro [Internet]. Rotterdam, Netherlands: IEEE; 2010 [cité 28 août 2018]. p. 69‑ 72. Disponible sur:
http://ieeexplore.ieee.org/document/5490413/
34. Fischl B, Sereno MI, Dale AM. Cortical Surface-Based Analysis. :13. 35. Dale AM, Fischl B, Sereno MI. Cortical Surface-Based Analysis. :16.
36. Collins, DL, Neelin, P., Peters, TM, and Evans, AC. Automatic 3D Inter-Subject Reg-istration of MR Volumetric Data in Standardized Talairach Space. Journal of Computer As-sisted Tomography. 1994;18(2) p192-205, 1994 PMID: 8126267; UI: 94172121.
37. Ségonne F, Dale AM, Busa E, Glessner M, Salat D, Hahn HK, et al. A Hybrid Ap-proach to the Skull Stripping Problem in MRI. :32.
38. Fischl B, Dale AM. Measuring the thickness of the human cerebral cortex from mag-netic resonance images. Proc Natl Acad Sci. 26 sept 2000;97(20):11050‑ 5.
39. Destrieux C, Fischl B, Dale A, Halgren E. Automatic parcellation of human cortical gyri and sulci using standard anatomical nomenclature. NeuroImage. oct 2010;53(1):1‑ 15. 40. Capizzano AA. White matter hyperintensities are significantly associated with cortical atrophy in Alzheimer’s disease. J Neurol Neurosurg Psychiatry. 1 juin 2004;75(6):822‑ 7. 41. Debette S, Markus HS. The clinical importance of white matter hyperintensities on brain magnetic resonance imaging: systematic review and meta-analysis. BMJ. 26 juill 2010;341(jul26 1):c3666‑ c3666.
42. Tsai J-Z, Peng S-J, Chen Y-W, Wang K-W, Li C-H, Wang J-Y, et al. Automated Segmentation and Quantification of White Matter Hyperintensities in Acute Ischemic Stroke Patients with Cerebral Infarction. Minnerup J, éditeur. PLoS ONE. 15 août
2014;9(8):e104011.
43. Paniagua Bravo á, Sánchez Hernández JJ, Ibáñez Sanz L, Alba de Cáceres I, Crespo San José JL, García-Castaño Gandariaga B. A comparative MRI study for white matter hyper-intensities detection: 2D-FLAIR, FSE PD 2D, 3D-FLAIR and FLAIR MIP. Br J Radiol. mars 2014;87(1035):20130360.
44. Anbeek P, Vincken KL, van Bochove GS, van Osch MJP, van der Grond J. Probabil-istic segmentation of brain tissue in MR imaging. NeuroImage. oct 2005;27(4):795‑ 804. 45. Schröder J, Pantel J. Neuroimaging of hippocampal atrophy in early recognition of Alzheimer´s disease – a critical appraisal after two decades of research. Psychiatry Res Neu-roimaging. janv 2016;247:71‑ 8.
46. Sørensen L, Igel C, Pai A, Balas I, Anker C, Lillholm M, et al. Differential diagnosis of mild cognitive impairment and Alzheimer’s disease using structural MRI cortical thick-ness, hippocampal shape, hippocampal texture, and volumetry. NeuroImage Clin.
2017;13:470‑ 82.
47. Schmidt MF, Storrs JM, Freeman KB, Jack CR, Turner ST, Griswold ME, et al. A comparison of manual tracing and FreeSurfer for estimating hippocampal volume over the adult lifespan. Hum Brain Mapp. juin 2018;39(6):2500‑ 13.
48. Fraser MA, Shaw ME, Anstey KJ, Cherbuin N. Longitudinal Assessment of Hippo-campal Atrophy in Midlife and Early Old Age: Contrasting Manual Tracing and
Semi-automated Segmentation (FreeSurfer). Brain Topogr [Internet]. 4 juill 2018 [cité 3 août 2018]; Disponible sur: http://link.springer.com/10.1007/s10548-018-0659-2
49. Chepkoech J-L, Walhovd KB, Grydeland H, Fjell AM, for the Alzheimer’s Disease Neuroimaging Initiative. Effects of change in FreeSurfer version on classification accuracy of patients with Alzheimer’s disease and mild cognitive impairment: Effects of Change in Free-Surfer Version. Hum Brain Mapp. mai 2016;37(5):1831‑ 41.
50. Harper L, Fumagalli GG, Barkhof F, Scheltens P, O’Brien JT, Bouwman F, et al. MRI visual rating scales in the diagnosis of dementia: evaluation in 184 post-mortem confirmed cases. Brain. avr 2016;139(4):1211‑ 25.
38 51. Wen W, Sachdev PS, Chen X, Anstey K. Gray matter reduction is correlated with white matter hyperintensity volume: A voxel-based morphometric study in a large epidemio-logical sample. NeuroImage. févr 2006;29(4):1031‑ 9.
52. Ha S-Y, Youn YC, Kim S, Hsiung G-YR, Ahn S-W, Shin H-W, et al. A voxel-based morphometric study of cortical gray matter volume changes in Alzheimer’s disease with white matter hyperintensities. J Clin Neurosci. nov 2012;19(11):1506‑ 10.
53. Jang J-W, Kim S, Na HY, Ahn S, Lee SJ, Kwak K-H, et al. Effect of White Matter Hyperintensity on Medial Temporal Lobe Atrophy in Alzheimers Disease. Eur Neurol. 2013;69:229‑ 35.
54. Ahmed RM, Paterson RW, Warren JD, Zetterberg H, O’Brien JT, Fox NC, et al. Bi-omarkers in dementia: clinical utility and new directions. J Neurol Neurosurg Psychiatry. déc 2014;85(12):1426‑ 34.
55. Ewers M, Mattsson N, Minthon L, Molinuevo JL, Antonell A, Popp J, et al. CSF bi-omarkers for the differential diagnosis of Alzheimer’s disease: A large-scale international multicenter study. Alzheimers Dement. nov 2015;11(11):1306‑ 15.
56. Shen Q, Loewenstein DA, Potter E, Zhao W, Appel J, Greig MT, et al. Volumetric and visual rating of magnetic resonance imaging scans in the diagnosis of amnestic mild cog-nitive impairment and Alzheimer’s disease. Alzheimers Dement. juill 2011;7(4):e101‑ 8. 57. Davies RR, Scahill VL, Graham A, Williams GB, Graham KS, Hodges JR. Develop-ment of an MRI rating scale for multiple brain regions: comparison with volumetrics and with voxel-based morphometry. Neuroradiology. août 2009;51(8):491‑ 503.
39
41