Science Arts & Métiers (SAM)
is an open access repository that collects the work of Arts et Métiers Institute of Technology researchers and makes it freely available over the web where possible.
This is an author-deposited version published in: https://sam.ensam.eu Handle ID: .http://hdl.handle.net/10985/9699
To cite this version :
Annie-Claude BAYEUL-LAINE, Patrick DUPONT, Giovanna CAVAZZINI, Giorgio PAVESI, Antoine DAZIN, Patrick CHERDIEU, Gérard BOIS, Olivier ROUSSETTE - Comparisons rans and urans numerical results with experiments in a vaned diffuser of a centrifugal pump - La Houille Blanche n°2, p.108-116 - 2015
Any correspondence concerning this service should be sent to the repository Administrator : archiveouverte@ensam.eu
COMPARISONS RANS AND URANS NUMERICAL RESULTS
1WITH EXPERIMENTS IN A VANED DIFFUSER OF A
2CENTRIFUGAL PUMP
34
Annie-Claude BAYEUL-LAINÉ
1, Patrick DUPONT
2, Giovanna CAVAZZINI
3,
Giorgio PAVESI
3,
5Antoine DAZIN
1, Patrick CHERDIEU
2, Gérard BOIS
1, Olivier ROUSSETTE
16
(1)
Arts et Métiers PARISTECH, LML, UMR CNRS 8107, Bd Paul Langevin, 59655 VILLENEUVE D’ASCQ-annie-claude.bayeul-7
laine@ensam.eu 8
(2)Ecole Centrale de Lille, LML, UMR CNRS 8107, Bd Paul Langevin, 59655 VILLENEUVE D’ASCQ
9
(3)
University of Padova, Energy and Fluids, Department of Industrial Engineering 10
11
The paper presents the analysis of the performance and the internal flow behaviour in the vaned diffuser of a 12
radial flow pump using PIV (particles image velocimetry) technique, pressure probe traverses and numerical 13
simulations. PIV measurements have been performed at different hub to shroud planes inside one diffuser 14
channel passage for a given rotational speed and various flow rates. For each operating condition, PIV 15
measurements have been made for different angular positions of the impeller. Probe traverses have also been 16
performed using a 3 holes pressure probe from hub to shroud diffuser width at different radial locations in 17
between the two diffuser geometrical throats. The numerical simulations were realized with the two commercial 18
codes: i-Star CCM+ 8.02.011 (RANS (Reynolds Averaged Navier Stokes) turbulence model, frozen rotor and 19
unsteady calculations), ii-CFX 10.0 (turbulence modelled with DES model (Detached Eddy Simulation) 20
combining RANS with LES (Large Eddy Simulation), unsteady calculations). Comparisons between numerical 21
(fully unsteady calculations) and experimental results are presented and discussed for two flow rates. In this 22
respect, the effects of fluid leakage due to the gap between the rotating and fixed part of the pump model are 23
analysed and discussed. 24
KEYWORDS: Pump, diffuser, PIV measurements, numerical calculations, probes 25
Comparaisons de différents modèles numériques à des résultats
26
expérimentaux dans un diffuseur aubé de pompe centrifuge
27
L’analyse des performances et de l’écoulement interne dans un diffuseur aubé de la pompe centrifuge SHF 28
(testée en air) fait l’objet de ce papier. La particularité de cette pompe est qu’il n’y a pas de volute à l’aval de 29
telle sorte que l’écoulement refoule à l’air libre. Une caractéristique de ce diffuseur est que son débit nominal 30
correspond à 80% du débit nominal de la roue. L’analyse des performances est réalisée grâce à la technique PIV 31
(Vélocimétrie par images de particules), aux sondes de pression trois trous et aux simulations numériques. Les 32
mesures PIV ont été réalisées pour différents plans entre le carter et le moyeu dans un canal du diffuseur, pour 33
une vitesse de rotation de roue fixée, et différents débits. Dans chaque cas, les mesures PIV ont été effectuées 34
pour sept différentes positions angulaires de la roue, deux positions seulement sont ici présentées. Des sondes 35
de pression trois trous ont également été utilisées dans le diffuseur à différentes positions radiales et axiales, en 36
entrée et sortie du diffuseur et dans le canal inter-aubes. Les simulations numériques ont été réalisées à l’aide de 37
deux codes de calcul: i-Star CCM+ 8.02.011 (modélisations RANS en « frozen rotor » et en calculs 38
instationnaires), ii-CFX 10.0 (calculs instationnaires, modélisation de la turbulence par DES combinant un 39
modèle RANS avec la LES ). Les mesures réalisées avec les sondes trois trous et les résultats des simulations 40
numériques donnent des informations sur les évolutions des coefficients de pressions statiques et dynamiques. 41
On a pu constater que les performances globales de la machine dépendaient peu des débits de fuite. D’un point 42
de vue local, seules les vitesses radiales et tangentielles sont ici comparées. Les courbes vr en fonction du rayon,
43
dans le canal inter-aubes du diffuseur, pour deux débits encadrant le débit nominal de la roue, montrent que les 44
résultats expérimentaux sont en bonne correspondance avec la courbe de simulation numérique tenant compte 45
de fuites entre le diffuseur et la roue. L’analyse quantitative des iso valeurs vr et vu donne une idée des
46
structures présentes dans le diffuseur. 47
MOTS CLES : pompes, diffuseur, mesures PIV, modélisation, sondes 48
I INTRODUCTION 49
Flow behaviour in a radial machine is quite complex and is strongly depending on rotor stator interactions
50
and operating conditions [Adamczyk et al, 1994, Arndt et al, 1990, Eisele et al, 1997].
Experimental intrusive and non-intrusive standard techniques (pressure transducers, hot wire anemometers,
52
laser techniques: Laser Doppler Velocimetry (L.D.V.) and Particle Image Velocimetry (P.I.V.)) allow the
53
knowledge of the flow field due to rotor-stator interactions. Many experiments were conducted to measure
54
pressure fluctuations inside the diffuser of radial pumps by Arndt et al. [1990], Furukawa et al. [2003], Guo
55
and Maruta [2005], Pavesi et al. [2008] and the details of wake transport across the rotor were tracked in
56
continuously running facilities thanks to laser techniques (Akin et al, 1994, Eisele et al, 1997, Akhras et al,
57
2004, Feng et al ,2007, Benra et al, 2008, Wuibaut et al, 2000, 2006)
58
In numerical simulations, two aspects have to be considered:
59
- the first one concerns the governing equations which are solved in the model: three kinds of numerical
60
calculations are currently used in turbo machinery: i-frozen rotor calculations, ii-mixing plane calculations,
61
iii-unsteady calculations. The frozen rotor is the steady state method which uses the rotating reference frame
62
to save the computational resources by converting inherently transient turbo-machinery flow into steady
63
state. The difference between frozen rotor and mixing plane is that mixing plane mixes the flow and applies
64
the average quantities on the interface for upstream and downstream components, while frozen rotor will
65
pass the true flow to downstream and vice versa. So if the wake effect on the downstream component
66
performance is necessary, the frozen rotor method has to be used. A big disadvantage is that, it gives the
67
solution at a single relative position. The true transient method gives the wake effect on the downstream
68
component for all relative positions (as happens in reality) [Culver et al, 2009, Petit et al, 2013, Tamm et al,
69
2002]
70
- the second aspect concerns the geometrical model. Some geometrical simplifications are currently used.
71
For example, the leakage flows are often neglected. It is obvious that a complex model (fully unsteady, with
72
leakage flows) will be more time consuming but closer to the real physics.
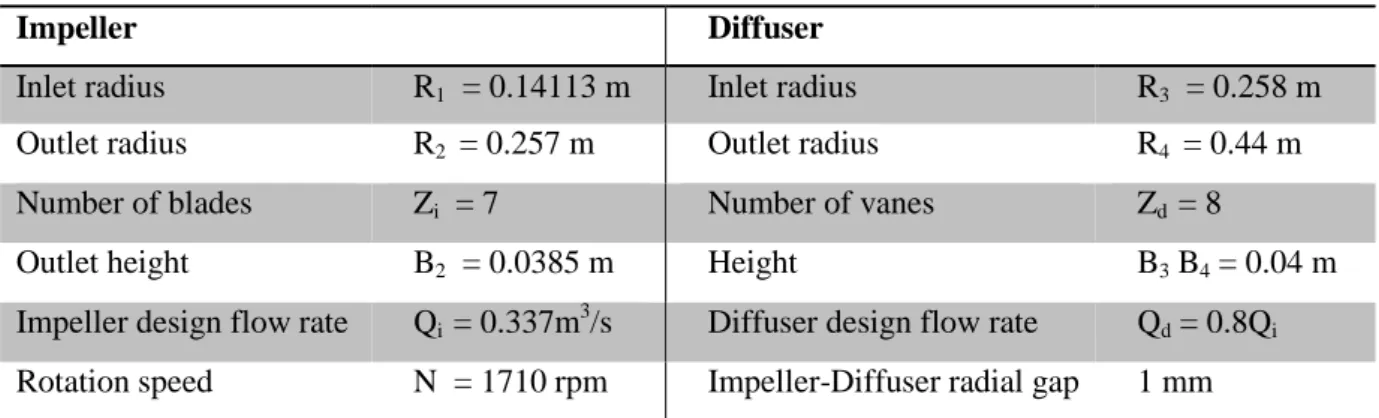
73
In this paper, some limits of the numerical models are pointed out. To do so, results of several numerical
74
calculations have been used: i-Frozen rotor without leakage (Star CCM+), ii-Unsteady RANS calculations
75
without leakage (Star CCM+), iii- Unsteady DES (detached eddy simulation) calculations with and without
76
leakage (CFX). These numerical results are compared to experimental results for several flow rates to try to
77
evaluate the effects of the numerical models on the prediction of the performance and on the local behaviour
78
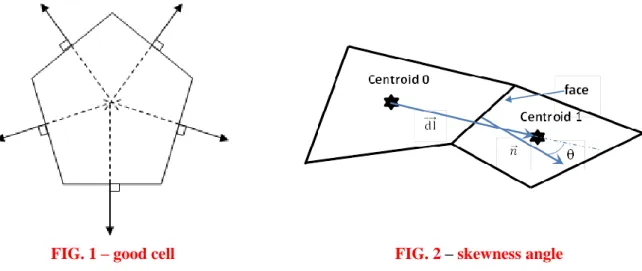
of the flow.
79
The test model corresponds to the so-called SHF pump, working with air, in similarity conditions compared
80
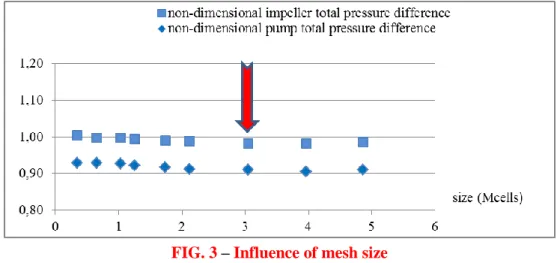
to water, for which several studies have been made [Dazin et al,2008, 2011, Cavazzini, 2006, Cavazzini et al,
81
2009, 2011, Wuibaut et al, 2000, 2006] involving numerical and PIV comparisons.. The existing database
82
has been completed by pressure probe measurements in the vaned diffuser of the pump model for a more
83
complete performance analysis.
84
II EXPERIMENTS 85
II.1 Test and apparatus 86
Table 1: Pump characteristics 87
Impeller Diffuser
Inlet radius R1 = 0.14113 m Inlet radius R3 = 0.258 m
Outlet radius R2 = 0.257 m Outlet radius R4 = 0.44 m
Number of blades Zi = 7 Number of vanes Zd = 8
Outlet height B2 = 0.0385 m Height B3 B4 = 0.04 m
Impeller design flow rate Qi = 0.337m
3
/s Diffuser design flow rate Qd = 0.8Qi
Rotation speed N = 1710 rpm Impeller-Diffuser radial gap 1 mm
88
Test pump model and PIV measurements conditions have been already described in several papers
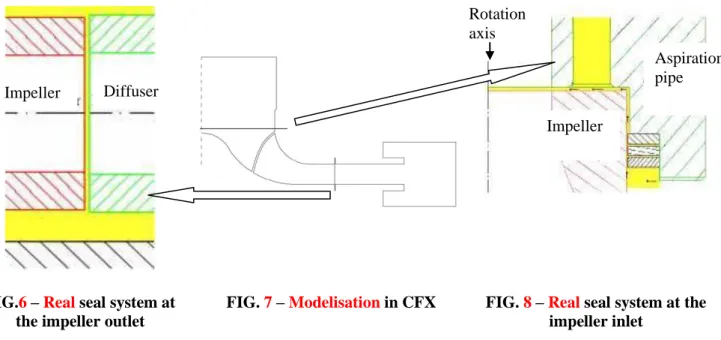
89
[Cavazzini , 2006, Cavazzini et al 2009] and main pump characteristics are given in table 1. This set-up
90
allows the existence of a “positive” leakage flow going into the gap between impeller outlet section and inlet
vaned diffuser section which is specific to the experimental set-up. This is due to the fact that the pump
92
outlet corresponds to atmospheric conditions.
93
The PIV results come from G. Cavazzini PhD Thesis, [2006].
94
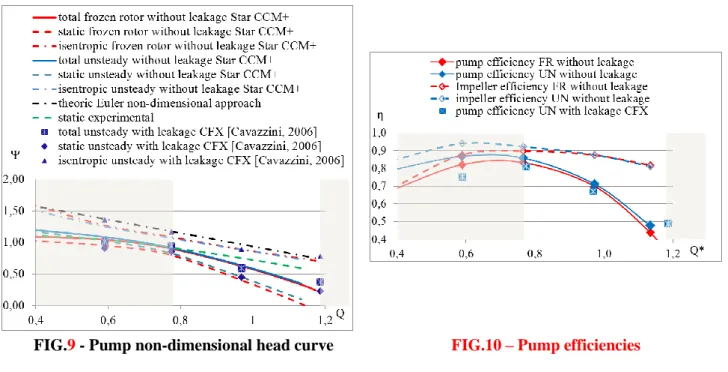
II.2 Three holes probes 95
A three holes probe has been used to make hub to shroud traverses. Using a specific calibration one can get
96
total pressure, static pressure, absolute velocity and its two components in radial and tangential direction.
97
In order to well represent the flow field, twenty-three probe locations are defined as it can be seen in
98
figure 4. For each location, ten axial positions are registered (b*=0.125, 0.2, 0.25, 0.375, 0.5, 0.625, 0.75,
99
0.875, 0.925, 0.975 from hub to shroud). The present analysis focuses only on locations 19 to 23 in the blade
100
to blade diffuser channel.
101
II.3 General flow conditions 102
All types of measurements have been performed for several flow rates. But, results presented in this paper
103
refer only to two flow rates. The first one close to the design point of the vaned diffuser Q*=0.766 which is
104
different from the non-dimensional impeller design flow rate Q*=1 (the vaned diffuser design was chosen in
105
order to allow an enlarge pump performance characteristic curve for low flow rates). The second normalised
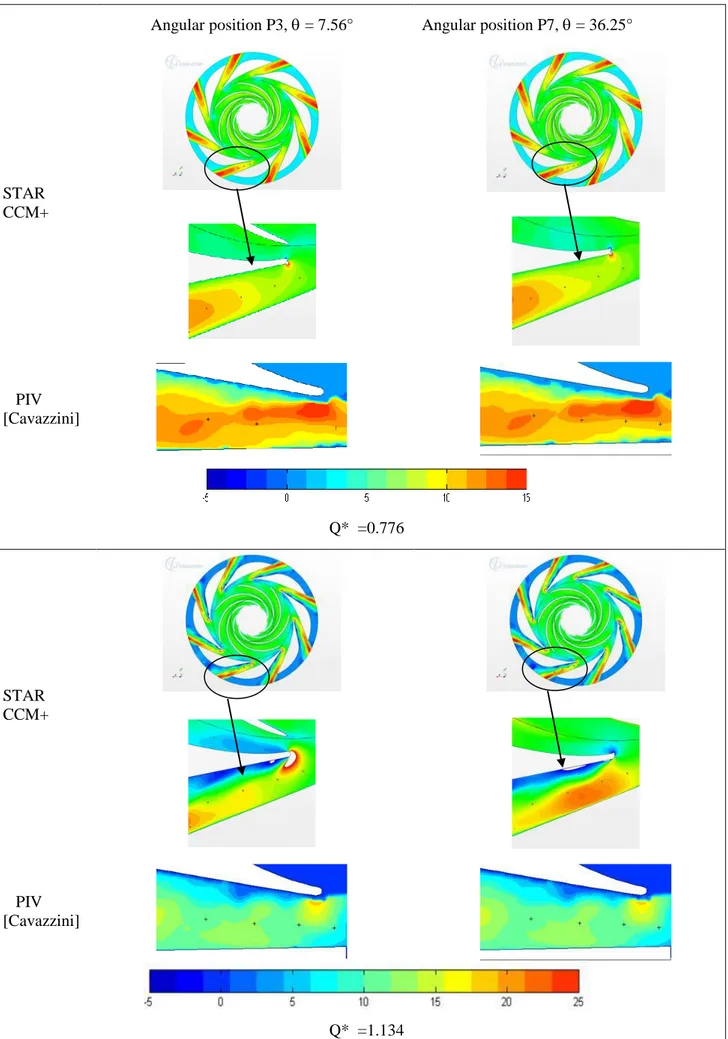
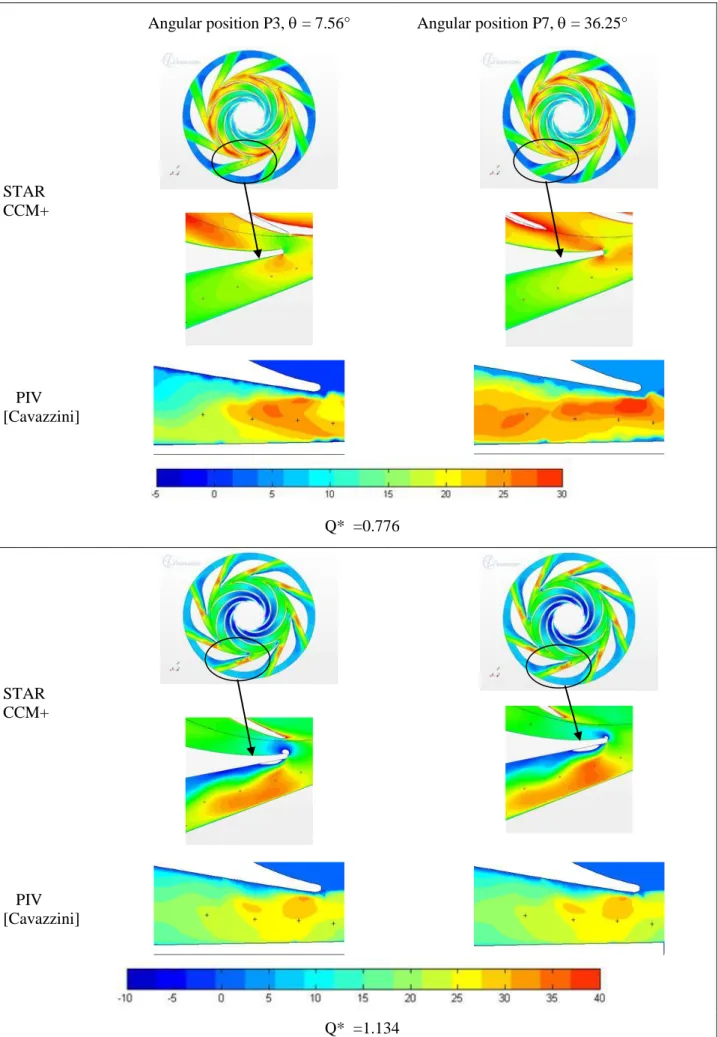
106
flow rate is equal to 1.134.
107
III CALCULATIONS 108
Frozen rotor and unsteady calculations were performed using Star CCM+ code and results are compared
109
with already published CFX results [Cavazzini, 2006, Cavazzini et al, 2009, 2011].
110
III.1 Frozen rotor and unsteady calculations on a simplified geometry without leakage (Star CCM+)
111
The calculation domain was divided into three zones: the inlet zone, the impeller zone and the diffuser
112
zone. The boundary condition at the inlet consisted of a flow rate. The boundary condition at the outlet was
113
the atmospheric pressure. The fluid (air) was considered incompressible at a constant temperature of 20ºC.
114
A polyhedral mesh with prism layers is used for all calculations (5 prism layers for a total prism layer
115
thickness of 1 mm).
116 117
FIG. 1 – good cell FIG. 2 – skewness angle
The quality of the mesh can be evaluated by some parameters like face validity, cell quality, skewness
118
angle…In Star CCM+, the volume mesh is built from the surface mesh which is always a triangular mesh.
119
The quality of this triangular mesh is such that the face validity is equal to 1 for all cells. This means that all
120
face normal vectors are correctly pointing away from the cell centroid, so all cells are good cells as can be
121
seen in figure 1. The face validity is an area-weighted measure of the correctness of the face normal vectors
122
relative to their attached cell centroid.
The cell quality metric algorithm is based on a hybrid of the Gauss and least-squares methods for cell
124
gradient calculation methods. It depends on the relative geometric distribution of the cell centroids of the
125
face neighbour cells and also on the orientation of the cell faces. In the present paper, the major part of cells
126
has a cell quality in the range of 0.7 and 1.
127
The skewness angle is the angle between the face area vector n (face normal) and the vector connecting
128
the two cell centroids, dl as can be seen in figure 2. All cells have a skewness angle lower than 85 degrees
129
which is necessary in order to reduce the impact of robustness and the major part (98%) of cells have a
130
skewness angle in the range of 0 and 30 degrees.
131
The influence of the mesh size was studied in the case of frozen rotor calculations and for the
non-132
dimensional mass flow rate of Q*=0.766 by modifying the size of the base size which is a reference size. As
133
can be observed in figure 3, the non-dimensional increase of total pressure inside the impeller and inside the
134
pump don’t change significantly for base sizes greater than 0.5 m which corresponds to a grid size of about
135
3. 106 cells. This base size corresponds to a target size of 3 mm and a minimum size of 0.5 mm.
136 137
138
FIG. 3 – Influence of mesh size
139 140
Table 2 : Angular blade positions relative to one diffuser vane 141
P1 P2 P3 P4 P5 P6 P7
Angular positions (deg) 38.16 45.34 7.56 14.70 21.88 29.07 36.25
FIG. 4 - Diffuser measurement locations for probe traverse and unsteady calculations
FIG.5 - Impeller different angular positions relative to the diffuser vanes
142
The SST k- turbulence model is used.
143
Line probes (9 locations) are plotted as defined in figure 4 in order to obtain all parameters (pressure, total
144
pressure, radial, tangential and axial velocity and velocity magnitude) for 7 different impeller angular
positions relative to the diffuser vanes (Figure 5, Table 2). In this paper, P3 and P7 are the only positions
146
presented and discussed.
147
The convergence criteria are less than 1.e-4. Maximum values of y+ are around 15, and mainly below 9 in
148
the whole computational domain. A time step, corresponding to an angular rotation of 1°, has been chosen.
149
In this part, fluid leakages are not taken account.
150
III.2 DES calculations with and without leakages 151
In order to investigate the influence of leakage flows, numerical results obtained using CFX are also
152
presented. G. Cavazzini et al [2009, 2011] proposed two kinds of unsteady simulations, with and without
153
leakage flows. The models and mesh were already presented in previous paper [G. Cavazzini 2009, 2011]
154 155
FIG.6 – Real seal system at the impeller outlet
FIG. 7 – Modelisation in CFX FIG. 8 – Real seal system at the impeller inlet
156
As regards the simulations, the leakage flows inside the seal systems (figure 6 & 8) both at the impeller
157
inlet and outlet taken into account (Figures 6-8). They were estimated by a 1D loss calculations based on the
158
experimental pressure measurements. They were then prescribed as an inlet boundary conditions in the gap
159
between the inlet pipe and the diffuser as well as in the one between the impeller and the diffuser (figure 7), ,
160
assuming stochastic fluctuations of the velocities with 5 % free-stream turbulence intensity Much more
161
details on model, mesh and numerical simulations are reported in ref [Cavazzini et al, 2009].
162
IV RESULTS AND COMPARISONS 163
IV.1 Pump performances 164
The numerical, experimental and theoretical performances of the pump are plotted in figure 9. All models
165
give similar pump heads (isentropic, static, total). Furthermore, for the isentropic pump heads, the results are
166
slightly lower than the theoretical curve which has been obtained by Euler non-dimensional approach. This
167
means that both models predict correctly the global behaviour of the flow in the impeller.
168
One can note that the numerical static pressures underestimate the experimental pressure rise, whatever the
169
numerical scheme adopted. This is particularly obvious for Q/Q*>1. At these flow rates, previous studies
170
[Cavazzini, 2006, Cavazzini et al, 2009, Wuibaut, 2000] have shown a strong boundary layer detachment at
171
the diffuser vane leading edge. The calculations may have some difficulties to predict correctly the flow
172
behaviour in these regions and thus overestimate the losses linked with these phenomena. One can
173
nevertheless note that the consideration of the leakages seems to improve slightly the performance
174
prediction.
175
The efficiencies are plotted figure 10. It can be noticed that the frozen rotor calculations overestimates the
176
impeller efficiencies at partial flow rates probably because this kind of calculation is unable to predict
177
correctly the unsteady phenomena occurring in the runner at these operating points. It can also be seen that
178 Impeller Diffuser Impeller Rotation axis Aspiration pipe
the pump efficiency falls at high flow rate. This is due to the very bad diffuser efficiency at these flow rates,
179
because of the great desadaptation of the flow in the diffuser for this operating conditions. (It can be
180
reminded that the diffuser design flow rate is Q*=0.766)
181 182
FIG.9 - Pump non-dimensional head curve FIG.10 – Pump efficiencies
IV.2 Velocity profiles 183
Local results are analysed for unsteady calculations, three holes probes and PIV measurements.
184
Figure 11 gives the contours of radial velocities, for b*=0.5 at mid height inside the diffuser channel
185
passage for two angular positions P3 and P7 of the impeller and for two mass flow rates : i-the diffuser
186
design flow rate, ii- a higher mass flow rate, upper that the design mass flow rate of impeller. Figure 8 shows
187
the contours of tangential velocities in the same conditions than figure 11. The PIV experiments are
188
compared to unsteady Star CCM+ calculations.
189
The radial and tangential velocity contours at the diffuser design flow rate and for the two angular
190
positions of the impeller are very similar for the numerical results and the PIV measurements, but with a
191
lower magnitude of velocities in case of calculation. The examination of the contours of tangential velocity
192
for the same flow rate and for the two angular positions leads to same comments. This tendency has also
193
been observed for other value of b* by comparison between numerical calculation and between PIV done by
194
G. Cavazzini [2006]. As the experimental results have been performed with pump configuration with
195
leakage, it can be supposed that there is a positive leakage between impeller and diffuser.
196
On the contrary, it has been observed, for the radial and tangential velocities contours for high flow rate that
197
the tendency inverses. So it can be supposed that fluid leakages are negative in this case.
198
Radial velocity evolutions of unsteady calculations without leakage (obtained from the two different codes:
199
“CCM+” and “CFX 1”), and unsteady calculations with leakage (obtained only from CFX [Cavazzini et al,
200
2011]: “CFX 2”) are presented in figures 13 and 14 for both flow rates. PIV measurements (“PIV”), and
201
three-hole pressure probes (“probes”) results are plotted on the same figures. Results present time-averaged
202
values of radial velocities distribution from hub to shroud section as a function of radius.
203
The influence of leakage can be confirmed when comparing numerical results obtained without and with
204
leakage. Experimental results are in better agreement with calculations obtained with leakage. This can be
205
mainly observed on radial velocity distribution shown in figures 13 and 14. For Q*=0.776, the mean relative
206
difference between experimental and unsteady calculations radial velocities is about 30% for calculations
207
without leakage and 13% for calculations with leakage. On the contrary for Q*= 1.134 numerical results
208
without leakage are higher than experimental ones. The mean relative difference is about -17% for
209
calculations without leakage and 5% for calculations with leakage.
210
These results must be more deeply analysed, in particular PIV ones; they strongly depend on impeller
211
position during its rotation and only time-averaged values are presented here. Pressure probe results are also
212
depending on unsteady effects and this has to be taken into account for further data reduction analysis
Angular position P3, = 7.56° Angular position P7, = 36.25° STAR CCM+ PIV [Cavazzini] Q* =0.776 STAR CCM+ PIV [Cavazzini] Q* =1.134
FIG. 11 - Contours of radial velocities Vr (m/s)– b*=0.5 214
Angular position P3, = 7.56° Angular position P7, = 36.25° STAR CCM+ PIV [Cavazzini] Q* =0.776 STAR CCM+ PIV [Cavazzini] Q* =1.134
FIG. 12 - Contours of tangential velocities Vu (m/s)– b*=0.5 215
216 b*=0,125 b*=0,250 b*=0,500 b*=0.750 b*=0.875
FIG. 13 - Non-dimensional radial velocity Vr* with R* - Numerical-Experimental comparisons in horizontal cut planes - Q*=0.776
FIG. 14 - Non-dimensional radial velocity Vr* with R* - Numerical-Experimental comparisons in horizontal cut planes- Q*=1.134
V CONCLUSIONS 217
Comparisons between two numerical 3D approaches, three holes probes and PIV measurements have been
218
presented inside the diffuser of a centrifugal impeller at different cut planes inside the diffuser. Two different
219
impeller blade positions were considered. Two flow rates were studied. The contours of radial and tangential
220
velocity at mid height as well as the time-averaged values of radial velocity distributions underline leakage
221
to be an important parameter that has to be taken into account in order to make good comparisons between
222
numerical and experiments.
223
Henceforth, simulations with fluid leakages will be realized and unsteady probes will be used in order to
224
confirm these previous results. These calculations show few influence of taken account fluid leakage on
225
global performance but a real improvement concerning velocity distributions.
VI NOMENCLATURE 227
b [m] Distance from hub
b* b/B [-] Non-dimensional distance from hub
B [m] Blade height
C [mN] Impeller torque
dps Psi-ps0
dpt pti-pt0 [Pa] Total difference pressure
N [rpm] Rotation speed
p [Pa] Pressure
pt [Pa] Total pressure
Q* Q/Qi [-] Non-dimensional volume flow rate at impeller’s inlet
Qd [m
3
/s] Diffuser design flow rate
Qi [m
3
/s] Impeller design flow rate
R [m] Radius
R* R/R2 [-] Non-dimensional radius
vr [m/s] Radial velocity
Vr* vr/U2 [-] Non-dimensional radial velocity
vu [m/s] Tangential velocity
Vu* vu/U2 [-] Non-dimensional tangential velocity
U2 R2 [m/s] Frame velocity at impeller outlet
Zd [-] Number of diffuser blades
Zi [-] Number of impeller blades
[kg/m3] Air density
[rad/s] Angular Velocity
s dps/(U2
2
/2) [-] Non-dimensional static pump head
t dpt/(U2
2
/2) [-] Non-dimensional total pump head
i CQ U2
2
/2) [-] Non-dimensional isentropic head
Index 0 Domain inlet
1 Impeller inlet 2 Impeller outlet 3 Diffuser inlet 4 Diffuser outlet VII REFERENCES 228
Adamczyk J. J., Celestina M. L., Chen J. P. 1994, - Wake induced unsteady flows :their impact on rotor
229
performance and wake rectification ASME International Gas Turbine and Aeroengine Congress and
230
Exposition, The Hague, Netherlands, June 13-16, paper 94GT219. 231
Akin O., Rockwell D.O. 1994 -Interaction of zones of flow separation in a centrifugal impeller-stationary
232
vane system. Exp. Fluids. 17 427-433
233
Akhras A., El HajemM., Champagne J.-Y., Morel R. 2004 - The flow rate influence on the interaction of a
234
radial pump impeller and the diffuser. Int. J. Rotating Mach. 10(4) 309-317
Arndt N., Acosta A.J., Brennen C.E., Caughey T.K 1990 - Experimental Investigation of Rotor – Stator
236
Interaction in a Centrifugal Pump With Several Vaned Diffusers ASME Journal of Turbomachinery,
237
Vol. 112, p. 98-108. 238
Benra F. K., Feng J., Dohmen J. (2008) - PIV Measurements of Unsteady Flow in a Diffuser Pump at
239
Different Flow Rates. 12th ISROMAC, Hawaii, USA, February. 17-22
240
Cavazzini G 2006- Experimental and numerical investigation of the rotor-stator interaction in radial
241
turbomachines, Ph.D. thesis, University of Padova, Padova, Italy
242
Cavazzini G., Pavesi G., Ardizzon G., Dupont P., Coudert S., Caignaert G., Bois G. 2009 - Analysis of the
243
rotor-stator interaction in a radial flow pump Houille blanche – revue internationale de l’eau p. 141-151
244
Cavazzini G., Dupont P., Pavesi G., Dazin A., G.Bois, Atif A., Cherdieu P. 2011 - Analysis of unsteady
245
flow velocity fields inside the impeller of a radial flow pump : PIV measurements and numerical
246
calculation comparisons Proc. of ASME-JSME-HSME Joint fluids engineering conference July 24-29,
247
Hamamatsu, Japan
248
Culver R., Liu F. 2009 – Plane Method for Flutter Computation in Multi-stage Turbomachines 47th AIAA 249
Aerospace Sciences Meeting Including The New Horizons Forum and Aerospace Exposition January5-250
8, Orlando, Florida
251
Dazin Antoine; Coutier Delgosha Olivier; Dupont Patrick; Coudert Sébastien; Caignaert Guy; Bois Gérard
252
2008 - Rotating Instability in the Vaneless Diffuser of a Radial Flow Pump Journal of Thermal Science
253
17 (4) 368-374 254
Dazin Antoine; Cavazzini Giovanna; Pavesi Giorgio; Dupont Patrick; Coudert Sébastien; Ardizzon Guido;
255
Caignaert Guy; Bois Gérard 2011 - High-speed stereoscopic PIV study of rotating instabilities in a
256
radial vaneless diffuser Exp Fluids 51(1) 83-93
257
Eisele K., Zhang Z., Casey M. V., Gülich J., Schachenmann A. 1997 - Flow analysis in a Pump Diffuser Part
258
1 : LDA and PTV Measurements of the Unsteady Flow Transactions of ASME, Journal of Fluids
259
Engineering, Vol. 119, p. 968-977 260
Feng J., Benra F, Dohmen H., 2007, Numerical Investigation on Pressure Fluctuations for Different
261
Configurations of Vaned Diffuser Pumps. International Journal of Rotating Machinery Volume 2007
262
(2007), Article ID 34752, 10 pages 263
Furukawa A., Takahara H., Nakagawa T., Ono Y. 2003 - Pressure fluctuation in a vaned diffuser
264
downstream from a centrifugal pump impeller. Int. J. Rotating Mach. 9(4) 285-292
265
Guo S., MarutaY. 2005 - Experimental investigations on pressure fluctuations and vibration of the impeller
266
in a centrifugal pump with vaned diffusers. JSME Int. J., Ser. B. 48(1) 136-143
267
Pavesi G., Cavazzini G., Ardizzon G. [2008] Time-frequency Characterization of the Unsteady Phenomena
268
in a Centrifugal Pump. Int. J. Heat and Fluid Flow. 29 1527-1540
269
Petit O., Nilsson H. 2013 – Numerical Investigations of Unsteady Flow in a Centrifugal Pump with a vaned
270
Diffuser International Journal of Rotating Machinery, Vol. 2013, Article ID 961580, 14 pages
271
Tamm A., Gugau M., Stoffel B.2002 – Experimental and 3-D Numerical Analysis of the Flow Field in
272
Turbomachines- Part I International Congress on Quality Assesment of Numerical Simulations in
273
Engineering, Conception – Chile 274
STAR CCM+ user guide
275
Wuibaut G., Dupont P., Caignaert G., Stanislas M. 2000 - Experimental analysis of velocities in the outlet
276
part of a radial flow pump impeller and the vaneless diffuser using particle image velocimetry
277
Proceedings of the XX IAHR Symposium, Charlotte (USA), 6-9 august, paper GU-03. 278
Wuibaut G., Bois G., El Hajem M., Akhras A., Champagne J. Y.2006 - Optical PIV and LDV “Comparisons
279
of Internal Flow Investigations in SHF Impeller, Int. J. of Rotating Machinery, Vol. 2006, p. 1-9