UMR 225 IRD - Paris-Dauphine
UMR DIAL 225
D
OCUMENT DE
T
RAVAIL
DT/2015-05
Migration and Employment
Interactions in a Crisis Context: the
case of Tunisia
Anda DAVID
Mohamed Ali MAROUANI
MIGRATION AND EMPLOYMENT INTERACTIONS IN A CRISIS CONTEXT: THE CASE OF TUNISIA
Anda David
PSL, Université Paris-Dauphine,
LEDa, IRD UMR DIAL, 75016 Paris, France [email protected]
Mohamed Ali Marouani
Paris 1 Pantheon-Sorbonne University, DIAL and ERF
Document de travail UMR DIAL
Mars 2015 Abstract
This article analyses how a crisis impacts labor markets in origin countries through migration channels. For this purpose, we develop a novel dynamic general equilibrium model with a focus on the interlinkages be- tween migration, the labor market and education. The main innovation of the paper is the retrospective modeling in general equilibrium of the impact of an economic crisis to isolate the impact of migration on local unemployment. The impact of the crisis on education decision is captured through endogenous returns to education. The simultaneity of the crisis in Tunisia and its partners worsened the labour market situation mainly through the increase in labour supply. The main result is that migration is indeed one of the main determinants of the unemployment increase and that remittances have a higher impact than the variation of emigration flows. The low skilled bear the highest costs in terms of unemployment and wage decline.
Key words: International migration, remittances, labour supply, CGE, Tunisia. Résumé
Cet article s’intéresse à la manière dont une crise affecte le marché du travail des pays d’origine, à travers la migration. A cet effet, nous développons un modèle d’équilibre général dynamique mettant l’accent sur les interactions entre migration, marché du travail et éducation. La principale innovation de l’article est la modélisation rétrospective en équilibre général de l’impact d’une crise économique, en isolant l’effet de la migration sur le chômage local. L’impact de la crise sur l’accumulation de capital humain est capté via l’endogénéisation des rendements de l’éducation. La simultanéité de la crise en Tunisie et dans les pays partenaires a aggravé la situation sur marché du travail tunisien, principalement à travers l’augmentation de l’offre de travail. Le principal résultat est que la migration est en effet l’un des principaux déterminants de l’augmentation du chômage et que les transferts de fonds ont un impact plus important que la variation des flux d’émigrants. En outre, les travailleurs les moins qualifiés ont été les plus affectés en termes de chômage et de baisse des salaires.
Mots Clés : Migration internationale, transferts de fonds, offre de travail, équilibre général calculable, Tunisie.
1 Introduction
Tunisia has been characterized by high and persistent unemployment rates (around 15 percent) over the last decade, despite a sustained growth rate averaging 5 percent. By decreasing the growth rate to 3 percent, the global crisis worsened the labour market situation. The number of graduates increased at a very high pace, without an increase of high skilled job opportunities. This resulted in high unemployment rates for educated youth which were among the main reasons of the Tunisian revolution in December 2010. The economic recession that followed induced a peak in unemployment and emigration to Europe, exacerbated by the weakening of the Government’s border control.
Moreover, the global crisis reduced the demand for foreign workers and the opportu-nities of mobility. The evolution of receiving countries’ wages also has an impact on the decision to migrate and may affect the supply of migrants in terms of volume and dura-tion (Stark et al.,1997). Labour market outcomes in sending countries are also affected by remittances variation. If we assume following Rapoport and Docquier (2006) that the remittance rate increases with migrants’ incomes and decreases with their families’ incomes, an asymmetric variation of economic conditions will affect labour participa-tion in Tunisia. A differentiated evoluparticipa-tion of exchange rates and inflaparticipa-tion can have a similar impact (Yang,2008). Thus, a relative decrease of foreign wages can affect un-employment in Tunisia through a lower labour demand and a higher labour supply.
This article aims at assessing how a crisis impacts a sending country’s labour mar-ket through migration channels. For this purpose, we develop a novel dynamic general equilibrium model with a focus on the interlinkages between migration, the labour mar-ket and education. We show how these channels operate when the crisis occurs in the sending or the receiving country. The recent period offers a natural experiment where receiving economies are first relatively more affected by the global crisis. Subsequently, the Tunisian uprisings entail a reversal of the situation with the severe recession in the sending country. The main innovation of the paper is the retrospective modeling in gen-eral equilibrium of the impact of an economic crisis to isolate the impact of migration on local unemployment. Furthermore, we explicitly decompose the unemployment varia-tion into labour demand and labour demand effects. Finally the impact of the crisis on the education decision is captured through endogenous returns to human capital.
migra-tion on employment levels by skill, sector and age. To illustrate the framework, we first simulate what would have been the migration and employment outcomes in the absence of the global crisis and the Tunisian revolution to highlight their effects on the Tunisian labour market. The model also allows us to assess the effects of migration on education through its impact on relative wages between skilled and unskilled workers (Stark et al., 1997). We highlight the pure effect of migration by conducting additional experiments where we assume that migration and remittances do not vary.
Section 2 presents a brief literature review. Section 3 describes the model. Section 4 discusses migration and labour market issues in Tunisia as well as the database and the model calibration. In section 5 we conduct the counterfactual experiments. The final section summarizes the main messages from the analysis.
2 A brief literature review
Interest in the emigration impact on the home country’s labour market is increasing (Hanson,2009), despite studies on the impact of migration on host countries remaining dominant. The outflow of workers has various effects, depending on workers’ skill composition and their substitutability or complementarity (Hanson, 2010). Adapting the framework proposed by Borjas (2003) to a sending country case, Mishra (2007) uses a microeconomic framework and estimates that the decrease in the Mexican labour supply between 1970 and 2000 due to emigration increased the wage level by 8 percent. With a more detailed approach, Aydemir and Borjas (2007) show that due to the skill composition of the Mexican emigration, relative wages increased for the medium skilled and decreased for those at the bottom of the skill distribution.
Moreover migration impacts the labour markets through remittances. McKenzie and Sasin (2007) draw a complete picture of the relevant questions in migration research and high-light the importance, in terms of policy making, of disentangling the channels through which migration and remittances impact welfare. One of these channels is the labour market, with its various components. Thus, they highlight that the impact of migra-tion can not be studied separately from the impact of remittances and vice versa. A first strand of the literature shows that remittances tend to decrease non-migrants labour sup-ply acting as a disincentive for labour participation and/or worked hours, which are re-placed by extra leisure (Funkhouser,1995;Rodriguez and Tiongson,2001;Kim,2007).
Using a general equilibrium model with altruistic households,Baas and Melzer(2012) analyze the macroeconomic impact of remittances through three main channels, namely the exchange rate, savings decisions and labour supply. They show that the increase of migrant outflows of remittances from Germany has a positive effect on the German economy through a converse dutch disease effect. The manufacturing sector which ex-ports a significant part of its production is the main beneficiary, while the effects on the service sector are less favorable. Bussolo and Medvedev(2008) analyze the inter-actions between remittances and labour supply in Jamaica using a general equilibrium model. They find that an increase in remittances generates a reduction of labour supply and a wage increase. This induces an appreciation of the real exchange rate and thus reduces the country’s competitiveness. The two main shortcomings of the general equi-librium analyses presented above are the absence of unemployment modeling as well as a modeling of the emigration decision for the latter paper.
Another channel through which migration impacts labour supply is education. In ad-dition to higher returns to education being the main driver for skilled migration (Hicks, 1932), the most common mechanism highlighted in the literature is the incentive to pursue higher education. Brain-drain remains the most debated issue regarding the topic ‘migration and education’ (Bhagwati and Hamada,1973;Docquier and Rapoport, 2009). As Mountford(1997) and Stark et al. (1997) argue, the outflow of skilled mi-grants will have a positive externality on non-mimi-grants, by increasing their skill pre-mium and thus encouraging them to invest in education. Of course, the magnitude of this effect will depend on the probability to migrate and is conditioned on stayers not fulfilling their expectations. Dessus and Nahas(2008) introduce the education and mi-gration aspects in a general equilibrium model and find that higher mimi-gration rates do not always entail higher investment in education, the migration-education nexus being strongly influenced by structural parameters.
3 Description of the model
Given that the model is based on microeconomic theory with a macroeconomic scope (the Tunisian economy), our applied general equilibrium model relies on the representa-tive agent hypothesis. The model has four agents: local households, migrants, producers and the Government. While the three first are characterized by an optimizing behavior,
Government decisions are exogenously modeled. Local households are disaggregated into six categories (three skill levels, namely low, medium and high skill, and two age categories, namely youth and non-youth).
First, labour supply is modeled as a decision tree with different nests. At the first level, agents choose between migrating and staying at home, based on expected relative wages. This is modeled through a constant elasticity of transformation function:
LST Af,a=
(
alf,a· LSLA
1+sig11
f,a + amf,a· EMIGA
1+sig11
f,a
) 1
1+sig11
(1)
EM IGAf,a = amf,a· LST Af,a
(
WEM IGf,a
WLS f,a
)sig1
(2) where LSTAf ,ais the total skill and age specific working age population, LSLAf ,athe
local labour supply, EMIGAf ,a the migrant population and WEMIG f ,a∗ and WLS f ,a the
foreign and local wages. The share parameters amf ,a and alf ,a were calibrated for base
year values of the main variables. The elasticity sig1 captures individual preferences, but also migration costs and opportunities.
We consider that migration demand is equal to migration supply. This assumption certainly overstates reality, due to visas and emigration quotas. However, if one takes into account illegal migration and students who do not return to origin countries, the gap between supply and demand is certainly reduced. For instance, despite very low demand for migrants in Europe due to the crisis, massive illegal migrant flows from Tunisia were observed during the Arab Spring and the turmoil that followed. This is mainly due to weaker border controls in Tunisia and to significant inflows of migrants fleeing Libya.
For those who do not migrate, the decision is to participate or not in the labour market following a consumption-leisure trade-off modeled through a Stone-Geary utility func-tion (Barzel and McDonald, 1973). After taking into account the household’s budget
constraint, local labour supply is determined by the following equation:
LSf,a = (1− µ0)· LSLAf,a−
µ0 WLS f,a (HC− N ∑ i=1 pici)(3)
where LS is the labour force participation, LSLA is the working age population, µ0 is
the share of leisure in total consumption, WLS is the local wage, HC is total household
consumption and ci is the consumption of good i with price pi.
The implication of this equation is that a decrease in HC due to lower remittances will induce an increase in labour force participation.
For those who migrate, the main decision impacting the local economy is the amount remitted. FollowingRapoport and Docquier (2006), we consider that a migrant’s util-ity function depends not only on her income (WEMIG f ,a), but also on the welfare of
her family in the home country and her degree of altruism. The household’s welfare is proxied by its disposable income (YH ). By deriving this utility function, we compute the remittance rate per migrant (RR) as follows:
RRf = gammamf · WEM IGf,af + (1− gammamf)· Y H (4)
with gammam being the altruism coefficient, dynamically calibrated.
The total amount of remittances will be given by the following equation :
REMf = RRf · ST K1f + 0.5· RRf · ST K2f (5)
where STK is the migrant stock.
Along the lines ofKaram(2010), we consider the stock of migrants to be composed of three generations. This divide will also allow to better take into consideration the remitting behavior of migrants, which will be described below. Therefore, the new emigrants will increase the stock of first generation migrants. Each year, a share of the migrant stock grows older and thus goes from one generation to the next one. The migrant stocks will be determined by the following equations :
ST K1f,t= ST K1f,t−1· (1 − χ1) + EM IGf (6)
ST K2f,t= ST K2f,t−1· (1 − χ2) + ST K1f,t−1· χ1 (7)
ST K3f,t= ST K3f,t−1+ ST K2f,t−1· χ2 (8)
with STK1 being the first generation (most recent) of migrant stock, STK2 the sec-ond generation and STK3 the third generation. The parameters χ1 and χ2 represent the
share of stock 1 that passes in stock 2 each year, corrected by death rates, and the share of stock 2 that passes in stock 3 each year respectively.
The production function is a nested one, to allow for differentiated elasticities of substitution between pairs of factors. At the highest level we assume that production is a Leontief function of value added and total intermediate consumption and value added is a nested CES (Constant Elasticity of Substitution) of low skilled labour (LS ), medium skilled labour (MS ) and a capital high skilled†bundle (KHS ).
V Aac = A1[aKHS· KHS (σ1−1σ1 ) ac + aM S · MS (σ1−1σ1 ) ac + aLS · LS (σ1−1σ1 ) ac ] 1 σ1−1 σ1 (9)
with A1 the shift parameter of production function, a the share parameters for each
bundle and σ1 the elasticity of substitution for the first level of the production function.
Labour demand by skill and age is obtained through cost minimization at each level of the production function nests:
KHSac = A (σ1−1) 1 · Xac· (aKHS· P V Aac P KHSac )σ1(10) M Sac = A (σ1−1) 1 · Xac· (aM SL· P V Aac P M Sac )σ1(11) LSac = A (σ1−1) 1 · Xac· (aLSL· P V Aac P LSac )σ1(12)
†The three categories of skilled labour correspond to education levels as follows: low skilled labour
primary education or less, medium skilled labour secondary education and highskilled labour -tertiary education.
where PVA is the value added price, PKHS the capital and high skilled labour sup-ply price, PMS the medium skilled labour supsup-ply price and PLS the low skilled labour supply price.
Capital and highly skilled labour have been modeled as relatively complementary, following the Fallon-Layard hypothesis (Fallon and Layard,1975).
KHSac = A2[aK · Kac (σ2−1 σ2 )+ a HSL · LD (σ2−1 σ2 ) ac,HSL] 1 σ2−1 σ2 (13)
with A2 the shift parameter of capital-high skill function, a the share parameters for
each bundle and σ2 the elasticity of substitution of the capital skilled labour bundle.
The third level describes the allocation of labour demand between youth and non youth. LDac,f = [ ∑ a aa(a)· LDA (σ3−1 σ3 ) ac,f,a ] 1 σ3−1 σ3 (14) with LDac,f being the labour demand by sector and skill, LDAac,f ,a the labour
de-mand by sector, skill and age and σ3 the elasticity of substitution of the youth non youth
bundle.
Wages and unemployment by skill and age are both endogenous in the model. Private wages’ (WLS f ,a) growth decreases with unemployment rates (Uf ,a) and increases with
public wages (WLS Public,f ,a) following an extended wage curve‡.
ln(WLS f,a) = β1 + β2· ln(WLS P ublic,f,a) + β3 · ln(Uf,a)(15)
with β1 the intercept for the wage curve, β2 (>0) the elasticity of the wage curve
with respect to public wages and β3 (<0) the elasticity of the wage curve with respect
to unemployment.
Sectoral wages by skill and age are linked to macro-economic wages by exogenous wage differentials which reflect different productivity levels:
WLS ac,f,a= AF Wf,a· F W DISTac,f,a (16)
where AFWf ,a is the average local wage by skill and age and FWDISTac,f ,a the
sectoral wage distortion by skill and age.
Model dynamics are of the sequential type. We assume that savings determine in-vestment, because we are in a savings constrained economy. Households’ propensity to save is assumed exogenous following Solow-style growth models, rather than Ramsey type intertemporal models. This simplifying choice of myopic behavior in dynamic re-cursive general equilibrium model is made when the main issue is not the allocation of households’ income over time.
Capital accumulation is sectoral. Every year the stock of physical capital (KDac,t)
increases by investment (INVac,t) net of capital depreciation (with δ being the
depreci-ation rate for capital).
KDac,t = KDac,t−1· (1 − δ) + INVac,t(17)
Sectoral investment has been modeled as a function of the sectoral stocks of capital (KDac,t), sectoral rates of return to capital (RKac) and capital acquisition costs (PKac).
IN Vac = M U · KDac· e
λ·RKac P Kac (18)
Every year, the stock of active population by skill increases with:
• the stock from the previous year corrected by the mortality rate, the retirement
rate and the transition rate from one age category to the the other;
• the new entrants on the labour market graduating from each education cycle and
leaving the education system (thus entering the labour market with the skill level corresponding to the education level they graduate) ;
• the new entrants on the labour market that drop out of each education cycle (thus
entering the labour market with the skill level below the the one corresponding to the education level from which they dropped out);
and decreases with the emigrants that leave the country each year (see equations51and 52in the Appendix). Moreover, the decision to exit the education system or to pursue education to the next level is endogenous, depending on expected relative wages.
Human capital (proxied by education) evolves according to the performances of the education system but also to the incentives for pursuing higher level of education. The choice between staying unskilled, becoming medium skilled or high skilled, depends on expected relative wages. We use a model developed by Fredriksson(1997) in or-der to link migration and education incentives and endogenize the transition rates from primary to secondary and from secondary to tertiary. Fredriksson(1997) shows that an increase in the university wage premium has a positive effect on enrollment decisions. He argues that, when faced with the decision to follow their education to the university level, individuals make their choice depending on their schooling abilities and the rela-tive wage premium. Our approach is similar in the sense that individuals will choose to pursue their education according to the relative skill wage premium, which also depends on foreign skilled wages. The equation for the transition rate (PERF ) from primary to secondary will be the following:
log P ERF′trans′,edus (1− P ERF′trans′,edus)
= α′perf′· log W M OYM SK· (1 − Uf)
W M OYLSK · (1 − Uf)
(19) with α′perf′ being the constant in logistic function for educational behavior, WMOY
the average wage by skill and U the unemployment rate by skill.
Similarly, the equation for the transition rate from secondary to tertiary will be the following:
log P ERF′trans′,edut
(1− P ERF′trans′,edut) = αperf · log
W M OYHSK · (1 − Uf)
W M OYM SK· (1 − Uf)
(20) The passing, drop-out and repetition rates are exogenous, while the exit rate from the education system is computes as a residue of the transition rates (see equation 39 in the Appendix). These rates, along with the population growth, are used to compute the number of enrolled students in each cycle (equations40,41and42in the Appendix).
Households’s income consists of their capital revenues, wages, social security ben-efits, public transfers, net interests and remittances (see equation45in the Appendix). Government revenue is composed of the taxes it collects, the capital revenue and
trans-fers it receives (see equation46in the Appendix).
The closures of the model
The model has five closures: a macro closure, a government closure, an external balance closure, a labour market closure and a closure of the social security accounts. Concerning the macro closure, it is savings driven (households’ marginal propensity to save is exogenous), which means that the level of investment is determined by the level of total available savings in the economy (including foreign savings). Hence as savings increase, the stock of capital and output increase. The government closure cho-sen consists in fixing tax rates, increasing annually government spending by 5 percent, following the historical trends and leaving the government budget balance endogenous (see equation 47 in the Appendix). The foreign balance closure consists of fixing the current account balance at its observed level (see equation 49 in the Appendix). The labour market closure consists of a joint determination of unemployment and average formal wages through the wage curve described above.
4 The Tunisian context and model calibration
4.1 Labour market and migration
The working age population represents 75 percent of the population in Tunisia and its growth rate is the double of the total population’s growth rate (Mahjoub, 2010). The labour participation rate was estimated to be 47 percent in 2010, but important dispar-ities are to be found concerning women (whose participation rate is 25 percent) and youth. Indeed, for those aged between 15 and 29 years, the participation rate falls to 34 percent and this can be partly explained by the high enrollment rates and the lack of job opportunities. Tunisians are becoming increasingly qualified and this is reflected by the share of the highly educated labour force that went from 6.5 percent of the total labour force in 1994 to 20 percent of the total labour force in 2011 (see1).
The unemployment rate slightly decreased, from 15.6 percent in 1994 to 13.3 percent in 2010, but surged to 18.9 percent in 2011. The share of medium and highly-educated
Table 1: Labour force by education level
2005 2007 2009 2011
Thousands % Thousands % Thousands % Thousands %
Illiterate 427.2 12.7 410.7 11.7 391.7 10.6 364 9.5 Primary 1272.7 37.9 1284.7 36.5 1268.2 34.4 1271.5 33.1 Secondary 1211.9 36.1 1288 36.6 1386.3 37.8 1457.7 37.9 Higher 443.9 13.3 533.8 15.2 636.2 17.2 746.9 19.5 Unknown 3.4 - 4.5 - 6.8 - 4.5 -Total 3359.1 100 3521.7 100 3689.2 100 3844.6 100 Growth rate (%) - 2.4 2.4 2.1 Source:INS
unemployed increased significantly during the same period with the noticeable rise of highly-educated which went from 2 percent in 1994 to 32 percent in 2011 (see 2). In other words, unemployed individuals with a university diploma represent one third of total unemployment. In 2011, the unemployment rate among graduates was 30.5 percent while it is 9.3 percent for those who have no education. Graduates’ unemployment has therefore become one of the biggest challenges in Tunisia (Marouani,2010).
Furthermore, there seems to be a correlation between age and unemployment, with high unemployment rates for the young (28.7 percent for those between 15-19 years old and 29.7 percent for those being 20 to 24 years old) that decline with age, reaching 3 percent for those aged 45 years and above.
Table 2: Unemployment rates by education level
2005 2007 2009 2011
Illiterate 6.3 4.4 6.1 9.3
Primary 14.3 11.5 10.4 13
Secondary 13.3 13.5 14 19.9
Vocational training and university 14 18.7 21.9 30.5
Total 12.9 12.4 13.3 18.9
Source: INS
Venturini et al.(2009) point out that job creation in Tunisia does not manage to keep up with the increase in labour supply. In a survey on the Tunisian youth’s willingness to
migrate,Fourati(2008) stresses the importance of this phenomenon and how it evolved between 1996 and 2005, as a result of both economic and political factors. If only one quarter of the skilled youth wanted to migrate in the mid nineties, they were more than three quarters willing to leave their home country in 2005.
Moreover, the intentions to migrate are high not only for the unemployed (81 per-cent) and the casual workers (75 perper-cent), but also for those who have a stable job (56 percent) (Sabadie et al., 2010). Even though these intentions do not reflect the reality of migration flows, they highlight the problems and the frustration encountered by the Tunisian youth.
In Tunisia, the emigration policy, developed by the Ministry of Social Affairs and Sol-idarity, has different social, cultural, economic and information aspects. These policies are implemented by the Office of Tunisians Abroad and the National Social Security Fund. Furthermore, there are two institutions that govern controlled emigration: the National Employment and Self-Employment Agency (Agence Nationale de l’Emploi et du Travail Indépendant - ANETI) and the Tunisian Agency for Technical Cooperation (Agence Tunisienne de la Coopération Technique - ATCT). The former organizes and ensures placement of the Tunisian labour force abroad, mainly in France (62.2 percent), while the latter deals mainly with promoting Tunisian skills and favors the placement in Arab countries. On average, these two agencies ensure the placement abroad of 3000 Tunisian workers per year.
In terms of stock, the number of Tunisians residing outside their home country amounts to slightly more than 1 million, with the majority (almost 83 percent) living in Europe. The most popular destination is France, receiving around 40 percent of all Tunisian mi-grants, followed by Italy with 25 percent. Tunisian migration to France goes a long way back, with the first labour agreements signed in the sixties.
The most important share of Tunisian migrants (48.1 percent) has a secondary edu-cation, while university graduates represent 14.1 percent of migrants.
Finally, remittances play an important role in the Tunisian economy. In 2010, they amounted to 1.970 million US$, representing 4.4 percent of GDP and 30 to 40 percent of the trade deficit.
In terms of migration to Europe, Tunisia has two main migration agreements, one with France and one with Italy. They both allow work related migration of Tunisians within quotas of 9000 workers per year for France and 4000 for Italy. Nevertheless, only
a limited list of jobs is concerned (for Italy, mainly engineers, doctors and paramedical staff are allowed) and the requirements in terms of qualification are quite high, resulting in unattained quotas in both countries. Due to historical ties, Tunisia hosts an office of the French Agency for Immigration and Integration (Office Français d’immigration et d’intégration) that aims at facilitating and regulating migration flows. Despite the bilateral agreement§on concerted management of migratory flows, signed in 2008, only 25 percent of demanded visas have been issued in 2009.
4.2 The data
The Social Accounting Matrix was built based on an Input-Output table for 2005 from the Institut National des Statistiques (INS) and complementary data from the Central Bank and the Ministry of Finance. GDP Growth rates projections are from the IMF and World Bank sources. Data on investment, debts and foreign savings comes from the INS and the Central Bank.
Employment and wage data by sector, skill and age category was built using the 2010 labour Force Survey, as well as the 2004 Population Census and 2005 data on employment, wages and revenues.
Data on migration rates and wage differentials was computed from CARIM databases, INSEE and various reports (EU2010). In order to compute migrant stocks by category and by skill, we used data from DIOC-E, the data set built by Docquier and Marfouk on skilled migration to OECD countries ¶, as well as theOzden et al. (2011) database on migrants stocks and the DIOC-E data set (Dumont et al., 2010) and ‘Bilateral Migra-tion and Remittances 2010’ from the World Bank, an update of the data set provided by Ratha and Shaw(2007).
Education data, specifically the number of enrolled by cycle and efficiency rates, were compiled with the help of the ITCEQ (Institut Tunisien de Compétitivité et d’Etudes
Quantitatives), as well as data from the Education Ministry, UNESCO and the World
Bank.
§The agreement also includes financial aid for development programs in areas such as vocational training
and support for young entrepreneurs
Figure 1: Comparison between baseline and actual trends for Tunisia
4.3 Calibration
The derivation of the scale and share parameters of the functions follows the standard procedure in applied general equilibrium modeling. Based on the initial values of the variables, the scale and share parameters are computed endogenously.
Table 3: Main elasticities of the model Elasticity of substitution
Of the capital (K) and high-skilled demand (HSK) bundle 0.3
Of the medium-small bundle 0.9
Of the low-skilled bundle 0.9
Of the youth-non-youth bundle 0.5
Elasticity of the wage curve -0.22
Elasticity of transformation for the migration decision 1.2 Elasticity of substitution between imports and local products 3 Elasticity of transformation between local products and exports 3
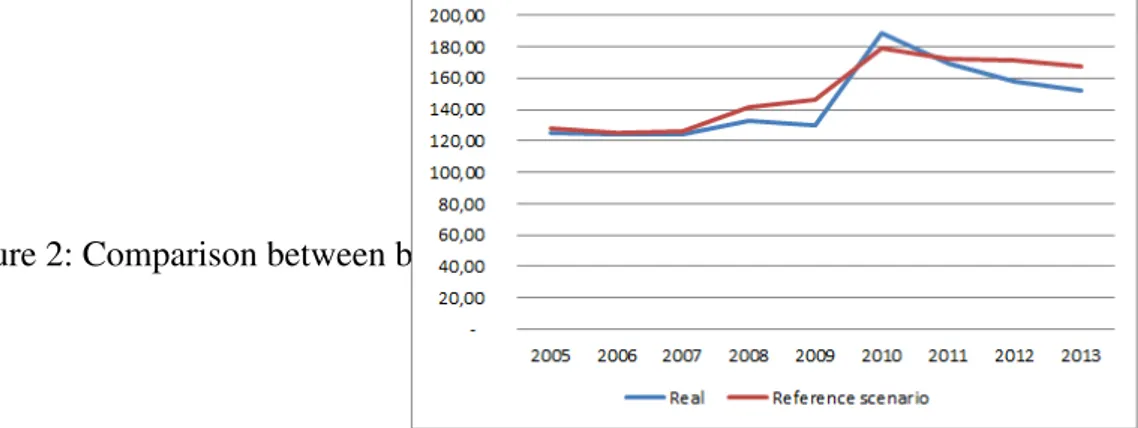
The main elasticities used in the model (see table 3) have been calibrated dynam-ically to replicate the observed path of the main variables of interest. The migration decision elasticity was dynamically calibrated, with a starting point of one unity follow-ingConstant and Zimmermann(2013), and it captures individual preferences, but also migration costs and opportunities. Since the base year is 2005 for Tunisia, and data is available through 2012, a dynamic calibration of the model was possible. The dynamic calibration consists in setting parameter values by repeatedly running the reference sce-nario until the modeled economy mimics the observed path for the main variables of interest. The result from this exercise is that the reference scenario is reasonably in line with the labour force survey figures and the evolution of the main variables at the macro and sector levels, as shown in Figure1and2.
Figure 2: Comparison between baseline and actual trends for unemployment
5 Experiment: The impact of the crisis
5.1 The crisis simulation
The objective of the paper is to disentangle the different channels through which both crises impact the Tunisian labour market, including migrants’ behavior. The reference scenario includes actual growth rates between 2005 and 2012 and projections for 2012-2015. Given that the effects of the global crisis started to materialize in Tunisia in 2009 and the effects of the revolution in 2011, both crises are included in the reference scenario. Due to the quasi simultaneity of both crises, we do not measure independently the two shocks. Moreover, our main interest lies in analyzing how agents in our model react in a crisis context, regardless of its origin. The counterfactual scenario consists in simulating the behavior of the Tunisian economy had the crises not occurred. For that purpose, we rely on economic growth rates for Tunisia and its main partners forecasted by the IMF before the subprime crisis exploded and the social uprising in Tunisia. The variables through which the shock is implemented are Tunisia’s economic growth rate and the growth rate of its partners, the savings propensity in Tunisia (in order to simulate the decline in investment) and the foreign wage. For both the reference and simulated scenarios we obtain labour market and migration outcomes. The impact of the crises on each variable of the model (such as labour demand, supply and migration) will thus be measured by comparing the two scenarios.
5.2 Macroeconomic results
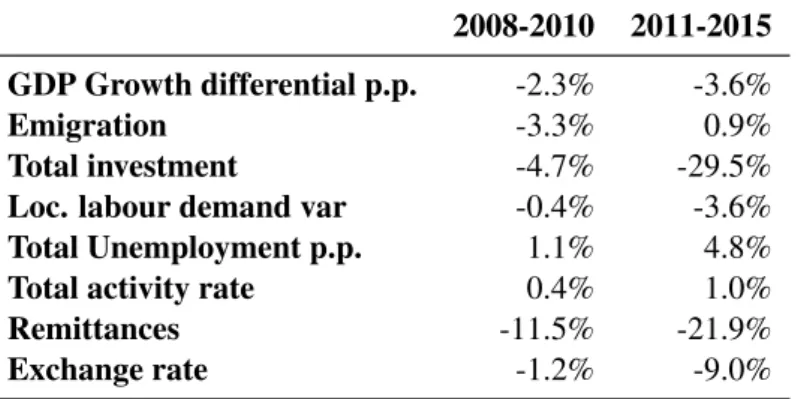
The main results at the macroeconomic level are summarized in Table 4 and clearly show a differentiated impact before and after the Tunisian revolution. In the 2008-2010 period we notice a decrease in investment (-4.7 percent on average), in labour demand (-0.4 percent) and a reduction of Tunisian migrant remittances (-11.5 percent) which
has a positive effect on the labour force participation rate (0.4 percent). The combined effect of lower labour demand and higher labour supply results in higher unemployment (1.1 percentage points). However emigration decreases (-3.3 percent) since the shock is more severe on Tunisia’s partners (mainly the EU) than on Tunisia.
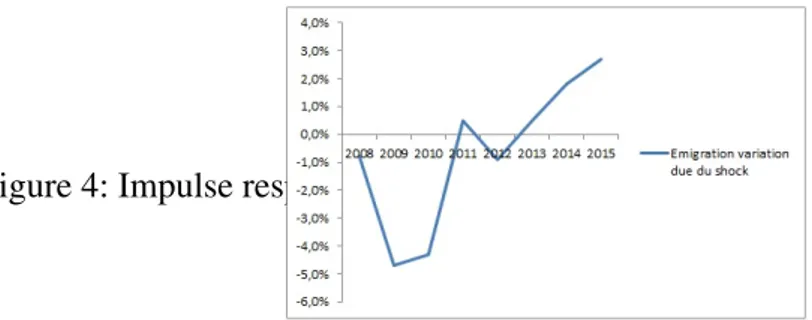
After the revolution, Tunisia’s economic growth rate plunges (-3.6 percentage points on average) due to much lower investment (-29.5 percent) and the result is a sharp decrease in labour demand (-3.6 percent). Lower growth also means a stronger depre-ciation of the exchange rate (-9.0 percent) given that Tunisia has a structural deficit in its trade balance. This amplifies the negative impact on migrants remittances (-21.9 per-cent) which then accelerates the increase of the activity rate (1.0 perper-cent). It results in an increase of the average unemployment rate by 4.8 percent. There is also a reversal in migration flows, resulting in an increase of emigration intentions by 0.9 percent on average since the situation in Tunisia is deteriorating considerably more than in its main partners’ economies. The intensity of the shock in terms of migration is also illustrated by the impulse response function illustrated in figure4in the Appendix.
Table 4: Average yearly variation as compared to the reference scenario
2008-2010 2011-2015 GDP Growth differential p.p. -2.3% -3.6% Emigration -3.3% 0.9% Total investment -4.7% -29.5% Loc. labour demand var -0.4% -3.6% Total Unemployment p.p. 1.1% 4.8% Total activity rate 0.4% 1.0% Remittances -11.5% -21.9% Exchange rate -1.2% -9.0%
5.3 Results by skill
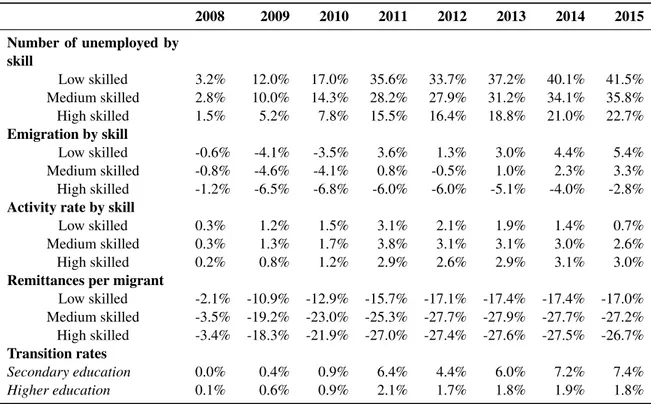
Table 5shows a decreasing magnitude of unemployment variation with the skill level. The highest increase occurs for unskilled (27.5 percent on average) because their initial unemployment rate was the lowest, which means that an equivalent decrease of labour demand for the three skill levels has a higher impact on unskilled unemployment. The variation in emigration intentions by skill reflects a trade off between the evolution of
local wages adjusted by unemployment rates and the real exchange rate. It results in an increase in unskilled migration intentions (1.2 percent on average) because the decrease in local wages is much higher than the currency appreciation. For medium and high skilled the variation is respectively almost nil and negative on average because the wage variation is very close or lower than the exchange rate decrease.
The evolution of the activity rate by skill reveals a higher increase for skilled labour (2.4 and 2.1 percent, versus 1.5 percent for unskilled), due to a higher decrease in the remittance rate of skilled migrants (-22.7 and -22.5 percent versus -13.8 percent). This differentiated variation in the remittance rate is due to a higher wage gap between local and foreign wages for the unskilled. Given the assumed altruistic behavior of migrants, a negative shock affecting their families can be offset with a lower increase of remittances. Finally, on the education side, the crisis has a positive impact on transition rates from primary to secondary education because wage losses are lower for medium skilled workers compared to the unskilled. Transition rates from secondary to tertiary education were also increased, but to a lower extent.
Table 5: Unemployment and remittances by skill
2008 2009 2010 2011 2012 2013 2014 2015 Number of unemployed by skill Low skilled 3.2% 12.0% 17.0% 35.6% 33.7% 37.2% 40.1% 41.5% Medium skilled 2.8% 10.0% 14.3% 28.2% 27.9% 31.2% 34.1% 35.8% High skilled 1.5% 5.2% 7.8% 15.5% 16.4% 18.8% 21.0% 22.7% Emigration by skill Low skilled -0.6% -4.1% -3.5% 3.6% 1.3% 3.0% 4.4% 5.4% Medium skilled -0.8% -4.6% -4.1% 0.8% -0.5% 1.0% 2.3% 3.3% High skilled -1.2% -6.5% -6.8% -6.0% -6.0% -5.1% -4.0% -2.8% Activity rate by skill
Low skilled 0.3% 1.2% 1.5% 3.1% 2.1% 1.9% 1.4% 0.7%
Medium skilled 0.3% 1.3% 1.7% 3.8% 3.1% 3.1% 3.0% 2.6%
High skilled 0.2% 0.8% 1.2% 2.9% 2.6% 2.9% 3.1% 3.0%
Remittances per migrant
Low skilled -2.1% -10.9% -12.9% -15.7% -17.1% -17.4% -17.4% -17.0% Medium skilled -3.5% -19.2% -23.0% -25.3% -27.7% -27.9% -27.7% -27.2% High skilled -3.4% -18.3% -21.9% -27.0% -27.4% -27.6% -27.5% -26.7% Transition rates Secondary education 0.0% 0.4% 0.9% 6.4% 4.4% 6.0% 7.2% 7.4% Higher education 0.1% 0.6% 0.9% 2.1% 1.7% 1.8% 1.9% 1.8%
5.4 Unemployment variation decomposition
We use a decomposition approach to disentangle labour supply and demand effects on unemployment variation . The decomposition formula is the following:
∆u =
∆LS
u − ∆LD · (
1
u − 1) (21)
The results show that labour supply effects were predominant when the crisis was more severe in Europe. With the Tunisian uprisings we witness a reversal of the results as shown by figure3.
Figure 3: Comparison between baseline and actual trends for unemployment
5.5 Robustness analysis
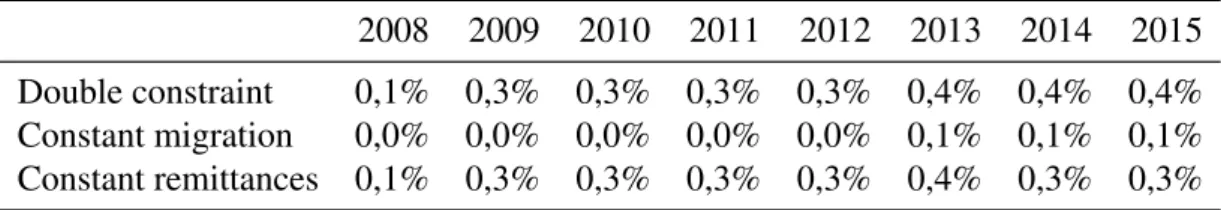
In order to confirm the role of migration on unemployment variation we run additional simulations using the previous crisis shock and we impose constraints on migration flows and remittances. In the first scenario, migration flows are constant, in the second one, remittances are constant and in the third one both are fixed. As shown by table6 the main result is that migration plays a significant role in the unemployment increase. Moreover, we find that remittances have a higher impact than the variation of emigration flows.
Table 6: Unemployment variation in each simulation
2008 2009 2010 2011 2012 2013 2014 2015
Double constraint 0,1% 0,3% 0,3% 0,3% 0,3% 0,4% 0,4% 0,4% Constant migration 0,0% 0,0% 0,0% 0,0% 0,0% 0,1% 0,1% 0,1% Constant remittances 0,1% 0,3% 0,3% 0,3% 0,3% 0,4% 0,3% 0,3%
6 Conclusion
This article shows how migration channels affect origin countries’ labour markets in times of crisis. Tunisia is an interesting case study because it witnessed a crisis of its main receiving countries in terms of migration, followed by a severe domestic economic crisis with the revolution. The main innovation of the paper is the retrospective model-ing in general equilibrium of the impact of the crisis to highlight the impact of migration on the labour market. The unemployment variation is decomposed into labour supply and demand effects. Endogenous returns to education allow to capture the impact of the crisis on education decisions. We develop a novel general equilibrium framework for-malizing the emigration decision and the evolution of the remittances rate. It includes an endogenous labour supply function which depends among other factors on migrant remittances. The production of skills is modeled with an endogenisation of transition rates between cycles.
The retrospective simulation showed that we can clearly distinguish a difference in the results before and after the Tunisian uprising. In the first period, despite an increase in unemployment, migration intentions decrease because the Tunisian economy slowdown is moderate compared to the recession observed in its main trading partners. Starting from 2011, Tunisia’s economic growth plunges and this worsens the negative effects on the labour market, especially on the low skilled workers. There is a reversal in migration flows, with an upsurge in 2011. The simultaneity of the crisis in Tunisia and its partners worsened the employment situation through labour supply effects. Given the high stock and limited flows of Tunisian emigrants, the effects of migration on the labour market seem to operate more via the remittances-activity rate nexus than via an outflow of job-seekers. The decomposition of unemployment variation shows that labour supply effects are predominant in the first phase, while labour demand effects take over with the Tunisian revolution. Finally, the long-term impact of the crisis will be a higher incentive to invest in secondary education and a relatively lower incentive in pursuing higher education.
To confirm the role played by migration in the unemployment variation, we add three simulations: the first one where migration flows are constant; a second, where remit-tances are constant and a third where both are fixed. The main result is that migration is indeed one of the main determinants of the unemployment increase and that remittances
have a higher impact than the variation of emigration flows.
Among the limits of our current research, we can cite the absence of data on the map-ping between migrants’ remittances by skill and the receivers. We thus had to rely on hypotheses which could impact the final results on the outcomes by skill. A survey with matched data on migrants and their origin households could improve the quality of the model’s results. It could also allow adding the inequality dimension to the employment-migration interactions analysis.
Bibliography
Aydemir, A. and G. J. Borjas, “Cross-Country Variation in the Impact of International Migration: Canada, Mexico, and the United States,” Journal of the European
Eco-nomic Association, 06 2007, 5 (4), 663–708.
Baas, T. and S. Melzer, “The Macroeconomic Impact of Remittances: A sending coun-try perspective,” Norface Discussion Paper Series 2012021, Norface Research Pro-gramme on Migration, Department of Economics, University College London 2012. Barzel, Y. and R. J. McDonald, “Assets, Subsistence, and The Supply Curve of Labor,”
American Economic Review, September 1973, 63 (4), 621–33.
Bhagwati, J. and Hamada, “The Brain Drain, International Integration of K. Markets for Professionals and Unemployment: A Theoretical Analysis,” Working papers 102, Massachusetts Institute of Technology (MIT), Department of Economics February 1973.
Blanchflower, David G and Andrew J Oswald, “ The Wage Curve,” Scandinavian
Journal of Economics, 1990, 92 (2), 215–35.
Borjas, G. J., “The Labor Demand Curve Is Downward Sloping: Reexamining The Impact Of Immigration On The Labor Market,” The Quarterly Journal of Economics, November 2003, 118 (4), 1335–1374.
Bussolo, M. and D. Medvedev, “Do Remittances Have a Flip Side? A General Equi-librium Analysis of Remittances, Labor Supply Responses and Policy Options for Jamaica,” Journal of Economic Integration, 2008, 23, 734–764.
Constant, A.F. and K.F. Zimmermann, International Handbook on the Economics of
Migration: Elgar original reference, Edward Elgar Publishing, Incorporated, 2013.
Dessus, S. and C. Nahas, “Migration and Education Decisions in a Dynamic General Equilibrium Framework,” Policy Research Working Paper Series 4775, The World Bank November 2008.
Docquier, F. and A. Marfouk, International migration, remittances and the brain
and H. Rapoport, “Documenting the Brain Drain of "La Crème de la Crème",” Journal of Economics and Statistics (Jahrbuecher fuer
Nation-aloekonomie und Statistik), December 2009, 229 (6), 679–705.
Dumont, J.-C., G. Spielvogel, and S. Widmaier, “International Migrants in Devel-oped, Emerging and Developing Countries: An Extended Profile,” OECD Social, Employment and Migration Working Papers 114, OECD Publishing 2010.
Fallon, P. R. and P. R. G. Layard, “Capital-Skill Complementarity, Income Distri-bution, and Output Accounting,” Journal of Political Economy, 1975, 83 (2), pp. 279–302.
Fourati, H., “Consultation de la jeunesse et désir d’émigrer chez les jeunes en Tunisie 1996-2005,” Technical Report, San Domenico di Fiesole (FI): European University Institute 2008.
Fredriksson, P., “Economic Incentives and the Demand for Higher Education,”
Scan-dinavian Journal of Economics, March 1997, 99 (1), 129–42.
Funkhouser, E., “Remittances from International Migration: A Comparison of El Sal-vador and Nicaragua,” The Review of Economics and Statistics, February 1995, 77 (1), 137–46.
Hanson, G. H., “The Economic Consequences of the International Migration of Labor,”
Annual Review of Economics, 05 2009, 1 (1), 179–208.
, Handbook of Development Economics, Vol. 5, Elsevier, Hicks, J. R., The Theory of Wages, London McMillan, 1932.
Karam, Fida, “When Migrant Remittances Are Not Everlasting: How Can Morocco Make Up?,” Review of Middle East Economics and Finance, July 2010, 6 (1), 1–38. Kim, N., “The impact of remittances on labor supply : the case of Jamaica,” Policy
Research Working Paper Series 4120, The World Bank February 2007.
Mahjoub, A., “Labour Markets Performance and Migration Flows in Tunisia,” in “Labour Markets Performance and Migration. Flows in Arab Mediterranean Coun-tries. Determinants and Effects,” Vol. 60 of Occasional Papers 2010.
Marouani, Mohamed Ali, “More jobs for university graduates: some policy options for Tunisia,” Applied Economics Letters, 2010, 17 (10), 933–937.
McKenzie, D. and M. J. Sasin, “Migration, remittances, poverty, and human capital : conceptual and empirical challenges,” Policy Research Working Paper Series 4272, The World Bank July 2007.
Mishra, P., “Emigration and wages in source countries: Evidence from Mexico,”
Jour-nal of Development Economics, January 2007, 82 (1), 180–199.
Mountford, A., “Can a brain drain be good for growth in the source economy?,” Journal
of Development Economics, August 1997, 53 (2), 287–303.
Ozden, C., C. R. Parsons, M. Schiff, and T. L. Walmsley, “Where on Earth is Ev-erybody? The Evolution of Global Bilateral Migration 1960-2000,” World Bank
Eco-nomic Review, May 2011, 25 (1), 12–56.
Rapoport, H. and F. Docquier, The Economics of Migrants’ Remittances, Vol. 1 of
Handbook on the Economics of Giving, Reciprocity and Altruism, Elsevier,
Ratha, D. and W. Shaw, South-South Migration and Remittances, World Bank Publi-cations, 2007.
Rodriguez, E. R. and E. R. Tiongson, “Temporary Migration Overseas and Household Labor Supply: Evidence from Urban Philippines.,” International Migration Review, 2001, 35 (3), 709 – 725.
Sabadie, J. A., J. Avato, U. Bardak, F. Panzica, and N. Popova, Migration and Skills:
The Experience of Migrant Workers from Albania, Egypt, Moldova, and Tunisia,
World, 2010.
Stark, O., C. Helmenstein, and Y. Yegorov, “Migrants’ Savings, Purchasing Power Parity, and the Optimal Duration of Migration,” Economics Series 44, Institute for Advanced Studies June 1997.
Venturini, A., T. Fakhoury, and N. Jouant, “EU Migration Policy Towards Arab Mediterranean Countries and its Impact on Their Labour Markets,” Technical
Re-port, Robert Schuman Centre for Advanced Studies, European University Institute 2009. Thematic Background Paper.
Yang, D., “International Migration, Remittances and Household Investment: Evidence from Philippine Migrants’ Exchange Rate Shocks,” Economic Journal, 04 2008, 118 (528), 591–630.
7 Appendix
Figure 4: Impulse response function for emigration
Table 7: Sets
f Factors (low-, medium-, high-skilled, capital, land)
kf Physical capital factors (capital, land)
a Age (youth, non-youth)
ac Activities (37 sectors)
i Commodities (37 sectors)
im Imported commodities
ie Exported commodities
c Educational cycles (primary, secondary, higher education)
7.1 Main equations of the model
Production and demand factor equations
Xac= A1[aKHS· KHS (σ1−1 σ1 ) ac + aM S· MS (σ1−1 σ1 ) ac + aLS· LS (σ1−1 σ1 ) ac ] 1 σ1−1 σ1 (22) KHSac= A(σ1 1−1)· Xac· (aKHS· P V Aac P KHSac )σ1(23)
M Sac = A(σ1 1−1)· Xac· (aM SL· P V Aac P M Sac )σ1(24) LSac = A(σ1 1−1)· Xac· (aLSL· P V Aac P LSac )σ1(25) KHSac = A2[aK· Kac (σ2−1 σ2 )+ aHSL· LD( σ2−1 σ2 ) ac,HSL] 1 σ2−1 σ2 (26) LDac,f = [ ∑ a aa(a)· LDA (σ3−1 σ3 ) ac,f,a ] 1 σ3−1 σ3 (27) Labour supply
LSf,a= (1− µ0)· LSLAf,a−
µ0 WLS f,a (HC− N ∑ i=1 pici)(28) Migration decision LST Af,a = ( alf,a· LSLA 1+ 1 sig1
f,a + amf,a· EMIGA
1+ 1 sig1 f,a ) 1 1+sig11 (29)
EM IGAf,a= amf,a· LST Af,a
( WEM IGf,af,a WLS f,a )sig1 (30) Migrant stocks ST K1f,t= ST K1f,t−1· (1 − χ1) + EM IGf (31) ST K2f,t= ST K2f,t−1· (1 − χ2) + ST K1f,t−1· χ1 (32) ST K3f,t= ST K3f,t−1+ ST K2f,t−1· χ2 (33) Remittances
RRf = gammamf· WEM IGf,af + (1− gammamf)· Y H (34)
Migration duration ShM igf = (1− α) · (p · ER)α/(α−1)· WLS f,a WEM IGf,af,a−RRf + α· p · ER − WLS f,a WEM IGf,af,a−RRf (1− (p · ER)α/(α−1))(p· ER − WLS f,a WEM IGf,af,a−RRf) (36) Education
log P ERF′trans′,c
(1− P ERF′trans′,c) = αperf · log
W M OYM SK· (1 − Uf)
W M OYLSK· (1 − Uf)
(37)
log P ERF′trans′,edut
(1− P ERF′trans′,edut) = αperf · log
W M OYHSK · (1 − Uf)
W M OYM SK· (1 − Uf)
(38)
P ERF′exit′,c= 1− P ERF′trans′,c (39)
EN RN EWc,t= popent1c,t+popentncohc,t+gycyc·P ERF′trans′,c,t−1·P ERF′pass′,t−1·ENRc,t−1
(40)
EN ROLDc,t= (P ERF′pass′,c,t−1· (1 − gcycc) + P ERF′rep′,t−1)· ENRc,t−1 (41)
EN Rc,t= EN RN EWc,t+ EN ROLDc,t (42)
Wage curve
ln(WLS f,a) = β1+ β2· ln(WLS P ublic,f,a) + β3· ln(Uf,a)(43)
Sectoral wage
Household income
Y H = ∑
ac,kf
lambdakf· RKac,kf+ W BILL + SSB
+ T RN SF +∑
f
REMf− T RNSF I
+ iri· GIDEBT − irpf · (F DEBT − GF DEBT )
(45) Government income Y G =lambdag·∑ ac RKac,′cap′ + ∑ ac T Xac· P P Xac· Xac +∑ i (T Ci+ T SU Bi)· P Qi· Qi· (1 + tmgi) +∑ im T Mim· P MHTim· Mim + T Y ∗ Y H + T RNSF (46) Budget balance SG =Y G− GV AL − T RNSF −∑ ac
(1− isubac)· INV ac · P INVac
− shrginv ·∑
ac
IN V ac· P INVac
− irgf · GF DEBT − iri · GIDEBT
(47)
Investment
IN Vac= M U· KDac· e
λ·RKac P Kac (48)
Current account balance
F SAV =∑ im P M HTim· Mim− ∑ ie P Eie· EXie+ lambdaw· ∑ ac RKac, k + T RN SF −∑ f
REMf + irgf · GF DEBT + irpf · (F DEBT − GF DEBT )
(49) Capital accumulation
Labour force dynamics
LST Af,′Y′,t=(1− mortf,′Y′,t−1− transf,t−1)· LST Af,′Y′,t−1
− EMIGAf,′Y′,t−1· ShMigf,′Y′,t−1
+ ∑
c̸=edut
shrlabentc,t· P ERF′exit′,c,t−1· P ERF′pass′,c,t−1· gcycc,t−1· ENRc,t−1
+ ∑
c=edut
shrlabentc,t· gcycc,t−1· P ERF′pass′,c,t−1· ENRc,t−1
+∑
c
shrlabentc,t· P ERF′drop′,c· ENRc,t−1
+ shrlabent2f,t· poplabentt (51) LST Af,′N Y′,t =(1− mortf,′N Y′,t−1− retirf,′N Y′,t−1)· LST Af,′N Y′,t−1 + transf,t−1· LST Af,′Y′,t−1 − EMIGAf,′N Y′,t−1· ShMigf,′N Y′,t−1 (52)
Main variables of the model
Xac Composite production by sector
KHSac Capital and high skilled labour bundle
MSac Medium skilled labour bundle
LSac Low skilled labour bundle
PVAac Value added price
PKHSac Capital and high skilled labour price
PMSac Medium skilled labour price
PLSac Low skilled labour supply price
Kac Capital
LDac,f Labour demand by skill
LDAac,f ,a Labour demand by skill and age
LSf ,a Effective local labour supply by skill and age
LSLAf ,a Local labour supply by skill and age
WLS f ,a Local wages by skill and age
pi Price for commodity i
ci Minimum consumption for commodity i
LSTAf ,a Total labour supply by skill and age
EMIGAf ,a Emigration by skill and age
WEMIG f ,a Foreign wages by skill and age
STK1f Migrant stock 1st generation (most recent)
STK2f Migrant stock 2nd generation
STK3f Migrant stock 3rd generation
ShMigf Migration duration
RRf Remittance rate per migrant
p Purchasing power parity
ER Exchange rate
YH Household disposable income
REM Total remittances
PERF Education outcome
ENRNEWc,t New enrolled students in cycle c
ENROLD Old enrolled students in cycle c
ENR Total enrolled students in cycle c
WMOYf Average wage by skill
Uf ,a Unemployment rate by skill and age
AFWf ,a Average local formal wage by skill and age
FWDISTac,f ,a Sectoral wage distortion by skill and age
RK Return of capital
WBILL Wage bill
SSB Social security income
TRNSF Net transfers
TRNSFI Outflow of remittances
GIDEBT Government internal debt
GFDEBT Government foreign debt
FDEBT Total foreign debt
YG Total government income
TX Production tax rate
TY Income tax rate
TCi Product tax rate
TSUBi Consumption tax or subsidy
Q Domestic consumption of good i
M Volume of imports of good i
PPX Price of composite sectoral production
PQ Price of composite good
PMHTim Import price of good I less taxes (local currency)
SG Government savings
GVAL Total value of Government spending
PINVac Price of investment by sector
isubac Investment subsidy by sector
INVac Investment
KDac Capital demand
PKac Capital price
MU Savings - Investment adjustment variable
FSAV Current account balance Main elasticities and parameters of the model
A1 Shift parameter of production function
aKHS Share parameter of capital-high skill bundle
aMSL Share parameter of medium skill bundle
aLSL Share parameter of low skill bundle
A2 Shift parameter of capital-high skill function
aK Share parameter of land capital bundle
aHSL Share parameter of high skill labour
aa Share parameter by age
σ1 Elasticity of substitution of the production function level 1
σ2 Elasticity of substitution of the KHS bundle
σ3 Elasticity of substitution of the youth non youth bundle
µ0 Parameter for the share of leisure in total consumption
al Share parameter for local labour supply
am Share parameter for international migrants
sig1 Elasticity of transformation total labour supply
χ1 Share of stock 1 that passes in stock 2 each year
gammam Altruism coefficient
α/(α− 1 ) Elasticity of intertemporal substitution of consumption
α′perf′ Constant in logistic function for educational behavior
gcyc Student share graduating from cycle among those who pass their current grade
popent1 Population in age cohort entering 1st grade in primary
popent1ncoh Number of non-cohort (non-1st-year-primary-age) entrants to first cycle
shrlabent Share of drop-outs and leavers in cycle c that enter the labour force
shrlabent2 Share of labour force age cohort outside school system that enter labour type f
poplabent1 Population in age cohort entering labour force (age at end of a educ cycle)
β1 Intercept for the wage curve
β2 Elasticity of the wage curve
lambdakf Share of capital income going to households
iri Interest rate for internal debt
irpf Interest rate for private foreign debt
irgf Interest rate for government foreign debt
lambdag Share of capital income going to government
shrginv Share of public investment
tmg Margin rate
δ Depreciation rate for capital
γ Depreciation rate for capital
λ Elasticity of investment to the capital rate of return
mort Mortality rate
trans Transition from youth to non youth