HAL Id: tel-01569067
https://pastel.archives-ouvertes.fr/tel-01569067
Submitted on 26 Jul 2017
HAL is a multi-disciplinary open access
archive for the deposit and dissemination of
sci-entific research documents, whether they are
pub-lished or not. The documents may come from
teaching and research institutions in France or
abroad, or from public or private research centers.
L’archive ouverte pluridisciplinaire HAL, est
destinée au dépôt et à la diffusion de documents
scientifiques de niveau recherche, publiés ou non,
émanant des établissements d’enseignement et de
recherche français ou étrangers, des laboratoires
publics ou privés.
An innovative system for electrical vehicular charging in
urban zone : conception, dimensioning, and performance
evaluation
Mario Alberto Alvarado Ruiz
To cite this version:
Mario Alberto Alvarado Ruiz. An innovative system for electrical vehicular charging in urban zone :
conception, dimensioning, and performance evaluation. Electric power. Télécom ParisTech, 2015.
English. �NNT : 2015ENST0057�. �tel-01569067�
T
H
È
S
E
1 2015-ENST-0057 EDITE - ED 130Doctorat ParisTech
T H È S E
pour obtenir le grade de docteur délivré par
TELECOM ParisTech
Spécialité “Informatique et Réseaux”
présentée et soutenue publiquement par
Mario Alberto ALVARADO RUIZ
le 25 septembre 2015
Stratégies de recharge pour véhicules électriques
connectés à un réseau public d’éclairage
Directeur de thèse: Maurice GAGNAIRE Co-encadrement de la thèse: Fadi ABI-ABDALLAH
Jury
M. Ken CHEN,Professeur, Université Paris 13 Rapporteur
M. Bernard COUSIN, Dr. Professeur, Université de Rennes 1 Rapporteur
M. German CASTIGNANI,Dr. Chercheur Associé, Université du Luxembourg Examinateur
Mme. Jocelyne ELIAS,Dr. Laboratoire d’informatique Paris Descartes, LIPADE Examinateur
TELECOM ParisTech
école de l’Institut Mines-Télécom - membre de ParisTech 46 rue Barrault 75013 Paris - (+33) 1 45 81 77 77 - www.telecom-paristech.fr
Charging strategies for electric vehicles connected to street lighting networks
Abstract:
In order to reduce the impact of global warming, the European Commission has decided in
the continuation of the Kyoto protocol to reduce drastically greenhouse gas emissions. In
this matter, the progressive replacement of thermal vehicles by electric ones is considered
as a key objective. For that purpose, several prerequisites must be considered for the
rapid deployment of Electrical Vehicles (EV) in the European market. The first of these
prerequisites consists in the design of a new generation of batteries with higher energy
efficiency, larger capacity and improved robustness. The second one is the design and rapid
deployment of cost effective charging infrastructures. At last, the emergence of European
standards in all these matters is an imperious necessity for the viability of the EVs European
market. This thesis is mainly focused on the second of these three prerequisites. It is widely
admitted that in the short term, EVs usage will be essentially limited to urban areas
before being extended to the whole territory. As it is considered by the French National
TELEWATT research project to which we have contributed, street lighting networks can
be used judiciously to deploy in the short term low cost charging infrastructures. The basic
principle of this project consists in coupling to each street light one or two EV’s charging
stations if one or two parking spots are located nearby.
Various electrical constraints
specified in the TELEWATT project must be satisfied to enable EVs’ charging without
degrading the quality of the lighting system. In this thesis, we begin to demonstrate the
feasibility of such an operation. For that purpose, we have developed a simulator enabling
to depict the dynamic behavior of the global system. The strength and originality of this
simulator resides in its capacity to determine in real-time and with the necessary precision
if an EV can effectively be connected to a charging station. The response to this question
depends on static and dynamic characteristics of the street lighting network and on the
state of charge of the batteries of both the connected and candidate EVs. The dynamism
of the charging process of each EV strongly depends on the instantaneous power consumed
by the global infrastructure. The second original result of this thesis consists in the design
of scheduling policies to activate the various charging stations. Our objective is to propose
via these scheduling policies, various types of guaranteed Quality of Service (QoS) to the
end-users. Such guarantees can be declined for instance in terms of expected state of charge
for a given parking term.
Keywords: Smart Charging, Electric Vehicles, Street Lighting Networks, Energy
Man-agement.
ii
Stratégies de recharge pour véhicules électriques connectés à un réseau public d’éclai-rage
Résumé :
De façon à réduire l’impact du réchauffement climatique, la Commission Européenne a
décidé dans le prolongement du protocole de Kyoto de réduire drastiquement les émissions
de gaz à effet de serre. En la matière, le remplacement progressif des véhicules thermiques
par des véhicules électriques est considéré comme un objectif clé. Dans ce but, plusieurs
prérequis doivent être pris en compte pour le déploiement rapide des véhicules électriques
sur le marché européen. Le premier de ces prérequis consiste en la conception d’une nouvelle
génération de batteries avec une efficacité énergétique accrue, une plus grande capacité et
une robustesse améliorée. Le second prérequis est la conception et le déploiement rapide et
économique d’infrastructures de recharge. Enfin, l’émergence de normes européennes dans
tous ces domaines est une impérieuse nécessité pour la viabilité économique du marché
européen des véhicules électriques. Cette thèse se focalise essentiellement sur le second de
ces trois prérequis. Il est largement admis qu’à court terme, l’usage des véhicules électriques
sera essentiellement limité aux zones urbaines avant d’être étendu à tout le territoire. Tel
que cela est pris en compte par le projet de recherche national TELEWATT dans lequel
nous avons été impliqués, les réseaux d’éclairage publics en zones urbaines peuvent être
utilisés judicieusement pour déployer à court terme des infrastructures de recharge bon
marché. Le principe de base de ce projet consiste à connecter à chaque candélabre une ou
deux stations de recharge pour véhicule électrique si une ou deux places de parking sont
disponibles dans l’environnement proche. Diverses contraintes électriques spécifiées dans le
projet TELEWATT doivent être satisfaites pour permettre la recharge de véhicules
élec-triques sans perturber la qualité de l’éclairage. Dans cette thèse, nous commençons par
démontrer la faisabilité d’une telle opération. Pour cela, nous avons développé un
simu-lateur permettant de décrire le comportement dynamique du système global. La force et
l’originalité de ce simulateur réside dans sa capacité à déterminer en temps-réel et avec la
précision nécessaire si un véhicule électrique peut effectivement être connecté à une borne.
La réponse à cette question dépend des caractéristiques statiques et dynamiques du
ré-seau d’éclairage et de l’état de charge des véhicules déjà connectés comme des véhicules
candidats. La dynamique du processus de recharge de chaque véhicule électrique dépend
fortement de la puissance instantanée consommée par l’infrastructure globale. Le second
objectif original de cette thèse consiste en la conception de politiques d’ordonnancement
d’activation des diverses bornes de recharge. Notre objectif est de proposer, via ces
poli-tiques d’ordonnancement, divers types de qualité de service (QoS) garanties aux usagers.
De telles garanties peuvent par exemple se décliner en termes d’état de charge attendu pour
une certaine durée de stationnement.
Mots clés : Rechargement Electrique Intelligente ; Véhicules Electriques ; Réseaux
d’Eclairage Publique, Gestion de l’Energie.
Contents
List of Figures . . . vi
List of Tables . . . ix
Acknowledgements xiii 1 Introduction 1 1.1 Motivation, Objectives and Thesis Outline . . . 1
1.2 Contributions of this Thesis . . . 5
1.3 Thesis Outline . . . 6
1.4 Publications. . . 6
I
Electric Vehicle Charging Infrastructures
7
2 Electric Vehicles and Charging Infrastructures 9 2.1 Introduction. . . 102.2 Electric Vehicles . . . 10
2.2.1 Electric Vehicle Drive System Architectures . . . 10
2.2.2 Batteries for Electric Vehicles . . . 11
2.2.3 Drivers Anxiety. . . 17
2.3 Electric Vehicle Supply Equipment . . . 18
2.3.1 Charging Connectors. . . 18 2.4 Charging Modes . . . 20 2.4.1 Charging Schemes . . . 22 2.4.2 Charging Locations. . . 24 2.4.3 Charging Architectures . . . 24 2.5 E-Mobility Market . . . 25
2.5.1 Electric Vehicle (EV) Charging Over the Public Lighting System (PLS) . . 26
2.5.2 Integration of the e-Mobility Market, the Electricity Market and the Public Lighting System (PLS). . . 26
2.6 The PLS Electrical Network . . . 27
2.6.1 PLS Power Consumption Profile . . . 28
2.6.2 Electric Operational Constraints . . . 29
iv Contents
2.7 Conclusion . . . 29
3 Development of Simulation Tools 31 3.1 Introduction. . . 32
3.2 Modeling of the PLS Electrical Network . . . 32
3.3 Graph Theory Applied to the Design of Electric Circuits . . . 33
3.4 Voltage and Current Computation of the Loads . . . 37
3.4.1 Branch’s Voltage and Current Computation . . . 37
3.5 Power Computation in Real Time. . . 40
3.5.1 Gauss-Jordan Results . . . 42
3.6 Summary . . . 42
II
Smart Charging Strategies
45
4 Conservative Strategies for Electric Vehicle Charging 47 4.1 Introduction. . . 474.2 Smart Charging over Public Lighting Systems . . . 48
4.2.1 Task Modeling of the Loads . . . 48
4.2.2 Dumb Charging . . . 49
4.2.3 Conservative Charging Strategy on a First Come First Served Basis . . . . 49
4.3 Experimental Setup for Conservative EV Charging . . . 55
4.3.1 Electric Network Assumptions . . . 55
4.3.2 Evaluation Constraints. . . 57
4.3.3 EV Selection of a Charging Point. . . 58
4.4 Performance Metrics . . . 59
4.4.1 Acceptance Rate of Vehicles . . . 60
4.4.2 Average Transmission and Distribution Power Losses . . . 60
4.4.3 Dispatched Vs. Demanded Energy Ratio. . . 60
4.4.4 Average Unserved Energy . . . 61
4.4.5 Quality of Service and State of Charge (SoC) at Time of Departure . . . . 61
4.5 Numerical Results . . . 62
4.5.1 Total Number of Accepted Vehicles. . . 62
4.5.2 Average Transmission and Distribution Power Losses . . . 63
4.5.3 Dispatched Vs. Demanded Energy Ratio. . . 65
4.5.4 Average Unserved Energy . . . 66
4.5.5 Quality of Service and SoC at Time of Departure . . . 67
4.6 Summary . . . 69
5 On-Line Scheduling Strategies for Electric Vehicle Charging 71 5.1 Introduction. . . 72
5.2 The Flexible Scheduling Task Model - FlexTaSch . . . 72
5.2.1 A Less Conservative Approach to Have More Flexible Tasks . . . 73
5.2.2 Loads Modeled as Tasks . . . 73
5.2.3 On-line Scheduling and Task Dispatching . . . 75
5.2.4 Flexible On-line Scheduling Policies . . . 76
Contents v
5.3.1 Electrical Network Assumptions . . . 80
5.3.2 Recharge Demand Parameters . . . 83
5.4 Performance Metrics . . . 84
5.4.1 Vehicle Acceptance Ratio . . . 85
5.4.2 Average Distribution Power Losses . . . 85
5.4.3 Demanded Vs Dispatched Energy Ratio . . . 85
5.4.4 Average Unserved Energy . . . 86
5.4.5 Quality of Service and SoC at Time of Departure . . . 86
5.5 Numerical Results . . . 86
5.5.1 Vehicle Acceptance Ratio . . . 87
5.5.2 Average Distribution Power Losses . . . 88
5.5.3 Ratio Between Dispatched and Requested Energy . . . 88
5.5.4 Average Unserved Energy . . . 91
5.5.5 Quality of Service and SoC at Time of Departure . . . 93
5.6 Summary . . . 98
6 Minimum Quality of Service (QoS) for EV Charging 99 6.1 Introduction. . . 100
6.2 From Best Effort to Minimum Charge Warranty . . . 100
6.2.1 Charging Behavior of EV Drivers . . . 100
6.2.2 Average Travel Distance . . . 101
6.2.3 Influence of Environmental Temperature on Battery Performance. . . 102
6.2.4 Conversion From Minimum Range Distance Into a Charge Requirement . . 102
6.2.5 Loads Modeled as Tasks . . . 103
6.2.6 On-line Scheduling and Task Dispatching . . . 104
6.3 Experimental Setup . . . 106
6.3.1 Electrical network assumptions . . . 109
6.3.2 State of Charge and Charge Rates . . . 109
6.4 Performance Metrics . . . 110
6.5 Numerical Results . . . 111
6.5.1 Acceptance Rate of Vehicles for Charging . . . 111
6.5.2 Average Transmission and Distribution Power Losses . . . 112
6.5.3 Ratio Between Dispatched Energy and Requested Energy . . . 112
6.5.4 Average Unserved Energy . . . 115
6.5.5 Quality Of Service and SoC at Time of Departure . . . 115
6.5.6 Global Results for Scheduling Policies . . . 121
6.6 Summary . . . 123
7 Conclusion and Perspectives 125 7.1 Conclusion . . . 125
7.2 Perspectives . . . 128
8 Résumé en Français 131 8.1 Introduction. . . 131
8.2 Les Contributions de cette Thèse . . . 135
8.3 Contenu de cette thèse . . . 136
vi Contents
8.5 Résumé des chapitres. . . 137
8.5.1 Développent du simulateur du réseau électrique . . . 138
8.5.2 Stratégies de recharge intelligente. . . 138
8.5.3 Stratégies de recharge en ligne pour la recharge de VEs . . . 140
8.5.4 Qualité de service minimale pour la recharge des VEs . . . 142
8.5.5 Résultats globales des stratégies de recharge. . . 145
8.6 Perspectives . . . 147
A Charging Strategies Performance Evaluation 149 A.1 Public Lighting System Electrical Network. . . 150
A.1.1 EV Market in France. . . 150
A.2 Detailed Results for Conservative First Come First Served (CFCFS) . . . 152
A.2.1 Quality of Service for Conservative Task Scheduling Approach (CoTaSch) . 152 A.3 Detailed Results for Minimum State of Charge Warranty (MSoCW) . . . 155
A.4 Total Results for all Scheduling Policies . . . 155
List of Figures
2.1 EV and PHEV system as presented in [43]. . . 12
2.2 Typical Li-ion battery charging profile according to [43] and [62]. . . 17
2.3 AC and DC power plugs available. Figure taken from [28].. . . 21
2.4 E-Mobility market and the PLS grid added to the electricity market model. . . 27
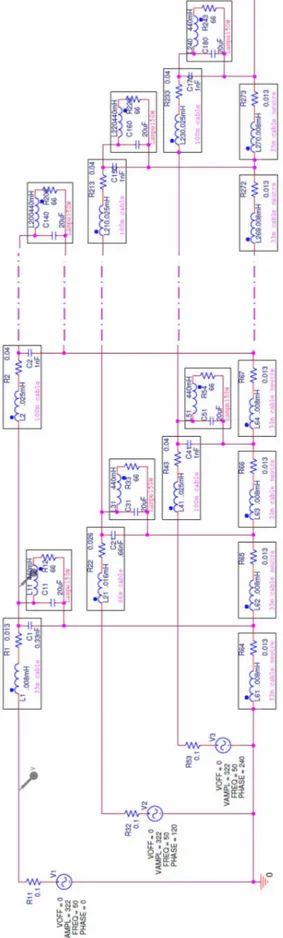
3.1 Circuit diagram of the electric network considered on the Public Lighting System in the model proposed. . . 34
3.2 Values considered for the electric circuits of the network.. . . 35
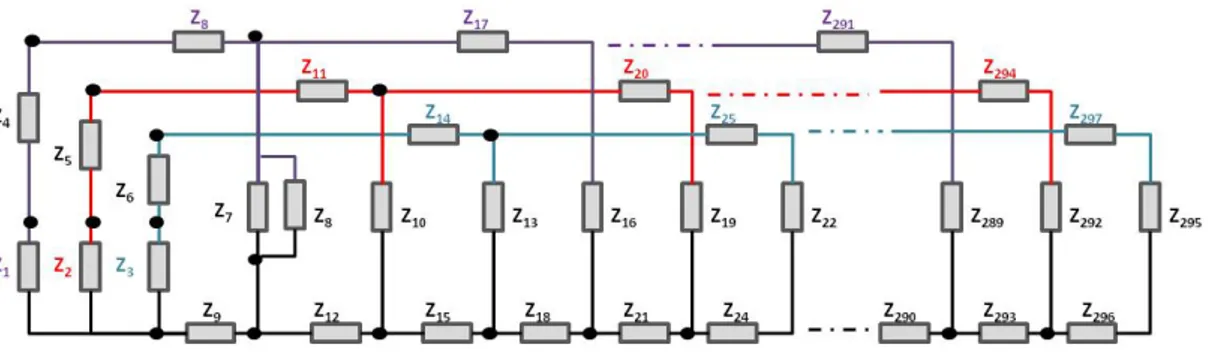
3.3 Representation of electric circuits as impedances. . . 36
3.4 Representation of the electric network in terms of their equivalent impedances. . . 36
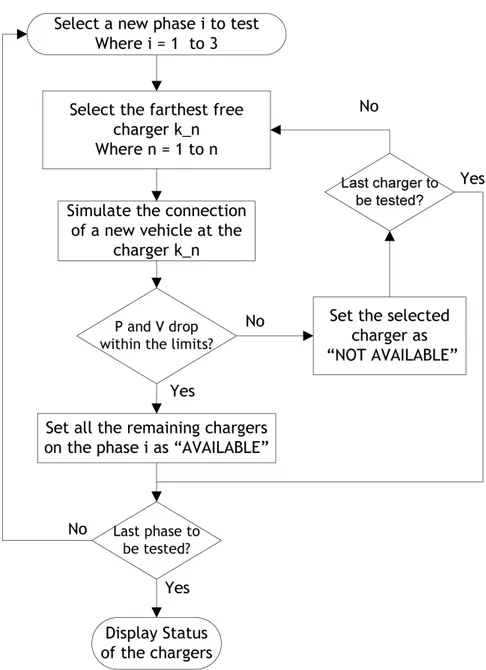
4.1 Procedure for updating the electric availability status of a given charging point. . . 52
4.2 Conservative task dispatch approach . . . 54
4.3 Daily profile of power available on the network for EV charging at the PLS . . . . 56
4.4 Rejection rate of vehicles within CFCFS.. . . 64
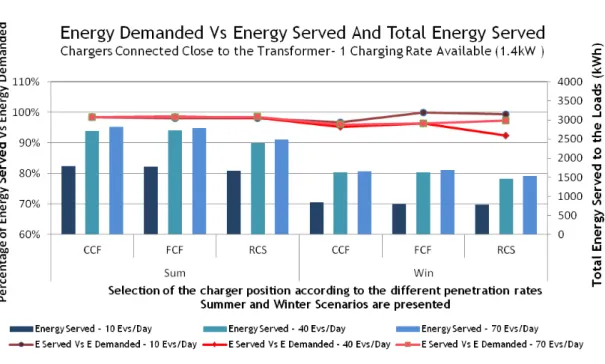
4.5 Average transmission and distribution losses and the relation between the total energy losses Vs the total amount of served energy to the loads, considering only one charge rate available (1.4kW) and all the chargers connected close to the transformer. 65 4.6 Total served energy (in kWh) and percentage of served energy from the total de-manded energy by the loads considering only one charge rate available (1.4 kW) and all chargers connected near the transformer. . . 66
4.7 Average energy unserved per hour at the network when chargers are connected near the transformer and only one charge rate is available (1.4 kW). . . 67
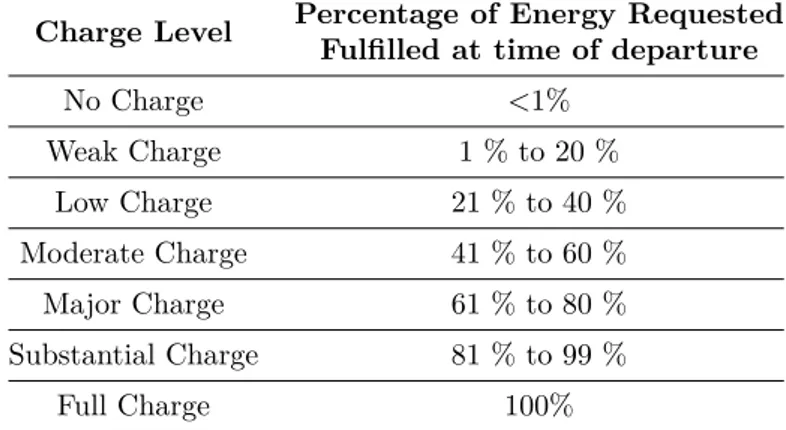
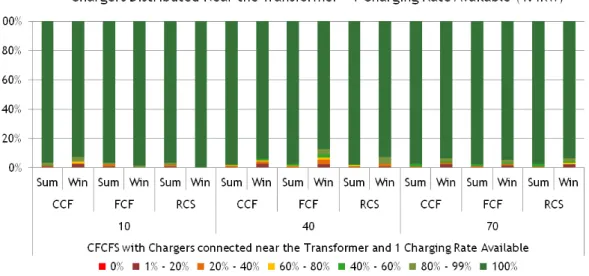
4.8 Level of fulfillment for the charge process at time of departure. . . 68
5.1 Updating process for the task manager used for on-line scheduling strategies. . . . 77
5.2 Charge rate adjustment for all connected EVs performed by the task scheduler of the Central Control Manager (CCM). . . 81
5.3 Daily profile of available power for EV charging at the PLS within the Flexible Task Scheduling Approach (FlexTaSch) approach. . . 83
5.4 Percentage of accepted EVs for charging in summer and winter scenarios considering different charge rates and Charging Point (ChP) installed. . . 89
viii List of Figures
5.5 Average transmission and distribution losses per hour and the relation between the total energy losses Vs the total amount of energy served to the loads for winter and summer case scenarios with 9 chargers and 2 charge rate available. . . 90
5.6 Total energy served (in kWh) and the ratio between served energy and the total energy requested by the loads for summer and winter case scenarios with 12 ChP installed.. . . 92
5.7 Winter scenario 12 chargers and 3 charging levels . . . 93
5.8 Average unserved energy per hour at the network for different summer and winter case scenarios.. . . 94
5.9 Percentage of fulfilled energy requirement at EV’s time of departure during summer and winter scenarios with 12 ChP and 3 charge rates for CFCFS, Earliest Deadline First (EDF) and First Come First Served (FCFS). . . 96
5.10 Percentage of fulfilled energy requirement at EVs’ time of departure during summer and winter scenarios with 12 ChP and 3 charge rates for Highest Energy Shortfall First (HESF), Lowest Energy Shortfall First (LESF) and Least Laxity First (LLF). 97
6.1 Updating process for the task manager used for on-line scheduling strategies. . . . 107
6.2 Connection test of EVs according to the task scheduler before updating the charge rate values of the connected EVs. . . 108
6.3 Average acceptance rate of EVs with MSoCW and a comparison with the rest of the flexible policies and CFCFS. . . 113
6.4 Average transmission and distribution power losses and the relation between the total energy losses Vs the total amount of energy served to the loads, considering the summer and winter scenarios under MSoCW. . . 114
6.5 Total dispatched energy (in kWh) and the ratio between dispatched and requested energy by the loads for MSoCW with 2 charge rates available.. . . 116
6.6 Total served energy (in kWh) and the ratio between dispatched and requested en-ergy for winter scenarios with 2 charge rates for MSoCW in comparison with the rest of the policies. . . 117
6.7 Average Unserved Energy per hour at the network for all summer & winter case scenarios and MSoCW . . . 118
6.8 Percentage of charge reached at the time of departure from the total energy re-quirement demanded at arrival time for all summer and winter scenarios under MSoCW . . . 119
6.9 Percentage of charge reached of the minimum energy requirement corresponding to the minimum charge requirement demanded at the time of departure for all summer and winter scenarios under MSoCW . . . 120
6.10 Average performance for each scheduling policy according to a given metric. . . 122
8.1 Performance moyenne de chaque stratégie de recharge par rapport à chacune des métriques disponibles. . . 146
A.1 Full electric diagram of the PLS electric network with 90 lamps and 1 charger connected. . . 151
A.2 SoC reached at Time of Departure for 1 charging rate available (1.4 kW) and all the chargers connected near the transformer. . . 152
List of Figures ix
A.3 SoC reached at Time of Departure for 2 charging rates available (1.4 kW or 3.3 kW) and all the chargers connected near the transformer. . . 153
A.4 SoC reached at Time of Departure for 1 charging rate available (1.4 kW) and all the chargers connected along the feeder. . . 154
List of Tables
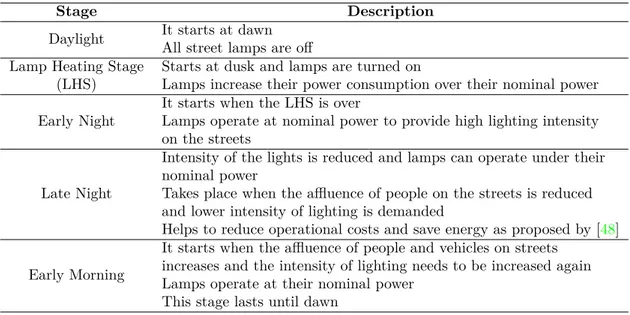
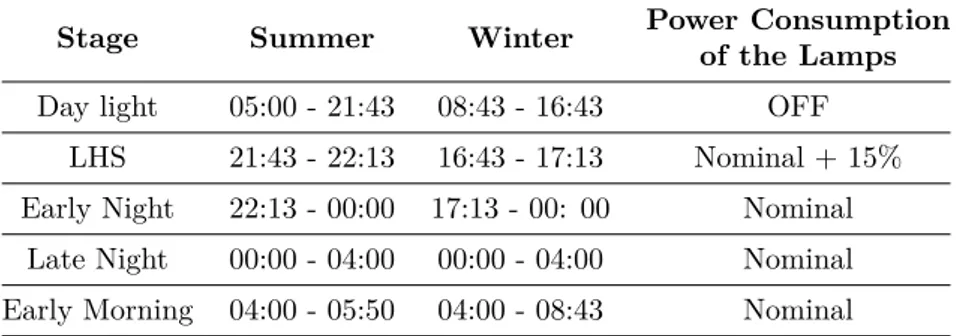
2.1 Definition of each stage present on the PLS through the day. . . 28
4.1 Power consumption of the lamps on the PLS according to the daylight conditions for summer and winter scenarios . . . 56
4.2 Distribution of time of arrival for the vehicles during a normal day according to their group. . . 58
4.3 Battery capacity considered for each type of vehicle and the charge rates allowed by the network within the CoTaSch approach.. . . 59
4.4 Percentage of served energy to the battery from the initial energy request. . . 62
4.5 Summary of network conditions and scenarios considered for the Conservative Task Scheduling approach(CoTaSch). . . 62
5.1 Lists used by the task scheduler to sort and schedule the jobs according to the priority given by the Charging Service Operator (CSO) in the FlexTaSch. This example follows the EDF strategy. . . 80
5.2 Power consumption of lamps on the PLS according to the daylight conditions for the summer and winter scenarios, considering the dimming of the lamps during the late night stage.. . . 82
5.3 Considered battery capacity according to the type of vehicle and the charge rates supported by the network chargers [8,14,35,46]. . . 84
5.4 Distribution of time of arrival and parking time for EVs during a normal day ac-cording to their group of arrival. . . 84
5.5 Percentage of dispatched energy from the total energy requested by the EV. . . 86
5.6 Summary of network conditions and scenarios considered for the FlexTaSch ap-proach of the model, based on on-line scheduling of the tasks with more flexibility. 87
5.7 Comparison of rejection rates for CFCFS between the FlexTaSch and the CoTaSch approach for simulated scenarios with 9 chargers and 2 charge rates available (1.4 kW and 3.3 kW). . . 88
6.1 Lists used by the task scheduler for defining the order of connection of the tasks under MSoCW. . . 106
xii List of Tables
6.3 Power consumption of the lamps on the PLS according to the daylight conditions for the summer and winter scenarios considering the dimming of the lamps during
the late night stage. . . 109
6.4 Battery capacity according to the type of vehicle [8,14,35], the charge rates sup-ported by the charger and the minimum distance range to guarantee to the driver. 110 6.5 Distribution of time of arrival and time of departure for EVs during a normal day according to their group of arrival. . . 110
6.6 Percentage of energy served to the battery from the total energy requested. . . 111
6.7 Summary of network conditions and scenarios for the second approach of the model based on an on-line scheduling of the tasks with a warranty of a minimum charge requirement provided at time of departure. . . 111
8.1 Résumé des conditions et scenarios testés pour l’approche(CoTaSch). . . 140
8.2 Résumé des conditions et scenarios testés pour l’approche FlexTaSch, pour les stratégies de recharge en ligne. . . 141
8.3 Comparaison du taux de rejet de VEs pour CFCFS entre les approches FlexTaSch et CoTaSch pour les scénarios de simulation avec 9 chargeurs et 2 taux de recharge disponibles (1.4 kW et 3.3 kW). . . 141
A.1 Sales distribution of EVs and Plug-in Hybrid Electric Vehicles (PHEVs) in France in 2013. . . 150
A.2 SoC reached at Time of Departure considering only one charging rate available of 1.4 kW and all the chargers connected near the transformer. . . 153
A.3 SoC reached at Time of Departure considering two charging rates available of 1.4 kW and 3.3 kW and all the chargers connected near the transformer. . . 154
A.4 SoC reached at Time of Departure considering one charging rate available of 1.4 kW and all the chargers are distributed through the feeder. . . 155
A.5 Acceptance rate of EVs for charging. . . 156
A.6 Average amount of transmission losses registered . . . 157
A.7 Ratio between registered losses and the energy dispatched to the loads.. . . 158
A.8 Total served energy for the summer case scenario . . . 159
A.9 Ratio between dispatched and requested energy . . . 160
Acknowledgements
I would like to express my deepest appreciation and gratitude for the help and support to the following persons who in one way or another, disregarding the distance, have contributed in making this work possible.
In first place I want to thank my director Maurice Gagnaire for welcoming me in his research group and for the opportunity join this project, as well for his support and specially for all his patience. I would like to express my special gratitude and thanks to my advisor Fadi Abi-Abdallah for his support and for pushing me to get the results that we needed.
Besides my thesis advisors, I would like to thank the rest of my thesis committee: Prof. Ken Chen, Prof. Bernard Cousin, Dr. German Castigniani and Dr. Jocelyne Elias, for generously offering their time and good will throughout the preparation and review of this document.
I thank my fellow labmates in for their encouragement and support, but specially for the good time we had in the last years. Thank you Sawsan, Elias, Mayssa, Karel, Isabel, Bassem, Amal, Antoine, Danilo, Adel, Mattia, Steffano, Kevin, Hao, Yimeng, Yue li, Luis, Pablo, Shabbi, Kasia, Claudio, Ghida, Ahmed, Antonio and Xavier.
Friendship is stronger than the distance, so I want to thank to all my friends that from near or from the other side of the world were always supportive. Thanks to Diego, Elisa, Pelayo, Ricardo, Daniel S., Raúl, Daniel R., Coral, Daniela, Alberto, Angy, Amparo, Javier, Gabo, Luis S., Franck, Yao, Melissa, Vivi, Ola, Omar, Shuri, Yanli, Adrien, Yunshi, Nan, Damien, Aude, Blandine, Lucia, Makpal, Steffi, Sini, Hugo, Clément, Patrick, Agnès, Marguerite, Nicolás, Zayra, Liz, Andréa, Alex, Morgane, Marielle, Carolina, Pamela, Baska, Petra, Linda, Ortab, Héctor, Ujjwal, Candy, Margarita and Nago. A very special mention and my deepest gratitude go for Felipe and Marek. You not only helped me when I needed it the most, but never stop believing in me and you never let me quit, so for that and much more I will always be grateful. Sveta, thank you for bringing the light when I was in the dark, words would not be enough to thank you for that.
Last but not the least, I would like to thank my family: in particular to my parents and my sister for supporting me in every possible way, every single day of my life, but specially throughout the writing of this thesis. Thank you for making me every day a better man, gracias.
List of Acronyms
ABM Activity Based Model
ADEME Agence de l’Environement et de la Maîtrise de l’Energie
BMS Battery Management System
BSS Battery Swapping Station
CCF Closest Charger First
CCM Central Control Manager
CCS Combined Charging System
CFCFS Conservative First Come First Served
CHAdeMO Charge de Move
ChP Charging Point
CoTaSch Conservative Task Scheduling Approach
CSO Charging Service Operator
DoD Depth of Discharge
DSO Distribution System Operator
EDF Earliest Deadline First
EM Electric Motor
e-MSP e-Mobility Service Provider
ESR Electricity Supply Retailer
EV Electric Vehicle
EVSE Electric Vehicle Supply Equipments
ExpTiEoC Expected Time to End of Charge
FCF Farthest Charger First
FCFS First Come First Served
FlexTaSch Flexible Task Scheduling Approach
HESF Highest Energy Shortfall First
HEV Hybrid Electric Vehicles
ICE Internal Combustion Engine
ICEV Internal Combustion Engine Vehicle
ICV Internal Combustion Vehicle
IEC International Electrotechnical Commission
LHS Lamp Heating Stage
LLF Least Laxity First
LV Low Voltage
MSoCW Minimum State of Charge Warranty
NEDC New European Driving Cycle
PHEV Plug-in Hybrid Electric Vehicle
PLC Power Line Communications
PLS Public Lighting System
PNO Private Network Operator
PTA Processor Time Allocation
QoS Quality of Service
RCS Random Charger Selection
RES Renewable Energy Sources
SAE Society for Automotive Engineers
SoC State of Charge
SoH State of Health
TMS Thermal Management System
TSO Transmission System Operator
V2G Vehicle to Grid
V2H Vehicle to Home
V2V Vehicle to Vehicle
WPT Wireless Power Transfer
VE Véhicule Electrique
EAVE Equipement d’Approvisionement des Véhicules Electriques
ARP Allocation des Ressources du Processeur
Chapter
1
Introduction
1.1
Motivation, Objectives and Thesis Outline
Massive industrial and agricultural activities have generated during these last decades carbon emissions that are considered nowadays as a real risk for the future of our planet. In this context, the major and always growing concern over climate change has recognized the reduction of carbon emissions as the most important alternative to prevent an irreversible increase of the temperatures. Many governments have set ambitious goals for the next years in order to reduce greenhouse gas emissions, to improve air quality in urban areas and to reduce our dependence on fossil fuels [18,36,58,73]. Thus, the European Union (EU) aims to reduce greenhouse gas emissions from the year 1990 to the year 2020 by 20%. In parallel, the EU also wants to increase in the same proportion the energy obtained from Renewable Energy Sources (RES) [3]. Aligned with these objectives, the integration of EVs into the automobile market and the electric grid is of a great interest. At the date of publication of this manuscript, the installed capacity for energy production and distribution is still sufficient to absorb the demand of energy from the limited number of
EVs charging stations, which is directly related to the very limited number of operational EVs. However, it is noticeable the interest and investment of all major car manufacturers to produce electric models for the market in all developed countries. It is then clear that it will become rapidly necessary to foresee an upgrade of the electrical grid to support this new energy demand. In this matter, the introduction at a large scale ofRES in order to progressively substitute the proportion of the energy mix produced by traditional power plants seems irreversible.
Electro mobility (or e-mobility) is the key technology required to provide an alternative to fossil energy sources and in consequence reduce carbon emissions in the long term [75]. It is characterized by a diversified set of technological solutions which enable the deployment of affordable and efficient batteries and power trains for the electric propulsion of full electric and hybrid vehicles . However, it is still difficult to foresee the speed at whichEVs models will progressively flood the car market. Major information technology research and advisory companies such as Gartner, Ernst and Young or Deloitte are trying to predict how and when such a technological revolution will occur. There are different challenges to overcome, from the point of view of the distribution network as well as from the final user perspective. We can predict that the massive deployment of EVs charging infrastructures in parallel to the requirements of domestic appliances will necessitate a redesign
2 1.1. Motivation, Objectives and Thesis Outline
of the power distribution network. The analysis of this redesign is out of the scope of this thesis. Several factors must be considered to evaluate the speed at which EVs should replace existing combustion vehicles in developed countries:
1. The cost of EVs: According to an economic analysis of the FrenchEV market [69], since the year 2013, thanks to different tax credits and incentives from government agencies, the acquisition price of an EV is getting closer and in some cases overtaking the price of its thermic version. For instance, the Smart Fortwo Electric Drive is available from 12500 euros compared to the 13500 euros of its thermic version, the Smart Fortwo Essence.
2. Technological constraints inherent to battery technology: Existing batteries are characterized by two major drawbacks. First, their capacity remains limited, this capacity being directly linked to the weight of the battery itself. At the date of publication of this manuscript, the batteries installed in the vehicles of the upper category enable ranges of the order of 200 kilometers and up to 420 kilometers [23]. This is a priori less than the achievable range offered by thermic vehicles, but this gap tends to decrease year after year thanks to the development of a new generation of battery’s charging technology (such as induction-based recharging techniques). Second, the speed at which a battery can be charged is a real constraint for the end-users. As an indication, a full charge from empty can take up to 8 hours charging at 3.3 kW. This is clearly a strong commercial constraint that will limit for the very next years the usage of low and medium classEVs to urban moves. Meanwhile, like regular advances are observed in terms of battery capacity, advances are also expected in terms of charging speed and the installation of high speed charging stations, which are at the present time quite limited.
3. The very limited coverage of the existing charging infrastructures: DeployingEV
charging infrastructures is costly since it necessitates in most cases heavy civil engineering. Before such infrastructures are deployed at a large scale, EVs will probably be used by most of the drivers mainly in urban areas. Most of the car manufacturers also promote the installation of private charging stations in the garage ofEVowners. Intercity journeys with
EVs will probably remain for a few years the privilege of wealthy customers with access to
EVs with high energy capacity until high speed charging stations are deployed in motorway corridors connecting major cities.
4. The anxiety ofEV drivers: Today, since the number of existing public charging stations
remains focused in the hyper center of the cities, EV drivers may apprehend to do not have enough capacity in their battery to join their destination. In other terms, the "out of gas anxiety" sometimes mentioned in the literature could probably play as a brake to the rapid deployment of EVs on the market, and more specifically, on the interurban market. The technological constraints inherent to this anxiety will be particularly investigated in this thesis. Beyond the analysis that will be provided in this manuscript, the Federal Department of Transportation of the United States considers that a huge market will emerge in the very next years in matter of cartographic tools. Such tools are supposed to reduce the "out of gas anxiety" ofEVdrivers by including the geographical position of the available public charging stations along the journey submitted by the driver before his departure.
In France, more than 2 million of EVs are expected for the year 2020 [41]. Without the proper infrastructure to provide charging services, the growth of the EV’s market could be at
Chapter 1. Introduction 3
risk. Charging infrastructures for EVs include a set of elements known as Electric Vehicle Sup-ply Equipments (EVSE) such as connectors, conductors and other equipment associated to the charging stations.
In recent years, the infrastructures deployed forEVcharging have significantly evolved, propos-ing new approaches and pushpropos-ing researchers to find new solutions for reducpropos-ing the time of charge or to improve the charging mechanisms which could benefit from the inclusion of energy fromRES
into the grid. Wired charging has evolved from slow and risky connections on household plugs, to fast charging stations and secure connections at public and private charging stations for the convenience of the users. Nevertheless, some issues still need to be solved. Thus, the standardiza-tion at a European and at an internastandardiza-tional scale of the supply equipment is of key importance for the viability of EVs’ market. Last but not least, the problem of choice of the optimal locations to install new charging stations is quite complex since it is both subject to technical and economic constraints.
Different approaches have come to the US market relying on the Battery Swapping Station (BSS) concept. BSS consists in replacing low charged batteries with fully charged batteries at a specially designed swapping station in a few of minutes [4,24]. However, this approach needs to be revisited along with its business model in order to be fully and successfully exploited. The failure of the Better Place pre-commercial experiment has outlined the limits of this approach [15]. On the other hand, Wireless Power Transfer (WPT) is another promising charging concept that has gained a lot of attention in recent years from researchers and charging equipment manufacturers as well. The WPT concept aims to reduce the security issues inherent to wired charging. It has been shown that it is possible to proceed to the charging of the batteries of movingEVs by means of the installation of inductive loops in the road surface itself. Such an alternative approach could solve de factor the problem of the achievable range of next generation EVs. At the date of publication of this manuscript, the massive deployment of such inductive loops in the road surface still depends on improving the efficiency of the charging infrastructure at a reasonable cost.
The most urgent need in allEVmarkets is the financing for the rapid deployment of charging infrastructures [20]. The installation costs of EVSE could be very high, especially when the electrical network (the transformer and/or the distribution cables) must be upgraded or when civil engineering work is required. If it is not planned carefully, the charging infrastructure may be over-estimated for the actual needs of the market and lead to unused assets. For this reason, in a public context, the deployment ofEVSEshould not target the simple maximization of the number of charging spots, but rather the optimization of the combination of the various CAPEX/OPEX costs that best satisfy theCSObusiness models.
The rapid deployment of charging stations in urban areas is not only important to reduce drivers range anxiety but, it constitutes a real challenge as well. In this thesis, we present an innovative approach consisting in reusing existing PLSelectrical network (also referred as Street Lighting Networks) for EV charging. In this architecture, the primary service provided by the
PLS is the lighting of the streets. However, during the day when the lamps are inactive, the available power provided by the transformer serving the considered charging infrastructure can be potentially used to feedEV’s charging stations. To the best of our knowledge, two testbeds of that type are currently under validation in the cities of Aix-en-Provence in France [70], and in the city of Munich in Germany [11], [1]. Two main advantages characterize these two approaches:
4 1.1. Motivation, Objectives and Thesis Outline
without costly civil engineering and without requiring an upgrade of the street lighting net-work . The main constraint that must be satisfied is the proximity of the parking spots with the lighting poles. It is also necessary to guarantee by means of preliminary power computa-tions that the number of simultaneous active charging stacomputa-tions remains compatible with the power provided by the transformer. In this matter, two regimes must be distinguished: day and night power consumption profile. At evidence, the potential number of simultaneous active charging stations is lower at night than during the day.
• It appears that for most of the existing street lighting networks, a fraction of the unused power of the transformer can benefit the charging stations. In the remaining of this thesis, we shall assume that the installed capacity of the transformer is sufficient to cover the power demand when all the street lights are active. We know that this assumption is realistic in reference to the characteristics of existing street lighting infrastructures. In this matter, safety margins are considered by the professionals of street lighting networks in order to guarantee the stability and the quality of the lighting system.
To the best of our knowledge, the way most of the street lighting network operators manage the available power of their infrastructures is, in most cases, based on relatively rough calcula-tions. In this matter, the French company Citelum, with which a fraction of the work presented is this thesis has been achieved, can be considered as a leader. The aim of this thesis is to con-tribute to the research of newEV charging infrastructures that could be rapidly deployed at low CAPEX/OPEX costs thanks to the usage of existing street lighting networks. More precisely, we have contributed within the Computer Science and Networks Department of Telecom ParisTech to the specification of original numerical analysis techniques that enable a very precise real-time evaluation of the instantaneous available power at any point of a street lighting network equipped with charging stations. A fraction of the assumptions considered in this thesis have been inspired from the the TELEWATT research project. This project implying Telecom ParisTech, was placed under the supervision of the French company Citelum. It has been supported by the Agence de l’Environement et de la Maîtrise de l’Energie (ADEME), a subsidiary of the French Ministry of Industry. The objectives of the TELEWATT project are broader than the technical investigations carried out along this PhD thesis. The intelligence to manage the instantaneous available power at any point of the infrastructure is supposed to be located at the control management of the transformer. The description of the network protocol enabling the real-time dialogue between any charging station and any lighting point with the cabinet is out of the scope of this thesis. In summary, this thesis has three objectives:
• Our first objective is to build a simulation tool that is generic in the sense it can be applied to various configurations (single phase of three-phases infrastructures). The numerical results provided by our simulator must be in accordance with real measurements achieved on a real network. For that purpose, multiple scenarios have been considered in the context of the TELEWATT project. Disregarding the considered configuration of the electrical network, a constant quality of the lighting service is expected at night. Our software tool must be sufficiently generic to be applicable to a large number of network configurations. Each of these configurations may require different safety margins of the electrical characteristics of the system in order to guarantee a constant quality of the lighting service. Our tool must be sufficiently generic to be applicable to network conditions requiring different safety margins. These safety margins may vary according to the manufacturer of the street lighting network
Chapter 1. Introduction 5
and to the manufacturer of the charging stations.
• Our second objective is to make our tool exploitable in an operational environment. In oper-ational environment, random events corresponding to the connection or to the disconnection of an EV necessitates that the intelligence of the system implemented at the cabinet can respond in real-time to any connection request.
• Our third objective is to prove the feasibility of the charging model proposed by the TELE-WATT project and to design an innovative scheduling charging strategy that could provide a form of guaranteed QoS to the drivers. To the best of our knowledge, at the date of publication of this manuscript, the charging strategies available on the literature are mostly targeted to dedicated charging infrastructures and fleet charging. For the first case, all available resources of the network are exclusively designated for EV charging. While for fleet charging it is possible to know in advance the energy requirements of the vehicles. Our objective is to provide a minimum amount of energy to the user, which is the equivalent of a home to work traveling distance helping the EVdrivers to reduce their range anxiety.
1.2
Contributions of this Thesis
The contributions of this PhD thesis are summarized below:
• We have developed an original simulation tool enabling to emulate the performance of a commonPLSelectrical charging infrastructure. The originality of this tool is its capacity to deal with complex configurations with response times below the second of computation. For that purpose, we represent any charging infrastructure configuration as a directed graph. By applying some graph theory concepts to circuits theory, we are able to compute the voltage and current values at any dipole of the electrical network in real time. In the considered graph, each charging station is represented as a variable resistor. The value of this resistor has to be recomputed dynamically in order to maintain constant the delivered power to the connectedEV as otherEVs arrive or leave the charging station.
• Through various simulations scenarios, we have investigated charging infrastructures inspired by those considered in the French TELEWATT research project. We show via our numerical results that random connections and disconnections of EVs are feasible without putting at risk the normal operation of a PLSelectrical network. In a first step, an original charging strategy is proposed to guarantee an immediate charging to theEVs without disrupting the lighting service. In a second step, we investigate the performance of a set of on-line scheduling strategies proposed in the Processor Time Allocation (PTA) literature [71] adapting them to our research environment. These scheduling strategies enable a greater flexibility in the management of the charging process. We show how they enable a better use of the available resources extending the charging services to more users, which can be evaluated in terms of the acceptance connection ratio. Finally, we propose an original charging strategy that is oriented towards a form ofQoSservice guarantee. The originality of the considered simulated scenarios relies on their proximity with real life conditions.
• The analysis of various scheduling strategies under typical operational constraints has al-lowed us to evaluate the performance of PLS electrical network under various charging requests scenarios. These strategies consider the charging requests sequentially according
6 1.3. Thesis Outline
to their instant of occurrence. In other terms, our algorithms react to random events cor-responding to the arrival or to the departure of anEV at any of the charging points of the infrastructure. Such a constraint was a prerequisite since the finality of this work is to be applied to a real testbed in the context of the TELEWATT project.
1.3
Thesis Outline
This dissertation is organized in 7 chapters. In Chapter2we briefly describe the currently available powertrain architectures and the most important elements of the supply equipment installed at charging stations. In Chapter3 we describe the methodology used for developing the simulation tool used in this research project. Chapter4presents a conservative approach for the management of the charging process of the vehicles. In this chapter we present a conservative on-line scheduling strategy, which aims to prove the feasibility of the charging model proposed by TELEWATT. We introduce a set of metrics used for evaluating the performance of the scheduling strategies presented in this work. In Chapter5we present a set of on-line scheduling strategies adapted to our research environment considering now a more flexible approach for the management of the charging process of the vehicles. Followed by Chapter6, where we present our original scheduling strategy oriented towards theQoSproposed to the user. Finally, Chapter7concludes this manuscript and provides a few perspectives in the continuation of this thesis.
1.4
Publications
This dissertation consists of an overview of the following conference publications:
1. Ruiz, M.A.; Abdallah, F.A.; Gagnaire, M.; Lascaux, Y. "TeleWatt: An Innovative Electric Vehicle Charging Infrastructure over Public Lighting Systems" Connected Vehicles and Expo
(ICCVE), 2013 IEEE International Conference on,), pp. 741,746, 2-6 Dec. 2013.
2. Alvarado-Ruiz, M.; Abi-Abdallah, F.; Gagnaire, M. "Improving Energy Distribution for EV Charging over Public Lighting Systems" IEEE International Conference on Connected
Vehicles and Expo (ICCVE), Vienna, Austria, Nov. 2014. Best Paper Award Finalist.
3. Alvarado-Ruiz, M.; Abi-Abdallah, F.; Gagnaire, M. "On-line Scheduling Policies for Electric Vehicle Charging over Public Lighting Systems". 2014 IEEE International Electric Vehicle
Conference (IEVC), Florence, Italy, Dec. 2014.
4. Alvarado-Ruiz, M.; Abi-Abdallah, F.; Gagnaire, M. "Minimum Driving Distance Warranty for EV Charging over Public Lighting Systems". 2015 IEEE International Conference on
Computer as a Tool (EUROCON), Salamanca, Spain, Sep. 2015.
A journal paper submited for publication at the IEEE Transactions on Intelligent Transporta-tion Systems and Intelligent TransportaTransporta-tion Systems Magazine ICCVE special issue.
1. Alvarado-Ruiz, M.; Abi-Abdallah, F.; Gagnaire, M. "Conservative Vs Flexible Scheduling Approaches for Charging EVs over the Public Lighting Network". IEEE Transactions on
Intelligent Transportation Systems and Intelligent Transportation Systems Magazine. Jul.
Part I
Electric Vehicle Charging
Infrastructures
Chapter
2
Electric Vehicles and Charging
Infrastructures
Contents
1.1 Motivation, Objectives and Thesis Outline . . . . 1
1.2 Contributions of this Thesis . . . . 5
1.3 Thesis Outline . . . . 6
10 2.1. Introduction
2.1
Introduction
This chapter presents a brief introduction to the different types of electric vehicles and their principal components. We provide a brief state of the art of the batteries used in automotive applications and the standards developed in recent years for the EV supply equipment. Such standards have particularly addressed the plugs and connectors linking an electrical vehicle to a charging station, as well as the charging modes. An essential element of this thesis is the
PLS electrical network. Thus, not only this particular grid is presented, but the electricity and e-Mobility markets as well.
2.2
Electric Vehicles
Electric vehicles have been investigated by the automotive industry as soon as the years 1830s when it was first developed [64]. Despite the improvements done in their battery technology and low maintenance costs between 1910 and 1925 [43], Internal Combustion Engine Vehicles (ICEVs) took a significant market advantage thanks to the improvement achieved in terms of driving range and maximum speed.
A renewed interest in developingEVs between the years 1960s and the years 1970s has aimed to reduce the dependence on fossil fuels due to the rising oil prices. In this context, EV mass production really started in the late 1990s and more successfully throughout the years 2000s. It was is in the 1990s that the firstEVwas launched in the US by General Motors known as the GM EV 1 [56]. It was followed by other automakers with more successful models, like the Nissan Leaf [6] or the Tesla Model S. The EV industry has started to emerge once again, favored by different economic and environmental factors, such as international policies aiming at the reduction of CO2
emissions [73]. In parallel, renewable resources have emerged and enabled a reduction of fossil fuel’s dependence.
There are four major components in the architecture or an EV, the drive train system, the battery pack, the charger and the charging inlet. In the following section we will briefly describe each one of these components.
2.2.1
Electric Vehicle Drive System Architectures
The drive train system is the group of components that couple the energy source to the driving wheels which transform it into mechanical power. The basic drive train system of an EVis com-posed by a battery connected to a motor driver in series with an Electric Motor (EM), a mechanical coupling and the transmission system. There are two main electric vehicle architectures according to the adopted drive train system: Battery Electric Vehicles (BEV) or hereby simply referred as Electric Vehicles (EV) and Hybrid Electric Vehicles (HEV). EVs are exclusively powered with electricity, while Hybrid Electric Vehicless (HEVs) combine the traditional Internal Combustion Engine (ICE) and the advantages of anEM. Vehicles that cannot be plugged externally to charge their batteries are simply referred asHEVs. An HEV can only be charged by means of its engine and its regenerative breaking system. On the other hand, when they can additionally charge their batteries from the grid they are referred as PHEVs [61]. When the first PHEVs appeared, the
Chapter 2. Electric Vehicles and Charging Infrastructures 11
addition of anEMto theICEwas only conceived to help theICEto propel the vehicle. Reducing the fuel consumption was considered as a second order service. However, in recent years the roles have changed and it is now theICEthat is considered as an auxiliary motor of theEM. Its main purpose is to improve the performance of the vehicle, by increasing its driving range and supplying sufficient torque when it is required.
While theEV drive system is realized only by a motor driver and anEM,HEVs have at least two traction sources, both mechanical and electrical. This dual traction source enables the usage of smaller engines. Additionally,HEVs have at least two power sources, where one of them must be electric. Depending on the combination of the electric and mechanical traction that constitute the drive system of the vehicle and the interconnection of its components, HEVs can be divided into three configurations described in Figure2.1[43,76].
• Series:
The electric traction system and theICEoperate in a series connection. TheICEgenerates the electric power for recharging the battery when it is coupled with a generator, then the battery supplies energy to an electric motor drive that transfers power to wheels.
• Parallel:
As its name indicates, the electric motor operates in parallel with theICE. In this configu-ration theICEsupports the electric traction when higher power is needed on the wheels. A relatively smaller battery capacity is required compared to the series configuration, resulting in a lighter mass of the drive train.
• Parallel-series combined hybrid:
This configuration requires an additional mechanical unit placed between the electric motor and the generator. This allows the vehicle to operate in both, series or parallel configuration, which helps to run the vehicle in an optimal way by using only the EVor theICE and the
EMtogether depending on the driving conditions.
2.2.2
Batteries for Electric Vehicles
In recent years the commercialization ofEVs has been subjected by two central issues. The first one is the limited range of the vehicle, that is related to the high cost of the batteries. The second one is more associated to the refueling process, which is not yet as easy and fast as theICEV. The charging process for an empty battery could potentially take a long time, added to the scarcity of available charging points. Regarding the range of the vehicles, the research on high voltage batteries used in automotive applications have focused in the last years on increasing the energy density of the batteries. At the same time, reducing the cost of the battery pack and improving the charging process has remain a constant target. In spite of these efforts, the achievable range ofEVs has remained limited around 200 kilometers.
The performance of a battery is highly influenced by different factors, such as the state of charge (SoC), the "state of health" of the battery related to its aging, the temperature of the battery, the environment as well as the load profile and the adopted charging algorithm. The price of the battery packs used on EVs and PHEVs is relatively high compared to the price of the whole car. It depends on the number of cells connected within the battery itself, the nature of the electrolyte and the necessary protection circuits. It must be noticed that depending on the
12 2.2. Electric Vehicles
Chapter 2. Electric Vehicles and Charging Infrastructures 13
user habits and the implemented charging algorithm, the life cycle of a battery can be affected, and as a consequence, the cost of the battery pack too. Longer life cycles of the battery pack will are more cost-effective. In the following section we briefly describe the terms and components of the batteries used in automotive applications.
Basic Terms for Battery Performance
In this section, we briefly present the terminology used for describing the different components and stages of a battery.
• Cell, Module and Pack:
A pack of batteries is a group of modules placed in a single container for better thermal management. Each module is a cluster of cells, which are at the same time independent batteries, with two current leads and separate compartment holding electrodes. AnEVcan have one or more battery packs placed at different locations in the vehicle.
• Energy Density or Specific Energy:
It is the amount of available energy from a fully charged battery per unit. When it is based on volume, the term energy density is used and expressed in Wh/L. It is referred as specific energy when the available energy is expressed in terms of weight, as Wh/kg, which is a more suitable factor than volume forEVs andPHEV.
• C-Rate :
C-Rate represents the amount of current used for charging the battery and it represents the charge rate equal to the capacity of the battery in one hour. So, for a 10 Ah battery, C corresponds to the charge or discharge of a battery at 10 A for one hour. This term should not be confused with the charge rate of the EV.
• Charge Rate:
It is the power that is constantly delivered by the charger to the battery. It sometimes can be referred as charging capacity. The charging capacity is determined by the type of charging connector and the available power at the charger. The effective charge rate provided to the battery depends on the link between the EV and the charging point with the lowest resistance. This means that if the battery pack demands a higher power to the charger than the actual available power or the maximum rate supported by the connector, the link with the lowest resistance is the one that will define the charge rate of the connection.
• State of Charge (SoC):
It is a term which refers to the percentage of remaining energy available in the battery [68]. The estimation of theSoCof a battery at instant t is given by Equation2.1.
SoC(t) =c(t)
C × 100 (2.1)
where C represents the rated capacity of the battery and c the remaining capacity on the battery.
14 2.2. Electric Vehicles
It indicates the percentage of the total battery capacity that has been discharged as presented in Equation2.2.
DoD = 1 −SoC (2.2)
• State of Health (SoH):
It is usually used as a parameter to indicate the degree of performance of a battery in order to estimate its remaining life duration. TheSoHvalue refers to the maximum charge capacity of an aged battery compared to the maximum charge capacity when the battery was brand new.
SoH = ECa
ECn
(2.3) where ECnrepresents the rated energy capacity and ECais the energy capacity of the aged
battery.
• Battery Life Cycle:
It is a parameter that defines the operating life of the battery. It is formally referred as the number of discharge-charge cycles that the battery is capable to handle at a specific DoD
before it can no longer meet any specific performance criteria. The safety, durability and performance of batteries are highly dependent on the way they are charged. This includes, the charge or discharge rates, as well as the temperature fluctuations of the battery and the charging algorithm. The life cycle of the battery becomes shorter as theDoD goes higher. In general, batteries typically suffer the loss of nearly 20% of their initial capacity after about 100 to 2000 full cycles. Fully charging or discharging the battery can accelerate the degradation of its life cycle. By reducing theSoC, complete discharges and overcharges of the battery pack are avoided since both of these operations drastically reduces the battery lifetime.
Chemical Process Inside a Battery
There are different chemistries proposed as the energy source to power EVs in the last years. Batteries are composed by a positive electrode with a higher potential and a negative electrode with an ion conductive electrolyte with a lower potential. During charging, the negative electrode is the cathode where the oxidation reaction occurs. The reduction reaction occurs at the positive electrode (the anode). There is a separator which serves as a reservoir for extra electrolyte that helps to prevent shortage due to the formation of residues, such as Li-dentrite in Li-ion batteries. In recent years, various battery chemistries have been proposed as the energy source to power electrical vehicles, each one with its own advantages and disadvantages.
• Nickel Cadmium (Ni-Cd):
This kind of batteries benefit from a mature technology, however its specific energy is quite low for vehicle applications. They are typically used when long life at reasonable cost is required, however its chemical composition implies some environmental concerns due to the toxic metals it contains.
• Nickel-Metal Hydride (NiMH:)
Chapter 2. Electric Vehicles and Charging Infrastructures 15
reduced cycle life. Its specific energy is in the range of 75-100 Wh/kg that makes it suitable forEV andPHEVapplications.
• Lithium-Ion (Li-Ion)
Li-Ion batteries have an exceptional performance for EVs and PHEVs thanks to its high specific energy (100-140 kWh/kg). A Li-Ion battery of 20 kWh weighs about 160 kg, which is lighter than the Ni-MH batteries which weigh between 275 and 300 kg for the same application. This type of battery has a great potential for technological improvements and the absence of memory effect, which noticeably helps to extend the life cycle of the batteries when they are managed in proper conditions. Compared to Ni-Cd batteries, Li-Ion batteries are composed of environmental friendly materials. However its weak point is its safety, as over charging the battery could potentially cause explosions by overheating the battery pack. This issue has been handled by Lithium Iron Phosphate batteries (LiF eP O4), which have
managed to reduce the flammability risk. It must be noted, that Li-Ion batteries do not need to be fully charged to properly operate, and it is actually avoided as high voltages could stress the battery. Another important drawback for this type of batteries is the cost which is still high. Finally, the cycle life of a Li-Ion battery is between 4000 and 7000 cycles. • Lithium Polymer (Li-Po)
These solid state type batteries have the same energy density as the Li-ion batteries but at a lower cost. Li-Po batteries could eliminate the need of ultra-capacitors in the future, due to their outstanding performance in charging time and the flexibility of their design. Batteries of that type can reach over 90% of this capacity in only a couple of minutes. As Li-Ion batteries, the materials within the battery do not leak out even in the case of an accident.
Battery Model
Modeling the behavior of a battery is necessary to estimate itsSoCand its SoH. The knowledge of theSoCand of theSoHis necessary for modeling its Battery Management System (BMS). that can itself be used to optimize the battery’s efficiency. Several battery models are mentioned in the literature [33,43,64,76]. Depending on the environment of its utilization, a given model can be more or less efficient. The availabilty of reliable simulation or modeling tools strongly conditions the evaluation of this efficiency. Ideally, the model of a battery should be the simplest as possible ignoring the internal parameters, the battery behavior being assimilated to a simple voltage source. More elaborated models, like the chemical one relies on a detailed analysis of the electro-chemical reactions inside the electrolyte. Such models are used in practice only during the design stage of the battery (before its commercialization). However, when the integration, optimization, control and interconnection of EVs to the grid is studied, more generic models are considered. These models provide more interesting details through the specifications and dynamics of the battery (such as the voltage, current, size and temperature) than its chemical characteristics. In this case, two variants are provided in the literature.
• A linear model that considers an ideal battery behavior with open circuit voltage Eo and
an equivalent resistance in series Rs. The open circuit voltage refers to the difference of the
electrical potential between two terminals of a battery in the absence of a connected load [40]. This model does not consider the varying characteristics of the internal impedance of the battery. It can be implemented over generic simulation environments such as Matlab.
16 2.2. Electric Vehicles
• If more details of the components are necessary, so as to generate the equivalent circuits and to test them with simulation software like PSpice, then the Thevenin model should be preferred. This model, in its most basic form uses a resistor and an RC parallel network in series. It assumes that the open circuit voltage is constant and it allows to predict the battery response at a particular SoC. This model does not allow capturing steady state voltage variations or runtime information.
For modeling purposes, we have adopted in this thesis a linear model to represent the battery of a vehicle in our simulation environment.
Battery Management System (BMS)
The BMSis a multi-level control and power system composed of a combination of sensors, con-trollers and additional hardware that takes care of all or some of the aspects affecting batteries. Such control is possible thanks to different software algorithms designed to control the charging process of the battery. To do so, theBMSestablishes the maximum charge or discharge currents, estimates theSoCand theSoHof the battery pack so as to keep track of its progress and if needed, regulates the temperature of the battery to improve its charging process. The charging process of anEVis mainly determined by the properties of its battery pack. As previously stated, Li-Ion batteries are more commonly used. There are three charging methods that can be used on this type of batteries which are described next.
• Constant Voltage (CV):
This method is suitable for all kind of batteries and it is the simplest charging scheme available. For this method, the battery is charged at a constant voltage, while the charging current of the battery varies through the charging process. The current intensity can be high during the initial stage when the battery begins to charge. This intensity decreases to zero until the battery is fully charged. Constant Voltage is not available for most residential and parking infrastructures, as it requires very high power in the early stage of charging. Such voltages could induce operational risks.
• Constant Current (CC):
This method controls the charging voltage applied to the battery so as to maintain a constant current. This induces a linear increase of the SoC of the battery. In this case, it is a combination of parameters such as an increment on the temperature, or of the voltage, or simply after a defined period of time that theBMSdetermines that a charge is completed.
• Constant Current - Constant voltage (CC-CV)
This is a combination of the two methods previously described and it is the most widely used method for charging Li-ion batteries [32,50]. Three steps are identified during a charging process as it is illustrated in Figure2.2. During the first step, the battery is pre-charged at a low constant current, normally around 0.1 C rate units. At the second step, the charging current is maintained constant until a certain threshold is reached by theSoC, this normally happens when the voltage of the cell reaches the battery terminal voltage VBAT, which is
typically 4.2V. At this point, the third step begins, the voltage being kept constant (CV), until the current exponentially decays and reaches typically one-tenth of the fast charge current IEN D. Approximately 70% of the total charge is delivered during the CC step and
![Figure 2.3 – AC and DC power plugs available. Figure taken from [ 28 ].](https://thumb-eu.123doks.com/thumbv2/123doknet/2616927.58218/40.892.285.654.119.477/figure-ac-dc-power-plugs-available-figure-taken.webp)