HAL Id: tel-01970957
https://pastel.archives-ouvertes.fr/tel-01970957
Submitted on 6 Jan 2019HAL is a multi-disciplinary open access archive for the deposit and dissemination of sci-entific research documents, whether they are pub-lished or not. The documents may come from teaching and research institutions in France or abroad, or from public or private research centers.
L’archive ouverte pluridisciplinaire HAL, est destinée au dépôt et à la diffusion de documents scientifiques de niveau recherche, publiés ou non, émanant des établissements d’enseignement et de recherche français ou étrangers, des laboratoires publics ou privés.
of liquefaction of sands
Layal Jradi
To cite this version:
Layal Jradi. Study of the influence of fine particles on the properties of liquefaction of sands. Materials. Université Paris-Est, 2018. English. �NNT : 2018PESC1053�. �tel-01970957�
Dissertation presented for the degree of
Doctor from Université Paris–Est
Field: Geotechnical Engineering
by
Layal JRADI
Doctoral School: Sciences, Ingénierie et Environnement (SIE)
Study of the influence of fine particles on the properties of
liquefaction of sands
Draft Thesis
JURY
M. Pierre BREUL Referee Université de Clermont Auvergne M. Daniel LEVACHER Referee Université de Caen
M. Pierre-Yves HICHER Examiner Ecole Centrale de Nantes M. Jean CANOU Examiner Ecole des Ponts ParisTech M. Bassel SEIF EL DINE Examiner Lebanese University M. Jean-Claude DUPLA PhD Supervisor Ecole des Ponts ParisTech
Abstract
Since the last 50 years, the study of the phenomenon of liquefaction of saturated sandy soils has been a topic of extensive laboratory research. Most of the earlier research has focused on the liquefaction of clean sands assuming that the presence of fines resists the development of excess pore water pressure as well as the risk of liquefaction. However , natural sand is found in nature under the form of a mixture of sand and fines and, the influence of these fines on the liquefaction risk of this type of material is still unclear. In fact, we could find contradictory results in the literature review of the effect of fine particles on the sand liquefaction phenomenon.
In this context, the main objective of this study is to clarify and quantify the influence of fine particles (plastic and non-plastic) present in a sandy matrix on the initiation and development of the liquefaction phenomenon .We’ve focused, in particular, on the nature of fine particles (plastic/non-plastic), their proportion in the matrix, the matrix compactness condition and initial stress state (state consolidation). For this purpose, with the aid of a new triaxial servo-hydraulic device, a series of monotonic and cyclic tests were done in order to clarify this effect. Experimental results show that the increase in non-plastic fines increases the resistance to liquefaction of the mixture under both monotonic and cyclic loading. However, this trend is reversed for the mixtures containing plastic fines. Finally a comparison has been established between the behavior of these soils under undrained monotonic and cyclic shearing in terms of evaluation of the initiation of instability phenomenon and other mechanical parameters.
Résumé
Au cours des 50 dernières années, l’étude du phénomène de liquéfaction de sols sableux saturés a fait l'objet de nombreuses recherches en laboratoire. La plupart de ces recherches antérieures se sont concentrées sur la liquéfaction de sables propres, en supposant que la présence de fines limite le développement de la surpression interstitielle et donc le risque de liquéfaction. Cependant, les sables naturels se trouvent généralement dans la nature sous la forme d'un mélange de sable et de fines et l’influence de ces fines sur le risque de liquéfaction de ce type de matériau n'est toujours pas claire. En effet, on trouve des résultats contradictoires, dans la littérature, sur l'effet des particules fines sur le phénomène de liquéfaction des sables.
Dans ce contexte, l’objectif principal de ce travail expérimental est de clarifier et de quantifier l’influence des particules fines présentes au sein d’une matrice sableuse sur l’initiation et le développement du phénomène de liquéfaction. On s’est intéressé, en particulier, à la nature des particules fines (plastique/non-plastique), à leur proportion au sein de la matrice, à l’état de compacité de la matrice et à l’état de contrainte initial (état de consolidation). A cet effet, à l'aide d'un nouveau dispositif triaxial servo-hydraulique, une série d'essais monotones et cycliques ont été effectués afin de clarifier cet effet. Les résultats expérimentaux montrent que l'augmentation de la proportion de fines non plastiques augmente la résistance à la liquéfaction du mélange sous chargements monotone et cyclique. Par contre, cette tendance est inversée pour les mélanges qui contiennent des fines plastiques. Enfin, une comparais on a été établie entre le comportement de ces sols sous cisaillement monotone et cyclique non drainé en termes d'évaluation du déclenchement du phénomène d'instabilité et d'autres paramètres mécaniques.
NOTATIONS
e Void ratio -
eg Intergranular void ratio -
eeq Equivalent void ratio -
ef Interfine void ratio -
ID Density index -
IDmat Density index of sand matrix -
Dr Relative density -
Drs Specific relative density -
Ѱ State parameter -
Ѱ0 Initial state parameter -
Q Deviator stress kPa
qinst Deviator stress at initiation of instability kPa
p’ Mean effective stress kPa
Η Stress ratio -
ηinst Stress ratio at initiation of instability -
Φ Friction angle °
φinst Instability friction angle °
Φmax Maximum friction angle °
Φcar Characteristic friction angle °
Fc Fines content %
Fcth Threshold fines content %
fcth Fcth/100 -
Δu Excess pore water pressure kPa
εa Axial deformation %
εv Volumetric deformation %
emax Maximum void ratio -
emin Minimum void ratio -
Cu Coefficient of uniformity -
Cc Coefficient of curvature -
ρs Density g/cm3
b Ratio of active fines -
Vv Volume of voids -
Table of content
General introduction ... 1
1 Chapter I: Literature review ... 4
1.1 History of liquefaction ... 4
1.2 General overview on the mechanical behavior of sands ... 6
1.2.1 Terminology and definitions ... 6
1.2.2 Localized and Diffused Instabilities ... 10
1.3 Identification of liquefaction phenomenon in the laboratory ... 11
1.3.1 General overview on the behavior of sand under undrained triaxial test ... 11
1.3.2 Chinese criteria for the identification of liquefaction... 13
1.3.3 Initiation of Instability ... 15
1.4 Specimen preparation methods and their effects on soil behavior ... 17
1.4.1 Overview of specimen preparation methods for sandy soils ... 17
1.4.2 Effect of reconstitution methods on the mechanical behavior of material ... 23
1.4.3 Effect of reconstitution method on the material structure ... 25
1.5 Influence of fines on the behavior of silty sands ... 26
1.5.1 Definitions and influence of different parameters ... 27
1.5.2 Influence of the non-plastic fines content on the initiation of instability ... 33
1.5.3 Influence of the non-plastic fines content on the critical state ... 47
1.5.4 Influence of plastic fines ... 51
1.6 Conclusions on literature review ... 53
2 Chapter II: Materials, experimental protocols and testing setup ... 54
2.1 Characterization of the materials studied... 54
2.2 Fontainebleau sand ... 54
2.2.1 Silica C500 ... 55
2.3 Triaxial testing ... 57
2.3.1 Triaxial device Φ 100 mm ... 58
2.3.2 Calibration of the cell ... 61
2.4 Homogeneity of mixtures ... 69
2.4.1 Laser granulometry... 69
2.4.2 Particle size distribution of mixtures ... 70
2.5 Experimental procedure ... 80 2.5.1 Preparation of specimens... 80 2.5.2 System preparation ... 81 2.5.3 Saturation... 87 2.5.4 Consolidation... 88 2.5.5 Shearing ... 89
2.5.6 Measurements and acquisition of data ... 89
2.6 Conclusion ... 89
3 Chapter III: Undrained behavior of sand containing fines under monotonic shear ... 90
3.1 Experimental program ... 90 3.2 Typical results ... 92 3.2.1 Clean sand ... 92 3.2.2 Sand-C500 mixture... 92 3.2.3 Sand-Speswhite mixture ... 95 3.3 Repeatability ... 95
3.4 Influence of the density index of sand matrix IDmat ... 98
3.4.1 Sand and non- plastic fines... 98
3.4.2 Sand and plastic fines ... 100
3.5 Influence of the consolidation stress... 104
3.5.2 Sand and plastic fines ... 105
3.6 Influence of fines content ... 109
3.6.1 Sand and non-plastic fines... 109
3.6.2 Sand and plastic fines ... 110
3.6.3 Synthesis of results ... 112
3.7 Influence of type of fines ... 117
3.8 Evaluation of different mechanical parameters ... 120
3.8.1 Maximum friction angle Φ’ma x ... 120
3.8.2 Characteristic angle Φ’car... 122
3.9 Analysis of the conditions of initiation of instability ... 123
3.10 Interpretation and discussion of results ... 129
3.11 Evaluation of the liquefaction resistance in terms of other parameters ... 131
3.11.1 Evaluation in terms of intergranular void ratio ... 131
3.11.2 Evaluation in terms of equivalent void ratio ... 134
3.11.3 Estimation of critical fines content based on Westman and Hugill diagram ... 134
4 Chapter IV: Undrained behavior of sand containing fines under cyclic shear ... 139
4.1 Experimental program ... 139
4.2 Typical results ... 141
4.2.1 Clean sand ... 141
4.2.2 Sand-fines mixtures ... 149
4.3 Repeatability test... 155
4.4 Influence of significant parameters on the behavior of sand-fines mixtures under cyclic loading ... 159
4.4.1 Matrix density index... 159
4.4.2 Influence of cyclic stress ratio ... 161
4.5 Cyclic shear resistance curves ... 167
4.5.1 Case of loose states... 168
4.5.2 Case of dense states ... 170
4.6 Proposition of a model for predicting the cyclic shear resistance curve based on the fines content ... 176
4.7 Synthesis of behaviors observed under undrained monotonic and cyclic loading (Comparison between monotonic and cyclic behaviors of mixtures) ... 181
4.7.1 Total liquefaction phenomena (case of loose materials) ... 181
4.7.2 Cyclic mobility phenomenon (case of dilating mixtures) ... 188
General conclusions and perspectives ... 192
References ... 194
List of figures ... 202
1
General introduction
The geotechnical literature describes a very large amount of damages associated with particular and often spectacular ground failures, in which the soil appears to suddenly loose a large part of its shear strength and temporarily flows in a liquid-like manner until re-stabilization of the material in a configuration very different from the initial configuration. These soil failures correspond to a phenomenon known by the generic name of "liquefaction" and are generally observed in the case of saturated sands subjected to rapid, monotonous or cyclic stresses, such as earthquakes, tidal waves, shocks or explosions...
Since the earthquakes of Niigata in Japan and Alaska in the United States in 1964, important research has been initiated and developed on the study of liquefaction phenomena in an attempt to evaluate the susceptibility to liquefaction of saturated sandy sites subjected to earthquakes. Indeed, this subject has been the object of extensive experimental research where most of the earlier research has focused on the liquefaction of clean sands assuming that the presence of fines resists the development of excess pore water pressure as well as the risk of liquefaction. However, as natural sand is frequently found in nature under the for m of a mixture of sand and fine particles and based on case histories of actual soils behavior during earthquakes, it has been reported that sands containing fines have shown to liquefy Chang (1982), Koester (1994)… therefore, the presence of silt and clay will in some manner affect the resistance of sand to liquefaction. Unfortunately the influence of these fines on the liquefaction risk of this type of material is still unclear. In fact, we could find contradictory results in the literature review concerning the effect of fine particles on the liquefaction properties of sands.
Researchers have studied the effect of fines on the liquefaction resistance of sands for high values of fines content ranging between 10% and 100%. It is interesting to note that, based on field studies following major earthquakes and the case histories of actual soil behavior during earthquakes, there are some evidence that soils with greater fines content are less likely to liquefy. Okashi (1970) has realized during the 1964 Niigata earthquake that soils with fines content less than 10% are more likely to liquefy. Also, Tokimatsu and Yoshimi (1983) declared in a study of 17 worldwide earthquakes that 50% of liquefied soils had fines content less than 5%. Therefore, it would be very interesting to test soils behavior at very low fines content (below 5%).
2 In this context, the main objective of this thesis is to clarify and quantify the influence of fine particles (less than 5%) present in a sandy matrix on the initiation and development of the liquefaction phenomenon in order to improve the knowledge of these specific unstable behaviors that are very sensitive to the influence of several parameters and eventually to contribute to the improvement of the methods of evaluation of liquefaction risk of sands containing fines under rapid monotonic and cyclic loading. In order to achieve this objective, an experimental approach has been adopted, with the aid of a new servo-hydraulic triaxial setup we have focused on the study of the influence of the nature of fine particles (plastic/non-plastic), their proportion in the matrix, the matrix compactness condition and initial stress state (state consolidation).
First of all, the behavior under undrained monotonic loading of a reference sand (Fontainebleau sand) and mixtures of Fontainebleau sand and two types of fines (plastic and non-plastic) has been studied. In particular, monotonic loadings have been used for the initiation of instabilities as well as for the ultimate states reached in large deformation, by highlighting the influence of various significant parameters on observed behaviors, in particular the influence of fines content. Then, based on this "framework" of monotonic behavior, we have studied the response of these materials under cyclic shear , trying, as far as possible, to highlight the analogies existing between monotonic and cyclic behavior.
This thesis is composed of four chapters, briefly described as follows:
The first chapter presents a review of the literature on liquefaction phenomenon, in particular the influence of fine particles on the mechanical response of sands. This review has revealed that the presence of fines will in some matter affect the resistance of sand to liquefaction, however, the published studies show no clear conclusion as to in what manner the presence of these fines affect the sands resistance. This is particularly true for the soils containing non-plastic fines. This overview of the literature has helped us to set our objectives and consequently to choose the parameters of our work. Indeed, as we have seen in the literature of this subject that the actual soils that have liquefied during the earthquakes throughout the history contained less than 5% fines, we focused in our study on clarifying the influence of low contents of fine particles (Fc ≤ 5%).
The second chapter presents the materials used for this study, as well as the experimental device (Triaxial testing) and the experimental protocol used in our study. In fact, based on the
3 conclusions of the literature review, we have traced our study path and set up our objectives. Therefore, an experimental program has been defined, allowing to focus, in particular, on the nature of fine particles (plastic/non-plastic), their proportion in the matrix, the matrix compactness condition and initial stress state (state consolidation).
The third chapter presents and analyzes the behaviors of sand containing fines observed in the triaxial apparatus under undrained monotonic loading with emphasis on the conditions of the initiation of liquefaction instability. This chapter also presents the influence of fundamental parameters on the mechanical response of sand-fines mixtures.
The fourth chapter presents the results of the undrained cyclic shearing and also focuses on the conditions of initiation of instability. According to the results presented in the two previous chapters, a synthesis of the undrained behaviors under monotonic and cyclic loading is presented emphasizing the analogies between these two types of solicitations.
4
1 Chapter I: Literature review
1.1 History of liquefaction
Derived from the Latin verb “liquefacere” which means to dissolve or to weaken, liquefaction is the term used in order to describe the phenomenon of liquefaction that occurs when the shear resistance of soils decreases in response to a monotonic (rapid sediment accumulation, erosion at the toe of a slope...), dynamic (blast, vibration) or cyclic (earthquake, tidal waves) loading at constant volume.
Liquefaction of soils is a phenomenon whereby a saturated or partially saturated soil loses its strength in response to an applied shear stress, usually an earthquake causing it to behave like a liquid.
The phenomenon of liquefaction of sands due to earthquakes has been recorded throughout the history. However it wasn’t studied by scientists until the early 1960’s. The study on liquefaction of sands started greatly after the Niigata earthquake and the Alaska earthquake of 1964 which caused dramatic damages due to liquefaction. During the Niigata earthquake in Japan 1964, the damages caused by liquefaction were very important (Seed et al., 1967). Approximately 310 buildings constructed of reinforced concrete were damaged, of which 200 were tilted. It should be noted that the soil on which the city rests consists of recent sedimentary deposits, of low relative density, with a shallow water table. Damaged buildings were built on shallow foundations or piles and on a very loose soil layers.
The Alaskan earthquake in 1964 with a magnitude of 8.6, presented huge landslides that took away 9.6 million m3 of soil where the surface of the ground was completely devastated by displacements.
Liquefaction was also a major factor in the destruction in San Francisco's Marina District during the 1989 Loma Prieta earthquake, and in Port of Kobe during the 1995 Great Hanshin earthquake.
More recently liquefaction was largely responsible for extensive damage to residential properties of Christchurch, New Zealand during the 2010 Canterbury earthquake and more
5 extensively again following the Christchurch earthquakes that followed in early and mid-2011. Road surfaces were forced up by liquefaction, and water and sand flood out of cracks. Moreover, in 2014 in Cephalonia Greece this phenomenon was detected due to an earthquake causing severe damages and road failures. Examples of the consequences of this phenomenon are presented below in figure 1.1.
(a) Niigata, Japan, 1964 (b) Alaska, 1964
(c) San Fransisco, 1989 (d) Port of Kobe, 1995
(e) Christchurch, NewZealand, 2010 (f) Cephalonia, Greece, 2014
6
1.2 General overview on the mechanical behavior of sands
1.2.1 Terminology and definitions1.2.1.1 Drained and undrained behavior
The drained behavior corresponds to the case where the pore water can drain out of the soil easily under loading causing no change in pore water pressure (Δu = 0). Therefore, both total and effective stresses in this case are similar due to the fact that the pore water pressure remains equal to a constant value u0 (hydrostatic pressure), however it must be noted that for
drained conditions the drainage of water allows the occurrence of volumetric strains in the soil.
On the other hand, the undrained behavior presents the opposite case where pore water is unable to drain out of the soil. In the undrained condition, the rate of loading is faster than the rate at which the pore water is able to drain out of the soil. As a result, this external loading is taken by the pore water in which it leads to an increase in the pore water pressure (u =u0 + Δu).
In this case, the definition of effective stresses is introduced where the values of these stresses are much different than those of the total stresses. During undrained loading, the tendency of soil to change volume is maintained, which results in the development of excess pore water pressures
1.2.1.2 Characteristic state
The characteristic state concept has been formulated by Habib and Luong (1978) in order to translate the passage of the volumetric deformations from the contractancy phase to the dilatancy phase. This threshold is characterized by a characteristic friction angle Φ’car which
characterizes the entanglement capacity of the material. It is defined by the stress level corresponding to a zero irreversible volume deformation rate:
= 0 at η = ηcar (1.2)
The characteristic angle of friction is an intrinsic parameter of the material since it is independent from its density state, the particles size and the followed stress path. The characteristic state thus separates in the (q, p’) plane the domain of the admissible stresses in
7 the material in two zones corresponding to two types of volumetric behaviors of the soil (figure 1.2).
- a sub-characteristic domain (η <ηcar) delimited by the characteristic lines LC where the material is contracting.
- an over characteristic domain (η> ηcar) beyond the LC line and up to the limit of LR failure where the material is dilating.
This can be translated by the following relations > 0 for η <ηcar
< 0 for η > ηcar
Under undrained conditions, the contractancy and dilatancy mechanism results in a positive or negative excess pore water pressure (EPWP) generation rate. By analogy, the characteristic threshold must, in this case, correspond to the level of stress at which the reversal of EPWP generation direction.
Figure 1.2 - Characteristic state (Luong 1980) (a): monotonic behavior; (b) cyclic behavior
1.2.1.3 Critical state
Casagrande (1936) conducted the first experimental researches in order to understand the mechanism of volumetric variations and carried out a series of tests on sand using the direct
8 shear box. Based on the results obtained, he hypothesized that upon shearing a loose sample of sand, it contracts and its volume decreases and approaches a steady state of volume. On the other hand, if the sand is initially dense, its volume grows and tries to reach a stable state in the same way as the loose sand.
At this ultimate state, the value of the void ratio reached is practically identical and constant in both cases, while the material continues to deform at constant volume and shear stress (figure 1.3).
Casagrande has thus developed the concept of the critical void ratio. After that, he has shown that the critical density or critical void ratio varies as a function of the normal stress, and decreases with the increase of the latter. Consequently, this makes it possible to represent the critical points in the plane (e, log p ') and to draw the critical state line.
A material whose initial state is located above this line will witness a decrease in its void ratio when subjected to shear stress. As well if it is located below, its void ratio will decrease. The critical state line thus delimits the contracting domain from the dilatant one. Note that the first case is the most critical with respect to liquefaction because the effective stress decreases while in the other case it increases.
9
Figure 1.3 - Concept of critical void ratio (Casagrande, 1975)
1.2.1.4 Stability and instability definitions
Granular soils may become unstable even before the stress state reaches failure, this has been observed by Lade (1992) for loose fine sand under undrained conditions, and by Chu et al. (1993) for medium loose to dense sand under strain path controlled conditions and by Leong
et al. (2000) for loose granular fill materials under load controlled undrained condition.
There exists several different definitions for the stability and instability states in the literature review. Lade et al. (1988) defined the instability as the inability of the material to sustain or carry a given load including small perturbations of this load. Chu et al. (2012) defined the instability as the behavior in which large plastic strains are generated rapidly because of the inability of a soil element to sustain a given load (or stress) or a combination of loads and displacements. Gajo et al. (2000) considered that the instability is the state where a small increment in some variables leads to a sudden large increment in other quantities.
The sign of the second order work on the basis of the load condition of stability defined by Hill (1958) is often used to study the stability of granular materials (Darve et Laouafa 2000;
10 Darve et al. 2004; Nicot et al. 2007; Daouadji et al. 2010; Nicot et Wan 2010; Sawicki et Swidzinski 2010). According to Hill’s stability postulate, a material is stable if the second-order work is strictly positive
d2W = dơ’dƐ > 0 (1.3)
Darve et Laouafa (2000) adopted the definition of stability proposed by Lyapunov (1907) for which the field of applicability is larger than the mechanics of continuum media. He states that: “ for a given rate independent material, a stress-strain state (ơ,Ɛ) for a given strain history is called stable if any “small” change of any admissible loading dl leads to a “small” change of the response dr.
1.2.2 Localized and Diffused Instabilities
It is now recognized that some collapses and instabilities can occur before the Mohr-Coulomb plastic limit criterion is reached. One of these instabilities is the “localized instability”. Many experimental studies have been devoted to the analysis of localized failure with she ar band formation. It is well recognized that this failure mode appears in the hardening regime of soil deformation, before reaching the Mohr-Coulomb plastic limit condition (Rice 1976). This instability mode is characterized by the localization of plastic deformation under the form of one or several shear bands. Strain localization has been studied experimentally (Desrues and Viggiani, 2004), theoretically (Bardet, 1990), and numerically (Andrade and Borja, 2006). The widely used theoretical framework for the prediction of strain localization is the localization criterion of Rudnicki and Rice (1975) which corresponds to the vanishing determinant value of the acoustic tensor det (Ajk)=0.
However, since Castro (1969), other experimental research has repeatedly shown collapses strictly inside Mohr-Coulomb surface (Sladen et al. 1985, Vaid et Chern 1985, Canou, 1989). Such undrained triaxial compressions tests on loose sands are axially force-controlled and the collapse occurs at q peak (q=ơ1 – ơ3) (Lade et al. 1988). Moreover, it appears that this failure mode is very sudden, with an instantaneous transition from a quasi-static deformation mode to a dynamic one and thus corresponds to a bifurcation of the response of the specimen. A chaotic displacement field without any localization pattern is described (Khoa et al. 2006; Darve et al. 2007). In order to distinguish this failure mode from the localized one, Darve et al. 2004 has called it “diffuse failure”. This type of instability can cause destruction of structures on ground surface as witnessed in San-Fernando in 1971 (see figure 1.4). During the undrained compression tests, diffuse instability can be predicted by Hill’s stability postulate.
11 According to Hill (1958)’s second-order work theory, the necessary condition for the undrained diffuse instability is d2W = dơ
ijdƐij < 0.
Figure 1.4 - Diffuse rupture of San Fernando dam, United States 1971
1.3 Identification of liquefaction phenomenon in the laboratory
1.3.1 General overview on the behavior of sand under undrained triaxial testCastro 1969 performed a series of undrained triaxial tests where he distinguished three different behaviors of three sand samples having three different density indexes and tested under the same confining pressure.
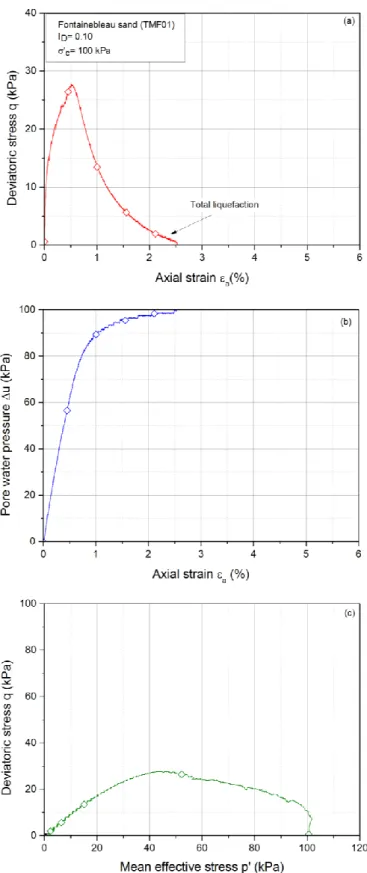
1.3.1.1 Liquefaction behavior
In this case, the deviatoric stress curve is characterized by a peak resistance corresponding to a relatively small axial deformation (Ɛa = 1%), followed by a sudden and sharp reduction in the resistance until reaching a residual state called stable state of deformation. The corresponding stress path reveals a peak that migrates left towards the origin until reaching the steady state point. This type of behavior resembles that observed in loose saturated sands that tend to develop a very important pore water pressure. The significant loss of shear strength and the development of large deformations present the characteristics of rupture by liquefaction in nature (see figure 1.5, curve (a)).
12
1.3.1.2 Limited liquefaction behavior
This case presents an intermediate behavior between total liquefaction and dilatant behavio r. The deviator stress records an increase followed by a slight decrease that stabilizes at average deformations before it regains its resistance again. The pore water pressure increases to a level that remains below that of the confining pressure and then it starts to decrease slowly. The stress path migrates to the left and approaches a minimal value of shear strength before it shows a return to the right and rises along the rupture line indicating the appearance of a dilatant behavior. This behavior is typical in medium dense samples (see figure 1.5, curve (b)).
1.3.1.3 Dilatant behavior (no occurrence of liquefaction)
In this case, the shear resistance continues to increase until the end of the test whereas the pore water pressure shows a slight increase followed by an important decrease that might reach negative values. This behavior is related to the high dilatancy of the material where this behavior is usually observed in very dense samples.
Figure 1.5 (c) presents the variations in deviatoric stresses and pore water pressure as a function of the axial strain in addition to the effective stress paths for these three types of responses.
13
Figure 1.5 - Three types of responses in an undrained triaxial test accordi ng to Castro (1969)
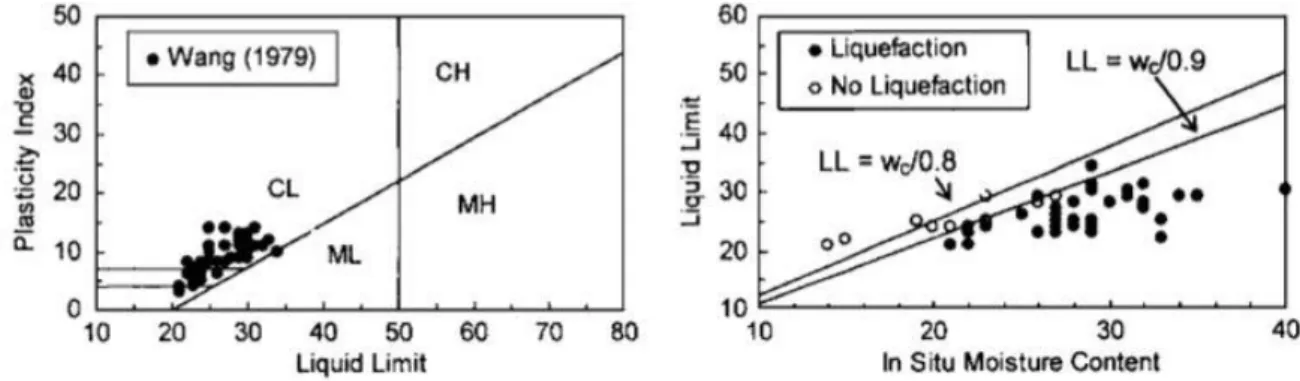
1.3.2 Chinese criteria for the identification of liquefaction
Based on data from sites where liquefaction was and wasn’t observed after earthquakes in China, Wang (1979) developed a criterion for evaluating liquefaction susceptibility of fi ne-grained soils. He noted that any clayey soil containing less than 15-20% particles by weight smaller than 0.005mm and having a Wc/LL ratio greater than 0.9 is susceptible to liquefaction (figure 1.6). Seed and Idriss (1982) observed that clayey soils that are susceptible to liquefaction have the following characteristics:
(1) Percent of particles less than 0.005mm < 15% (2) LL <35
(3) Wc/LL > 0.9
14
Figure 1.6 - Data presented by Wang (1979) which led to the development of the Chinese criteria
Koester (1992) noted that the determination of the LL by means of the fall cone used in the Chinese criteria produces values that are higher than those determined by mea ns of Casagrande.
Moreover, Andrews and Martin (2000) reduced the LL condition for liquefaction susceptibility to values less than 32. Besides, they used 0.002mm as the limit between silt-size and clay-size particles with <10% clay-particles being necessary for a silty or clayey soil to be liquefiable and they dropped the wc/LL as a condition in their liquefaction susceptibility. Boulanger and Idriss (2004) recommended laboratory testing as the best way to evaluate liquefaction susceptibility. They also recommended that the evaluation of the liquefaction potential of silts and clays must be separated into procedures applicable for “sand-like” fine-grained soils that can liquefy and for “clay-like” fine fine-grained soils that can undergo cyclic failure. The plasticity index PI can be used to discriminate between these two categories. Fine grained soils with PI<7 indicate sand-like response (susceptible to liquefaction), and soils with PI≥7 indicate clay-like response. Bray and Sancio’s (2006) observations from recent earthquakes and results of cyclic tests indicate that the Chinese criteria is not reliable for determining the liquefaction susceptibility of fine-grained soils. A good evidence is represented by soils that liquefied during 1994 Northridge, 1999 Koaeli and 1999 Chi-Chi earthquakes where they didn’t meet the clay-size criterion of the Chinese criteria. Hence, Bray and Sancio (2006) have introduced the plasticity index (PI) as an indicator of liquefaction susceptibility where they declared that loose soils with PI<12 and wc/LL>0.85 are susceptible to liquefaction, while loose soils with 12<PI<18 and wc/LL>0.8 are more resistant to liquefaction. Soils with PI>18 tested at low effective confining stresses weren’t susceptible to liquefaction. Moreover, they noticed that the results of the cyclic testing program provide
15 insights regarding the effects of confining pressure, initial static shear stress and stress -path on the liquefaction of fine grained soils.
1.3.3 Initiation of instability
1.3.3.1 Undrained potential instability zone according to Vaid and Chern (1985)
According to the studies done on two types of sands, Ottawa sand and Mine sand, Vaid and Chern (1985) have shown that there exists a critical effective stress ratio ơ’1/ơ’3 at which the instability is triggered. This ratio is shown to be independent of the initial state of the sand (before shearing) and therefore this indicated that the liquefaction is initiated at a unique value of critical effective stress ratio. For different effective stress paths, the instability initiation points are collinear and can be joined with a line passing through origin. This line is called the critical stress ratio line.
For this reason, Vaid and Chern (1985) defined a potential instability zone that is located between the critical stress ratio (CSR) line as an inferior limit and the phase transformation (PT) line defined by Ishihara et al. (1975) as a superior limit (figure 1.7). Once the stress state of sand is located in the interior of this zone, the instability is triggered. However, this zone doesn’t extend to the origin since it terminates by an approximately horizontal line “ab” whose position varies with the initial relative density of the sand.
16
1.3.3.2 Collapse surface according to Sladen et al.
Sladen et al. (1985) have presented another approach that is called “collapse surface” and it is presented in figure 1.8. They have remarked that the peak shear stresses for three samples having the same void ratio but consolidated at different confining stresses can be joined by a line that passes through the steady state point. This line has been identified as the “collapse line” figure I.8a. Sladen has also observed that at a lower void ratio (higher density) this line will have the same slope but will pass through a higher point on the steady state line in stress space. This observation of the colinearilty of peak strengths and that these lines change their positions only with the change in void ratio has introduced the concept of collapse surface in three-dimensional stress-void ratio space (figure 1.8b).
(a) Collapse line (b) collapse surface Figure 1.8 - Collapse line and surface according to Sladen (1985)
1.3.3.3 Instability line
The effective stress paths from the undrained tests on very loose compressible soil trace the yield surfaces, and determination of the top of one such yield surface is in principle, sufficient to define the instability line. The instability line connects the tops of the yield surfaces and it defines the inferior limit of the potential instability zone, Lade (1992). For very loose sands, the peak resistance is very low and therefore the instability line passes through the stress origin.
17 Lade (1993) has introduced a small modification to the concept of instability line that has been previously presented. After many investigations, he showed that the instability line passes through the origin of stress plane rather than ultimate state (see figure 1.9). Moreover, he has noticed that the slope of the instability line decreases as the relative density decreases. Furthermore, he divided the potential instability zone into three small zones: pote ntial instability, temporary instability and stable behavior as shown in the figure.
Figure 1.9 - Instability line and potential instability zone (Lade 1993)
1.4 Specimen preparation methods and their effects on soil behavior
1.4.1 Overview of specimen preparation methods for sandy soils1.4.1.1 Moist tamping (MT) method
Moist tamping (MT) is the oldest sample preparation technique, which mimics the compaction of fills (Lambe, 1951). In the MT method, dry soil is mixed with a small amount of water to facilitate the development of capillarity. The moist soil is then compacted in successive layers within a mold to form the specimen with the desired density (Lambe, 1951). Key advantages of MT method include its simplicity, the wide range of specimen densities, the self-standing nature of the specimen because of capillarity, and no segregation. The
18 accumulation and compaction of the upper layers, however, tend to densify the bottom layer. Ladd (1977) proposed an under-compaction procedure to minimize over-compaction and ensure uniformity within the specimen. Frost and Park (2003) critically assessed the MT method and found that it could induce over consolidated specimens with a variation in the relative density among layers of up to 15%, which is about twice that of air pluviated specimens.
Some studies have indicated that silty sand specimens reconstituted by the moist tamping method were not able to simulate the stress–strain response of in-situ alluvial deposits (Høeg
et al., 2000; Ishihara, 1993; Vaid et al., 1999). Sand specimens made by moist tamping may
have the most unstable structure and lower strength under monotonic or cyclic loadings (Kuerbis and Vaid, 1988; Høeg et al., 2000; Frost and Park, 2003; and Yamamuro and Wood, 2004). However, studies by Huang et al. (2004) and Huang & Huang (2007) on silty sand specimens prepared by the MT method showed higher strength.
1.4.1.2 Air Pluviation (AP) method
In the air pluviation (AP) method, dry soil particles fall through air before t hey are deposited into a mold from a distance above the top of the soil specimen by a pluviator. The AP method mimics the deposition process of aeolian deposits. The density of the soil specimen is related to the deposition intensity (mass of deposited soil per unit time) and vertical distance between the pluviator and top of the deposited soil. Various air pluviation methods have been proposed, with the major difference in the design of the pluviator. Miura and Toki (1982) developed a multiple sieving pluviation apparatus (MSP) to prepare sand specimens at various densities by controlling the rate of sand discharge, and the concept has been extended to prepare a large volume specimen by Ueng et al. (2004). Preparing a silty sand specimen with the AP method can easily cause particle segregation. Lo Presti et al. (1992) reported that particle segregation in both vertical and lateral direction can develop. Segregation in the lateral direction forms silt columns below the opening of the pluviator. The dry deposition (DD) method by Yamamuro and Wood (2004) may be considered as a special case of AP, where dry soil is deposited directly on the top of the soil specimen to minimize particle segregation for silty sand. However, Kuerbis and Vaid (1988) pointed out that air pluviated dry silty sands are prone to bulking and thus can result in lower monotonic and cyclic strength. The AP method has been used to prepare dry sand specimens for physical modeling tests (Fretti et al., 1995; Wang and
19 Lin, 2011). Benahmed (2001) has developed a motorized pluviator that permits to control both the sand flow and the velocity of rising the pluviator and hence the fall height. This apparatus consists essentially of a sand reservoir, a cylindrical body a diffuser and a lift system as illustrated in figure 1.10.this device permits us to have a wide density range that varies between ID = 0.05 (very loose) to 1 (very dense). Recently, Ueng et al. (2004) developed a special pluviator to prepare large saturated sand specimens for 1-g shake table tests by combining air pluviation and water deposition. However, the procedure cannot be used with silty sands, due to particle segregation.
Figure 1.10 - Pluviator presented by Benahmed (2001)
1.4.1.3 Water pluviation (WP) method
The water pluviation (WP) or water sedimentation method is similar to the AP method, except that the dry soil particles are pluviated into deaired water. The terminal velocity of the soil particles is significantly reduced in comparison with the AP method, as they pass through a layer of water instead of air. As a result, theWP specimens are generally looser than those created by AP. The WP simulates the process of alluvial deposition, or that of hydraulic fills. For relatively uniform sand, the WP and slurry deposition (SD) methods are more likely to duplicate the strength/dilatancy behavior of in-situ alluvial soils (Oda et al., 1978; Yamamuro and Wood, 2004; Yoshimi et al., 1984). It is also possible to use this technique to prepar e large volumes of saturated sandy soils for physical modeling tests. However, for silt or silty sands, the WP method tends to create segregation during the falling process. The SD method,
20 proposed by Kuerbis and Vaid (1988), is a modified version of WP for reconstituting silty sand specimens. In the SD method, the sand with silt/clay are first thoroughly mixed in deaired water, and then poured into a triaxial specimen mold lined with rubber membrane. The initially loose specimen is densified by tapping the mold or applying a consolidation pressure in the triaxial cell. Kuerbis and Vaid (1988) reported that the SD method is able to produce uniform silty sand specimens and simulate the behavior of natural silty sands. However, Høeg et al. (2000) compared the silty sand specimens prepared by the SD method with undisturbed samples, and concluded that this approach is promising but incapable to reproduce the stress–strain relationships seen with in-situ alluvial soil with fines.
Rahardjo (1989) used the SD method to prepare large specimens of silty sands for calibration chamber tests. A concrete mixer was used to ensure proper blending of sand and silt. After several hours of blending, the specimen was then poured into a mold for consolidation. The cone penetration (CPT) performed in the silty sand specimen prepared by the SD method showed limited success in terms of the uniformity and repeatability of cone tip resistance (qc). In any case, the complexity of the SD method makes it impractical to prepare large size specimens.
1.4.1.4 Mist pluviation (MP) method
Huang et al. (2015) proposed a new specimen preparation technique for preparing reconstituted silty sand specimens called the mist pluviation (MP) method. The MP method is named based on the process of soil deposition and the medium that the soil falls through. In the MP method, the dry soil particles are dispersed from a pluviator then sequentially pass through air, mist, and water. The mist zone is introduced to mix relatively uniform water droplets with soil particles, and this significantly reduces the size difference of soil and water mixtures and thus potential of particle segregation in the air. A thin water layer on top of the deposited soil mimics the sedimentation process, and saturates the soil without inducing severe particle segregation. A schematic diagram of this approach is shown in figure 1.11. Also the setup of the mist pluviation system and details of the pluviator are shown in figure 1.12.
21
Figure 1.11- Schematic layout of the mist pluviation method (Huang et al. 2015)
22 Huang et al. (2015) performed a series of triaxial tests on a silty fine, Mai Liao sand (MLS) to evaluate the performance of the MP method with regard to homogeneity, repeatability, undrained monotonic compression, and cyclic strength of triaxial specimens with various fines contents Fc. Results show that the MP method can produce macroscopic homogeneous specimens, regardless of the Fc and particle gradations (figure 1.13). Furthermore, the repeatability tests confirm that this method can produce repeatable shear behavior for silty sands (figure 1.14).
The MP specimens have shown dilative, strain-hardening behavior under monotonic undrained triaxial compression while MT specimens at the same initial state showed contractive, strain-softening behavior. Similar dilative behavior had been observed on undisturbed fluvial sands and those reconstituted by water pluviation method which indicates that the MP method has higher potential than other techniques to produce the monotonic shear response similar to that of the WP method, which is the reconstitution technique that best reproduce the response of natural alluvial and hydraulically filled sands.
(a) : Vertical direction (b): Lateral direction
23
Figure 1.14 - Repeatability in cyclic undrained triaxial test (Huang et al., 2015)
1.4.2 Effect of reconstitution methods on the mechanical behavior of material
In the literature review concerning the influence of the reconstitution mode of sand samples on their behavior, it is obvious, according to many authors, that the reconstitution mode has a significant influence on the cyclic and monotonic shear resistance of sands (Mulilis et al. 1975; Tatsuoka et al. 1986).
Been and Jefferies (1985) noted that upon reconstitution of sand samples either by wet tamping or pluviation method, the samples show different shear behavior under drained conditions. Moreover, concerning the liquefaction instability Canou (1989) presented preliminary results showing that sand specimens prepared by wet tamping method are more unstable and more susceptible to liquefaction than those prepared by dry pluviation for the same void ratio. The same result was noted by Vaid et al. (1999) who confirmed that the wet tamping method favors the initiation of liquefaction compared to that of water pluviation. Benahmed et al. (2004) tested the effect of the reconstitution method on the behavior of two
24 reconstituted samples by wet tamping and dry pluviation. The sand used for the triaxial testing program is Hostun RF sand. Benahmed (2001) observed significant differences showing the strong influence of preparation procedures on corresponding behavior. She noted that wet tamping favors a very contractant and unstable behavior (strain softening) with a liquefaction type of response whereas dry pluviation favors a slightly dilatant and more stable response (strain hardening ) (see figure 1.15).
Yamamuro and Wood (2004) investigated the effect of depositional method on the undrained response of silty sands. Undrained triaxial compression tests were performed at an initial effective confining pressure of 25 kPa on Nevada sand containing 20% non-plastic silt content. Figure 1.16 present the results found by Yamamuro and Wood (2004) who have shown that the water pluviation WD method indicated a more volumetrically dilatant or stable response whereas dry methods appeared to exhibit a more co ntractive or unstable behavior. Moreover, they mentioned that effects were more noticeable at lower densities than higher densities. Juneja and Raghunandan (2010) conducted both drained CD and undrained CU compression tests on samples prepared using pluviation and tamping techniques under both dry and moist conditions. Results showed that samples prepared using tamping technique usually strain softens whereas those prepared by pluviation technique may harden or soften depending on the sample relative density and confining pressures applied during testing.
(a) (b)
Figure 1.15 - Influence of the specimen reconstitution procedure on the observed be havior, for a loose state of the sand: (a) shear curves; (b): effective stress paths (Benahmed et al. 2004)
25
Figure 1.16 - Undrained triaxial test results for medium and low densities showing the effect of reconstitution methods on the specimen behavior (Yamamuro et Wood 2004)
1.4.3 Effect of reconstitution method on the material structure
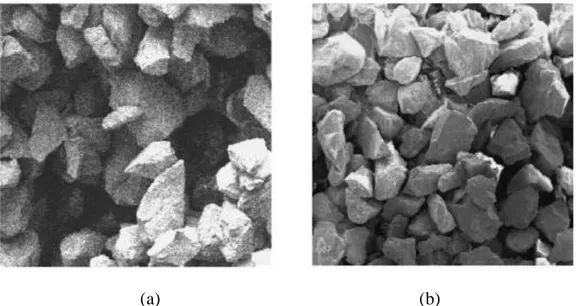
It is widely recognized that the mechanical behavior of soils in general and sands in particular depends to a large extend on the initial state in terms of the void ratio and effective stress state. However, and particularly for sands, the importance of initial structure is rarely referred to. Benahmed et al. (2004) studied the effect of the reconstitution method on the microscopic structure of Hostun sand RF. The microscopic observations of the sand structures corresponding to two reconstitution procedures of the samples are presented in figure 1.17. These observations allow to clearly identify two different and well characterized types of arrangements. For wet tamping, an irregular structure is observed, with predominance of aggregates and macrospores, whereas for dry pluviation, a more regular and classical single-grained structure is observed, with grains regularly stacked up and without macrospores. Also Yamamuro and Wood (2004) investigated the effect of depositional method on the microscopic grain structures of sand containing non-plastic silt. Specimens were reconstituted using water sedimentation (WS) and dry funnel deposition (DFD) methods. Yamamuro
26 (2004) observed that specimens that underwent temporary liquefaction (DFD) appeared to have a larger percentage of unstable grain contacts. Whereas specimens exhibiting a stable response (WS) contained more stable grain contacts (see figure 1.18).
(a) (b)
Figure 1.17 - Microphotographies of Hostun sand RF showing two differentiated struc tures :(a) aggregates and macropores (wet tamping); (b) regular stack (dry pluviation) (Benahmed et al. 2004)
Figure 1.18 - Comparison of grain contact structure between specimens formed by dry funnel deposition and water sedimentation containing 20% silt (Yamamuro and Wood 2004)
1.5 Influence of fines on the behavior of silty sands
Since the last 50 years, generation of excess pore water pressure (EPWP) and subsequent liquefaction of saturated sandy soils with or without fines has been a topic of extensive laboratory research. Most of the earlier research has focused on the liquefaction of clean sands
27 assuming that the presence of fines resists the development of pore water pressure. However, natural sand is found in nature under the form of a mixture of sand and fines.
Unfortunately, the liquefaction of this type of material is still unclear and there exist no definite conclusion about it. Besides, we could find contradictory results concerning this subject in the literature review of the effect of fine particles on the sand liquefaction phenomenon. This could be explained due to the fact that these authors have used different types of sand, fines content, densities and confining pressures. Moreover, they have used criteria based on different defi nitions of liquefaction resistance. For this reason, it is very interesting to study the effect of fine particles on the phenomenon of sand liquefaction. Although several authors have studied the effect of fines on the liquefaction resistance of sands for high values of fines content that ranges between 10% and 80%, it is interesting to note here that based on field studies following major earthquakes and the case histories of actual soil behavior during earthquakes there are some evidence that soils with greater fines content are less likely to liquefy. Okashi (1970) has realized during the 1964 Niigata earthquake that soils with fines content less than 10% were more likely to liquefy. Also, Tokimatsu and Yoshimi (1983) declared in a study of 17 worldwide earthquakes that 50% of liquefied soils had fines content less than 5%. Therefore, it would be very interesting to study soil behavior at very low fines content (below 5%).
1.5.1 Definitions and influence of different parameters 1.5.1.1 Intergranular void ratio and interfine void ratio
According to the literature review, many authors have evaluated the effect of fine particles on the liquefaction potential using the concept of intergranular void ratio es and interfines void ratio ef.
Based on the analysis of the mechanical behavior of silty sands, Kuerbis et al. (1988) were the first who proposed the intergranular void ratio es, where the volume of fine particles is considered as void as long as the fines are simply confined by the voids formed from the sand grains. Consequently, these fine particles do not participate in the shear resistance of the granular structure and the behavior of the mixture is dominated by the sand grains.
Therefore, this theory is applicable in the case where the fines content is less than a certain value that is the limiting fines content or the critical fines content. In other words, the fine
28 particles are totally confined within the matrix formed by the sand skeleton grains and hence they don’t participate or contribute to the shear resistance of the structure. In this case, the intergranular void ratio parameter is more representative than the global void ratio e.
On the other hand, when the fines content exceeds the limiting or the critical value, the quantity of fine particles is sufficient to establish active contact between each other whereas the sand grains loose contact among each other . The role of fines content becomes more pronounced as their amount increases progressively and those of the sand decrease. In this case, the interfines void ratio ef must be taken into consideration.
These two parameters can be simply calculated using the formulas proposed by Thevanayagam (1998). A schematic phase diagram proposed by Thevanayagam is presented in figure 1.19 to clarify the differences between these parameters.
Figure 1.19 - Schematic phase diagrams: (a) silty Sand; (b) silt Matrix ;( c) sand Matrix (Thevanayagam 1998).
29 We should also mention that the intergranular void ratio is also called sand skeleton void ratio (Polito and Martin II, 2001; Kuerbis et al. 1988; Dash and Sitharam, 2011) or granular void ratio (Ni et al., 2004).
1.5.1.2 Limiting fines content
It is known for now that the presence of fine particles in a sand deposit affects its general structure. When fines are added to a sand deposit, the latter passes from one phase to the other through a transition point.
Below this point, the soil structure is generally a sand dominated one with silt contained within a sand skeleton and therefore the fine particles are not active and they do not participate in the shear resistance of the material. Whereas beyond this point there are enough fines such that the sand grains loose contact with each other and the soil structure becomes a silt dominated one and hence the mechanical response of the material is dominated by the fine particles. This limiting value is called “fines content threshold”, “limiting fines content” or “critical fines content”. Figure 1.20 shows a schematic diagram presented by Karim et al. (2014) that illustrates the effect of adding fines on the behavior of sand.
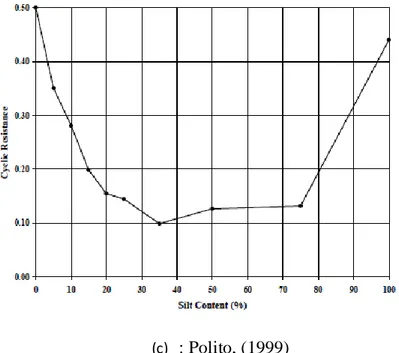
Limiting fines content (LFC) was first investigated by Polito (1999). Later, Hazirbaba (2005) proposed an approach to estimate LFC using the following equation:
where Wfines is the weight of fines and Wsand is the weight of sand in a sand-silt mixture. Similarly, Gf ,Gs, ef and es stand for specific gravity of fines, specific gravity of sand,
maximum index void ratio of fines and maximum index void ratio of sand respectively.
Figure 1.20 - Schematic diagram demonstrating particle arrangement of sand-silt mixture with the variation of silt content. (Karim et al., 2014)
30
1.5.1.3 Evolution of specific relative density – maximum and minimum void ratios
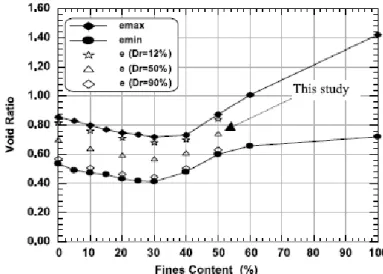
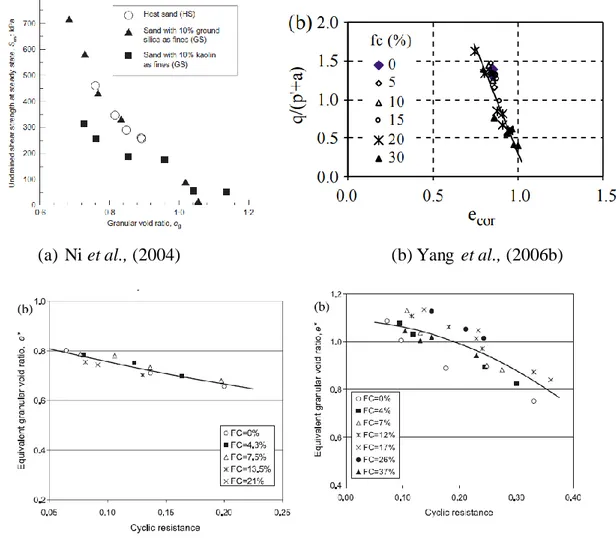
Many authors have noted that both the maximum and minimum void ratios present the same type of evolution with the increase in fines content Fc, (see figure 1.21). These two parameters decrease until the fines content reaches a certain value and then increases progressively (Lade et al., 1998; Polito et Martin II, 2001; Huang et al., 2004; Papadopoulou et Tika, 2008; Belkhatir et al., 2010; Dash et Sitharam 2011).
Figure 1.21 - Variation of maximum and minimum void ratios of the sand-silt mixtures. (Belkhatir et al., 2010)
As the maximum and minimum void ratios vary with the variation of fines content, Polito and Martin II (2003) distinguished two parameters: the relative density Dr using emin and emax of
clean sand (Eq 1.4), and the specific relative density Drs computed using the emin and emax of
the mixture (Eq 1.5). It is interesting to note here that many authors have determined the maximum and minimum void ratios for mixtures of sand and fines (for fines contents that reach 80%) using either the American procedure ASTM-4254-91 and ASTM-4253-93 or the French norm NF P94-059 even though that the ASTM limits this method by a fines content up to 15% and the French norm limits it by a fines content equal to 12%. Consequently, we can wonder if these estimations are really correct and, hence, if it is possible for us to compare these results among them since there is an absence of unity between the definitions of these parameters including the density index ID of the whole mixture and that of the sand matrix
IDmat, note that the density index ID and the relative density Dr are identical but ID is a decimal value of the density whereas the Dr is a percentage of the latter. For our study, we are going
31 to fix the density index of the sand matrix IDmat. Also, another question is imposed concerning
the state of the sand matrix upon adding large quantities of fines, in other words can we still talk about the effect of fines on the matrix or is it the fines particles who totally control the behavior of the mixture.
(1.4)
(1.5)
1.5.1.4 Equivalent intergranular void ratio
(Thevanayagam and Martin 2002) have improved the concept of intergranular void ratio and interfines void ratio. They have presented different possible granular structures of a mixture of sand and fines as illustrated in figure 1.22. These structures can be decomposed into three major categories:
1) coarse grain soil mix; 2) fine grain soil mix; 3) layered soil mix.
The silty sands could be represented by the first category. This category corresponds to the case where the fines content is less than the limiting value and consequently the sand grains control the behavior of the material. This category, according to Thevayanagam and seve ral authors could be subdivided to three sub-categories as follows:
- The fine particles are totally confined in the voids between the sand grains, and consequently don’t participate in the resistance of the material. These fine particles are totally inactive. Therefore, for this case the intergranular void ratio best describes the material’s state.
- The fine particles are decomposed into two different parts, one of them is found inside the grains matrix that is the inactive part, whereas the second part starts to touch the sand grains and hence becomes active.
- A part of the fines occupy the voids created by the sand grains whereas the other part interlocks between the sand grains and consequently separate them.
32 - For the last two cases, it is obvious that the fine particles participate in the forces chain and the shear resistance of the material and therefore the intergranular void ratio isn’t anymore a reliable factor. In this case and in order to take into consideration the role of the active fines, Thevayanagam et al. (2002) have proposed a new parameter known as the equivalent intergranular void ratio, computed using this formula:
The physical meaning of b is the fraction of fines which actively participates in the force structure. A gradual increase in the contribution of fines in the force structure can be reflected by setting b in the range of 0-1.
Figure 1.22 - Different granular structures of sand – fines mixture (Thevayanagam & Martin 2002)
The successful application of the equivalent intergranular void ratio have been discussed in the literature by (Thevanayagam 2002) and (Ni et al. 2004).
It is interesting to note that eeq has also been referred to by different authors under different names such as equivalent granular void ratio, contact index void ratio, equivalent
33 intergranular contact index and equivalent granular void ratio. For simplicity, the term equivalent granular void ratio will be used.
However, the prediction of the b value, and thus the determination of the equivalent granular void ratio is problematic and controversial. Some researchers assumed b independent of fines content and determined b for a given sand-fines type by a back analysis process (Ni et al. 2004). Thevanayagam and Martin (2002) reported that b=0.35 for Ottawa sand-silt mixture, and Ni et al. (2004) reported b=0.25 for Toyoura sand-silt mixture.
On the other hand, Rahman et al. (2008) has examined the factors affecting the b value based on published work in which that led him to a semi-empirical equation for predicting the b value based on fines size and fines content.
)] (r
(1.6)
Where k = (1-r0.25) and r=d
50/D10 where d50 is the fines particle diameter at 50% finer and D10 is the sand particle diameter at 10% finer. Thus k and r can be obtained from the grading curves. The other input parameter, fthre, is the threshold fines content or limiting fines content defined previously.
1.5.2 Influence of the non-plastic fines content on the initiation of instability
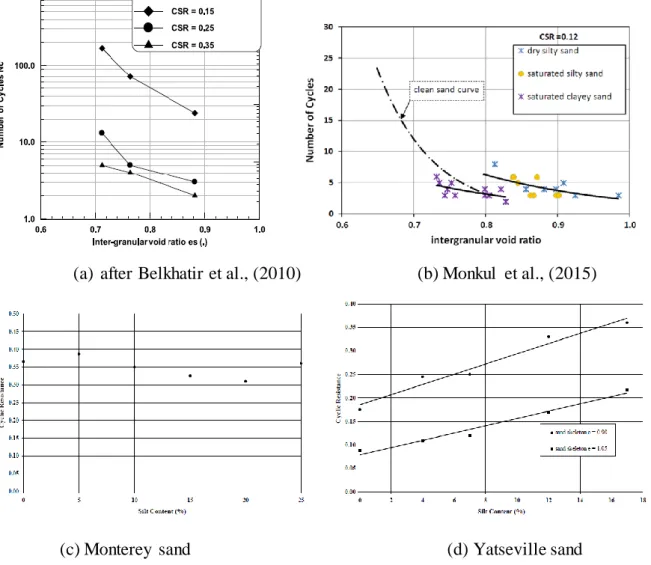
According to the literature review, there are different approaches in order to understand the behavior of silty sands, for example: evaluation in terms of global void ratio, intergranular void ratio, equivalent intergranular void ratio, the specific relative density and several other parameters. It is noted that the evaluation of liquefaction differs from one parameter to another, a good evidence has been presented by Karim et al. (2014) who has showed the different cyclic behavior as a function of the evaluating parameter based on published data of several authors (see figure 1.23). However, these results will be explained in detail in the following paragraphs.
34
Figure 1.23 - Results from previous studies on the effect of fines content (fc) on cyclic resistance: (a) studies at constant overall void ratio; (b) studies at constant sand skeleton void ratio; and (c) studies at constant relative density (Karim et al., 2014)
1.5.2.1 Evaluation in terms of global void ratio
Based on the results obtained by several authors concerning the effect of fines content on the cyclic liquefaction potential, the literature review shows contradictory results concerning this subject.
- Some authors have reported an increase in the cyclic resistance with the increase in fines content (Amini and Qi, 2000; Chang et al. 1982, Dezfulian 1982), (figure 1.24a) - Belkhatir et al., 2010; Stamatopoulos, 2010 and Carraro et al., 2003 have reported a
35 - Several authors have reported a decrease in the resistance until a certain limiting value and then an increase (Koester, 1994; Polito, 1999; Xenaki and Athanasopoulos, 2003; Papadopoulou and Tika, 2008) figure (1.24 c).
(a) Chang et al., (1982)