Université de Montréal
The Relationship Between Fructose Consumption and Risk of Obesity in Two Aboriginal Populations
Par Zohreh Emad
Département de Nutrition Faculté de Médecine
Mémoire présenté à la Faculté des études supérieures en vue de l’obtention du grade de
Mâitre ès science (M.Sc.) en Nutrition
Avril, 2010
Université de Montréal
Faculté des Études Supérieures
Ce mémoire intitulé:
“The Relationship Between Fructose Consumption and Risk of Obesity in Two Aboriginal Populations”
Présenté par: Zohreh Emad
A été évalué par un jury compose des personnes suivantes: Dr. Jean-Marie Ékoé : president-rapporteur
Dr. Lise Coderre : membre du jury Dr. Olivier Receveur : directeur de recherche
Résumé
La prédominance de l'obésité qui touche les enfants et les adultes a augmenté dans le monde entier ces dernières décennies. Les différentes études épidémiologiques ont prouvé que l'obésité est devenue une préoccupation profonde de santé aux États-Unis et au Canada. Il a été montré que l'obésité a beaucoup d’effets sur la santé ainsi il serait important de trouver différentes causes pour le gain de poids. Il est clair que l'obésité soit la condition de multiples facteurs et implique des éléments génétiques et environnementaux. Nous nous concentrons sur les facteurs diététiques et particulièrement le fructose où sa consommation a parallèlement augmenté avec l'augmentation du taux d'obésité. La forme principale du fructose est le sirop de maïs à haute teneur en fructose (HFCS) qui est employé en tant qu'édulcorant primordial dans la plupart des boissons et nourritures en Amérique du Nord. Il a été suggéré que la prise du fructose serait probablement un facteur qui contribue à l’augmentation de la prédominance de l'obésité. L'objectif de cette étude était d'évaluer s'il y a un rapport entre la consommation du fructose et le risque d'obésité. Nous avons travaillé sur deux bases de données des nations Cree et Inuit. Nous avons eu un groupe de 522 adultes Cree, (263 femmes et 259 hommes) dans deux groupes d'âge : les personnes entre 20 et 40 ans, et les personnes de 40 à 60 ans. Nous les avons classés par catégorie en quatre groupes d'indice de masse corporelle (IMC). L'outil de collecte de données était un rappel de 24 heures. En revanche, pour la base de données d'Inuit nous avons eu 550 adultes (301 femmes et 249 hommes) dans deux groupes d'âge semblables à ceux du Cree et avec 3 catégories d’indice de masse corporelle. Les données dans la base d'Inuit ont été recueillies au moyen de deux rappels de 24 heures. Nous avons extrait la quantité de fructose par 100 grammes de nourriture
consommés par ces deux populations et nous avons créé des données de composition en nourriture pour les deux. Nous avons pu également déterminer les sources principales du fructose pour ces populations. Aucun rapport entre la consommation du fructose et l’augmentation de l’indice de masse corporelle parmi les adultes de Cree et d'Inuit n’a été détecté. Nous avons considéré l’apport énergétique comme facteur confondant potentiel et après ajustement, nous avons constaté que l'indice de masse corporelle a été associé à l’apport énergétique total et non pas à la consommation du fructose. Puisque dans les études qui ont trouvé une association entre la consommation de fructose et l’obésité, le niveau de la consommation de fructose était supérieure à 50 grammes par jour et comme dans cette étude ce niveau était inférieur à cette limite (entre 20.6 et 45.4 g/jour), nous proposons que des effets negatifs du fructose sur la masse corporelle pourraient être testés dans des populations à plus haute consommation. Les essais cliniques randomisés et éventuelles études cohortes avec différents niveaux de consommation de fructose suivis à long terme pourraient aussi être utiles.
Mots clés : fructose, sirop de maïs à haute teneur en fructose (HFCS), obésité et poids excessif
Summary
The prevalence of obesity has increased worldwide in recent decades in both children and adults. Different epidemiologic studies have shown that obesity has become a serious health concern in United States and Canada. It has been proved that obesity has many adverse health outcomes so it is important to identify the different causes of weight gain. It is clear that obesity is a multifactor condition and involves both genetic and environmental elements. In this study, we focus on dietary factors, specifically the consumption of fructose that has increased in parallel to the increase in the obesity rate. The main form of fructose in the diet is high fructose corn syrup (HFCS) that is used principally as a sweetener in most beverages and foods in North America. It has been suggested that the intake of fructose may possibly be a contributing factor to the increased incidence of obesity. The objective of this study was to assess if there is a relationship between consumption of fructose and risk of obesity. We worked on two databases. The first database contained 24-hour recall data collected from a sample of 522 Cree adults (263 women and 259 men), divided into two age groups: people between 20 and 40 years old, and people from 40 to 60 years old. We categorized them into four body mass index (BMI) groups. The second database contained data from two 24-hour recalls administered to 550 Inuit adults (301 women and 249 men). These adults were divided into two age groups similar to Cree and with three BMI categories. The amount of fructose per 100 grams of food consumed by these two samples was calculated and we created food composition data for both. We also determined the main sources of fructose in these populations that was sugar sweetened beverages. Based on our results, we could not detect any relationship between consumption of fructose and an increase in BMI among Cree and Inuit adults. We considered energy intake as a potential cofounding factor and, after adjustment, we found
that BMI was associated with total energy intake and not with the consumption of fructose. Since in studies that have found this association the level of fructose consumption was more than 50 grams per day but in this study, this level was lower than this limit ( from 20.6 to 45.4 g / day) , we suggest that negative effects of fructose on body weight may appear only at higher dose. Randomized clinical trials and prospective cohort studies using different levels of consumption with long term follow up could be useful.
Table of contents
Condensé ... Erreur ! Signet non défini.
Summary ... v
Table of contents ... vii
List of tables ... viii
List of figures: ... ix
List of abbreviations ... x
List of abbreviations ... x
Acknowledgement ... xi
I. Introduction ... 2
II. Litterature review ... 4
2.1 Causes of obesity ... 5
2.1.1 Genes and heredity ... 5
2.1.2 Environmental causes of obesity ... 6
2.1.2.1 Non dietary causes ... 7
2.1.2.2 Dietary causes ... 7
2.2 Types of sugar ... 8
2.3 History of sugar ... 9
2.4 Fructose ... 10
2.4.1 Sources of fructose ... 11
2.4.2 Level of fructose consumption ... 11
2.4.3 Fructose metabolism ... 12
2.4.4 Relationship between fructose and body weight ... 14
2.5 Role of fructose as a potential risk factor of obesity ... 15
2.5.1 Evidence from animal studies ... 16
2.5.2 Evidence from human studies ... 27
III. Rationale ... 43
IV. Methodology ... 46
4.1 The Cree database ... 46
4.2 The Inuit database ... 48
4.3 Statistical analysis ... 49
V. Results ... 51
5.1 Cree database ... 52 5.2 Inuit database ... 69VI. Discussion ... 83
VII. Bibliography ... 89
VIII. Annex ... xii
Annex 1: Population distribution that responded to the 24h recall ... xiii
Annex 2: Cree food composition database (amounts of fructose in g/100g) ... xiv Annex 3: Inuit food composition database (amounts of fructose in g/100g) ... xlviii
List of tables
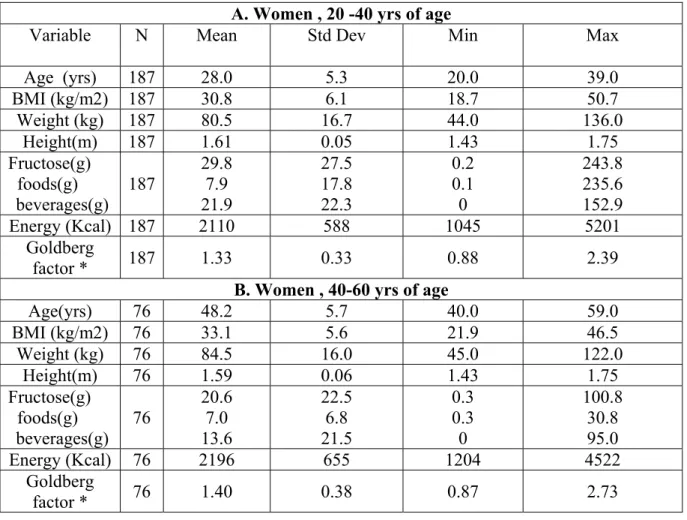
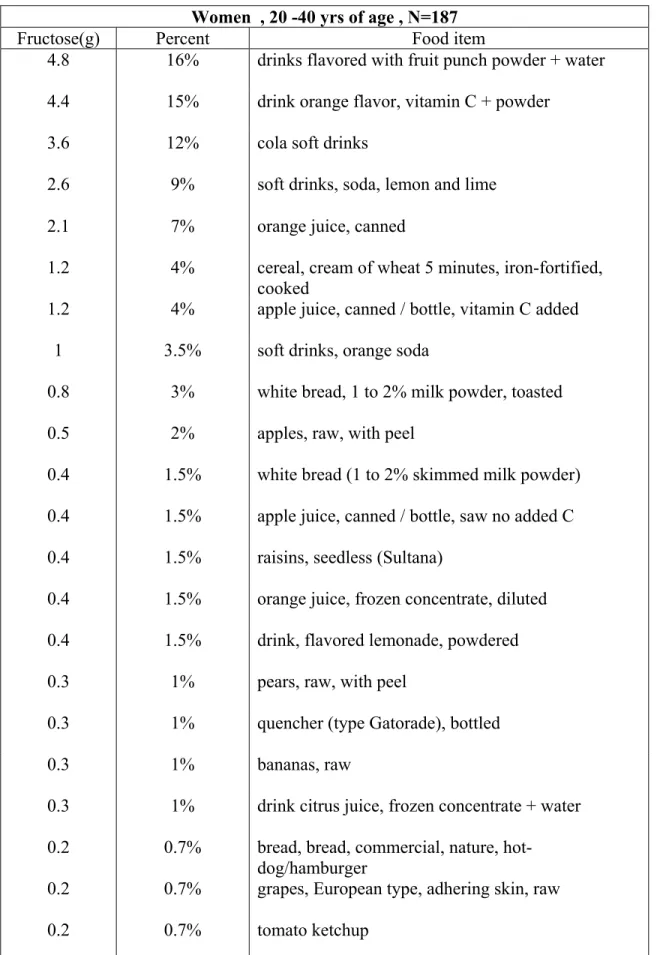
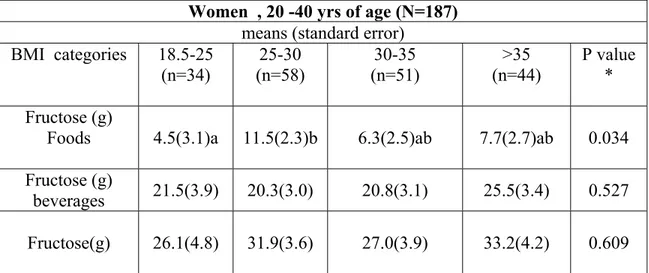
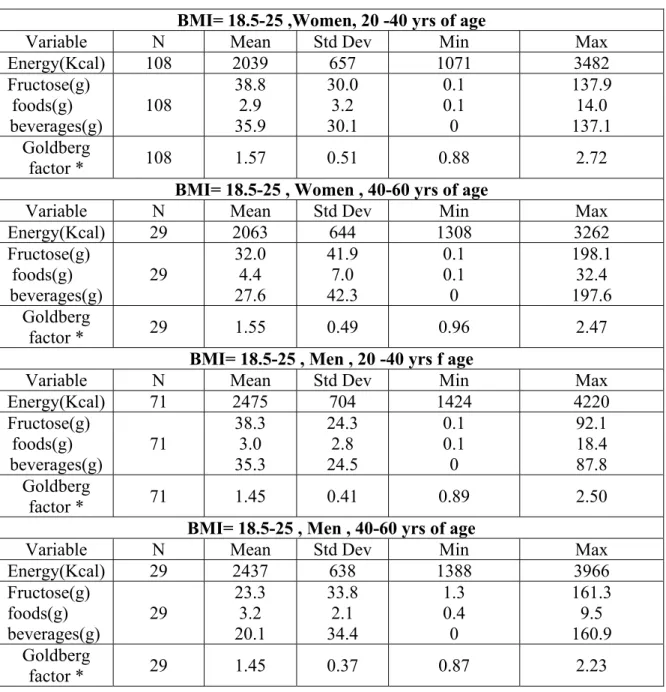
Table 1: Summary of animal studies ... 25 Table 2: Summary of human studies ... 38 Table 3: Description of Cree database (mean, standard deviation, minimum and maximum of characteristic variables) ... 54 Table 4: Studied variables by BMI categories ... 56 Table 5: Principal sources of fructose in Cree database (sources accounting for at least 90% of fructose intake) ... 60 Table 6: Association between BMI categories and fructose intake by sex in Cree database ... 65 Table 7: Association between BMI categories and fructose intake by sex in Cree database (adjusted for energy intake) ... 67 Table 8: Description of Inuit database (mean, standard deviation, minimum and maximum of characteristic variables) ... 71 Table 9 : Body Mass Index (BMI) categories in Inuit database ... 73 Table 10: Principal sources of fructose in Inuit database (sources accounting for at least 90% of fructose intake) ... 76 Table 11: Association between BMI categories and fructose intake by sex in Inuit database ... 78 Table 12: Association between BMI categories and fructose intake by sex in Inuit database (adjusted for energy intake) ... 80
List of figures:
Figure 1: Metabolic pathways for fructose:. ... 13 Figure 2: Estimated intakes of fructose ... 15
List of abbreviations
APM: AspartameBMI: Body mass index
CANDI: Canadian Dietary Information System CI: Confidence interval
CNF: Canadian Nutrient File CNS: Central nervous system Cu: Cupper
D: Dextrose D: Day F: Fructose
FAFH: Food away from home FFQ: Food frequency questionnaire FS: Fructose-starch
G: Gram
GABA: γ-aminobutyric acid
GAD65: Glutamic acid decarboxylase enzyme GLUC: Glucose
HFCS: High fructose corn syrup 24HR: 24-h dietary recall
HFFQ: Harvard Service Food Frequency Questionnaire HFr: Fructose-sweetenedbeverages
HGI: Glucose-sweetenedbeverages KCAL: Kilo calorie
KG: Kilogram KJ: Kilo joule L: liter
M: Meter Max: Maximum
MC4R: Melanocortin-4 receptor gene MIN: Minimum
NPY: Neuropeptide Y
RCSD: Regular carbonated soft drink S: Corn starch
SAS: Statistical Analysis System SE: Standard deviation
SSBs: Sugar-sweetened beverages SUC: Sucrose
TG: Triglycerides U.S: United States
VMH: Ventromedial hypothalamic
YFFQ: Youth food-frequency questionnaire YRS: Years
Acknowledgement
I would like to thank Professor Olivier Receveur, my research director for his supervision and encouragement during this research study.
My sincere gratitude is extended to Dr. Lise Coderre and Dr. Jean-Marie Ékoé for serving on my committee. My special thanks to Dr. Ghadirian for his support and inspiring guidance through my studies.
I am also grateful to my colleague Kendra Siekmans for her valuable effort to review and edit this work.
I would like to express my deepest gratitude toward my dear parents and my family. Last but not least, my deep appreciation goes to my best friend, my dear husband Afshin Khalvatti whose love, patience and support enabled me to complete this work.
I. Introduction
The prevalence of obesity has increased worldwide (Elliott et al, 2002). According to Statistics Canada, the age-adjusted obesity rate was 13.8% in 1978/79 compared to 23.1% in 2004 (Tjepkema, 2004). A separate study shows that the Aboriginal Canadians have the highest frequency of obesity (Tremblay et al, 2005). This increase in the prevalence of Aboriginal obesity is consistent with other studies (Waldram et al, 2006).
Different genetic and environmental factors contribute to excess weight and obesity, such as race/ethnicity, age, physical activity, sedentary behaviors, food consumption patterns, smoking, technological advancements, and psychological factors (CDC, 2004; Rashad and Grossman, 2004 ; Forshee et al, 2007). Different groups in society, including researchers, government, and other organizations, are concerned with and working towards reducing the alarming rates of overweight and obesity (Forshee et al, 2007). This is necessary as obesity is associated with diseases like Type 2 diabetes, coronary heart disease and cerebrovascular disease (Webber, 2001). Obesity also increases the risk of obstructive sleep apnea, osteoarthritis of weight-bearing joints and some types of cancer (Webber, 2001).
On the other hand, the consumption of added sugars, notably fructose, has also increased recently (Elliott et al, 2002). Fructose can be found in great abundance because it is highly soluble in water, more so than glucose. It helps everything to be sweeter, makes bread crusts browner and cookies softer. Fructose is sweeter than sucrose, and so high-fructose corn syrup has become a prevalent sweetener used in the industry in the past thirty years.High fructose corn syrup (HFCS) was less than 1% of caloric sweeteners in 1970 but
in the year 2000 it had become 42% of caloric sweeteners used in the United States (Bray et al, 2004). There are important similarities between the trend in HFCS availabilityand the trends in the prevalence of obesity in the United States(Bray et al, 2004). However, evidence for a causal relationship between fructose consumption and risk of obesity is still lacking (Forshee et al, 2007).
This work will investigate whether there is a relationship between fructose consumption and risk of obesity in two Aboriginal populations in Canada, adult Cree and Inuit.
II. Litterature review
2.1 - Causes of obesity
Obesity is a condition of excess body fat. Although the measurement of body fat is difficult, the use of the body mass index (BMI) is a standard method of defining obesity and overweight status (Shils, 2005). BMI is defined as an individual’s weight in kilograms divided by their height in meters squared (CDC, 2004).
According to the CDC (2004) categories, a BMI equal to or less than 18.5 is classified as underweight, a BMI between 18.5 and 24.9 as healthy weight, a BMI between 25 and 29.9 as overweight and a BMI equal to or greater than 30 as obese. The exact etiology of obesity is still unclear but it appears to be the result of a combination of different factors, including genetic, metabolic and environmental.
2.1.1 Genes and heredity
The fact that obesity is seen more in families suggests that there are genetic factors in its etiology, but one should also consider that a family’s eating habits are generally similar (CDC, 2004). The idea is that obesity is a condition caused by an interaction between genes and environmental factors (e.g., nutrient intake and physical activity) (Shils, 2005).
There are studies that have shown some single genes cause obesity in rodents. In humans, one of the genes that researchers think is contributing to obesity is the melanocortin-4 receptor gene (MC4R) (Shils, 2005). There is evidence that strengthens the hypothesis of a susceptibility gene for obesity in the Chromosome 10p11–12 locus. Marker D10S197 is located in intron 7 of the GAD2 gene encoding the glutamic acid decarboxylase enzyme (GAD65). GAD65 catalyzes the formation of γ-aminobutyric acid (GABA) from
L-glutamic acid and is expressed in both pancreatic islets and the brain. GABA is colocalized in neuropeptide Y (NPY) neurons and is implicated in the leptin pathway through the arcuate nucleus in the hypothalamus. GABA interacts with NPY in the paraventricular nucleus to stimulate food intake (Boutin et al, 2003). It is suggested that several regions of the human genome might be involved in the susceptibility to obesity. The most important human chromosomal regions exhibiting linkage seem to be on 1p, 3p, 6p, 7q and 11q (Bouchard, 1997). The latest obesity gene map indicates that there are more than 100 genes or markers which have the potential to influence obesity (Pérusse and Bouchard, 2000).
2.1.2 Environmental causes of obesity
Environmental causes of obesity fall into two groups, non dietary and dietary causes, as explained in more detail below. Psychological factors have an effect on people’s weight gain and loss (CDC, 2004). Some psychological conditions that affect weight gain are depression and stress (CDC, 2004) and some examples of eating disorders are Night Eating Syndrome, Binge Eating Disorder, and Progressive Hyperphagic Obesity (CDC, 2004). Some disorders can affect body weight, including Cushing Syndrome, hypothyroidism, Down Syndrome, Cohen Syndrome, hypothalamic disorders, Polycystic Ovary Syndrome, and growth hormone deficiency (Shils, 2005).
A number of medications can be a cause of obesity, e.g. steroid medications, some migraine medications and some antidepressants (CDC, 2004).
Smoking cessation may be related to a small weight gain in spite of its health benefits (Shils, 2005).
2.1.2.1 Non dietary causes
Physical activity and physical fitness have a large role in controlling body weight (Shils, 2005). It is commonly thought that the current increased prevalence of obesity is mainly affected by lack of physical activity (Hill, 1998). Researchers have found that the risk of being obese is negatively associated with physical activity and positively related with time spent in sedentary behaviors (Dunton et al, 2009).
2.1.2.2 Dietary causes
Dietary factors that have an effect on weight gain are not only diet composition but also energy excess, high energy density, portion size and diet qualities (Shils, 2005). Diets high in fat have been shown to be associated with increased risk of obesity (Moussavi et al, 2008).The studies in both animals and humans support the effects of dietary fat in development of overweight conditions and obesity (Shils, 2005). The suggested mechanism by which fat can contribute to weight gain is that fat is an energy dense macronutrient and is less satiating than carbohydrates and proteins, so it could lead to over consumption (Moussavi et al, 2008). It has been suggested that dietary fat composition also may have an effect on obesity (Moussavi et al, 2008).
Different studies show a positive relationship between fruit and vegetable consumption with being physically active, not smoking and not being overweight (Shils, 2005).
Dietary carbohydrates and sugars have been shown in different studies to increase the risk of weight gain (Shils, 2005). Here, we focus on dietary carbohydrates.
After World War II, the worldwide diet changed significantly. For example, in the United States the consumption of caloric sweetener increased (Popkin and Nielsen, 2003). It is said that the favorite taste for human beings is sweet and it is an inborn preference (Sigman-Grant and Jaime, 2003). The amniotic fluid is sweet; breast milk and commercial formula are also sweet. The principal sweetener in the world is sugar (Sigman-Grant and Jaime, 2003). Sugar adds other characteristics to foods than just sweetness; this includes texture, appearance, viscosity, capability to retain water, osmotic pressure, and consistency (Sigman-Grant and Jaime, 2003). Sugar alcohols, like sorbitol, mannitol, xylitol, maltitol, erythritol,and lactitol, also add qualities to foods, like texture to gums and candies, water retention and cooling sensations (Sigman-Grant and Jaime, 2003). Prior to recent centuries, sweets were used merely in ceremonies or other special occasions, but nowadays there are many snacks, desserts and candies in our daily diet (Shils, 2005).
2.2 Types of sugar
Definitions
From the chemical view, sugar is a substance that consists of carbon, hydrogen and oxygen atoms. Sugar is categorized as monosaccharides, disaccharides and oligosaccharides (Sigman-Grant and Jaime, 2003).
Monosaccharides have 3-7 carbon atoms per monomer. Absorbable types of monosaccharide are sugars. This group contains the glucose, fructose and galactose that exist in the human diet as well as mannose (Sigman-Grant and Jaime, 2003).
Disaccharides consist of two coupled monosaccharides (2 monomers). Sucrose, lactose, trehalose and maltose are disaccharides in the human diet (Sigman-Grant and Jaime, 2003).
Oligosaccharides have 3-9 monomers (Sigman-Grant and Jaime, 2003).
2.3 History of sugar
The entrance of sugar into the world diet was not so long ago. Before the usage of sugar, honey was the principal sweetener, but its use was limited to the higher social classes and after considered a medicine (Johnson et al, 2007). New Guinea and the Indian subcontinent were the first developers of sugar from sugar cane. In the middle Ages, sugar was introduced to Europe as it passed through Venice (Italy) and other trading ports. At that time it was used just by very wealthy people. In the 1400s, Spain and Portugal started to produce sugar cane (Johnson et al, 2007). Christopher Columbus then brought sugar cane in his voyages to Haiti, the Dominican Republic, the Caribbean islands, Guyana coasts, Brazil and the southern United States (Johnson et al, 2007). The increase in sugar production led to its increased accessibility to the public. In the 1800s, Germany, France and Austria produced sugar from beets. This production, in addition to production of sugar from cane, caused a vast sugar production increase in the world, thereby increasing its consumption (Johnson et al, 2007). By 1970, another sweetener started to be commonly used in the United States: high-fructose corn syrup (HFCS). HFCS is used to sweeten soft drinks, fruit drinks, pastries and processed foods. All in all, there has been a 30% increase in sweetener intake in the past forty years (Johnson et al, 2007).
2.4 Fructose
For thousands of years there was a small amount of fructose in humans’ diets, mostly from fruits (Basciano et al, 2005). In 1976, fructose was introduced as a substitute for sugar because of some advantages over glucose; it has a smaller effect on serum insulin concentrations and no influence on plasma glucose levels. Therefore, fructose was named a positive alternative for controlling diabetes (Basciano et al, 2005). Ten years later, high fructose corn syrup was suggested as a substitute for fructose because it was cheaper. After some time, researchers noticed some negative effects of this fructose in weight gain, obesity and insulin resistance (Basciano et al, 2005). One study showed the unfavorable effect of replacing fructose in diabetic patients (Basciano et al, 2005). The metabolism of fructose is done by the liver. If a large amount of fructose enters into the liver, the result will be rapid stimulation of lipogenesis and an increase of triglycerides (TG), causing a reduction in insulin sensitivity (Basciano et al, 2005).
In the United States, HFCS is a substitute for sucrose as a sweetener in most beverages and foods, but in other countries sucrose is still the first choice (Forchee et al, 2007). The food and beverage industry were interested in using HFCS because of its taste and its capacity to mix together with other ingredients (Schoeller et al, 1997; Forchee et al, 2007). There are a number of HFCS: HFCS-42, HFCS-55 and HFCS-90 (Forchee et al, 2007). HFCS-42 contains 42% fructose, 53% glucose and 5% polysaccharides. HFCS-55 contains 55% fructose, 42% glucose and 3% polysaccharides. HFCS-90 consists of 90% fructose, 9%
glucose and 1% polysaccharides (Forchee et al, 2007). At first, HFCS-42 was used most often, but in the 1980s the use of HFCS-55 increased (Forchee et al, 2007).
2.4.1 Sources of fructose
Fructose can be found naturally in fruit, some vegetables, honey and some plants (Basciano et al, 2005). About two-thirds of HFCS used in the United States is found in beverages. Many processed foods have HFCS as well (Bray et al, 2004). It has been said that almost all food and beverages that have a caloric sweetener contain HFCS in the United States. These include soft drinks, fruit drinks, dairy desserts, flavored yogurts, cereals, candies, ice cream, pastries and jellies (Bray et al, 2004). About 60% of the calories in apple juice, a base for some fruit drinks, are from HFCS (Bray et al, 2004). The utilization of HFCS-42 and HFCS-55 is different. HFCS-42 is used in baked goods, canned fruits and condiments, while HFCS-55 is mostly used in soft drinks, sweetened beverages, ice cream and frozen desserts (Forshee et al, 2007).
2.4.2 Level of fructose consumption
Since ancient times, the consumption level of fructose in a daily diet was 16-20 grams, principally from fruits. Mean consumption of fructose among all Americans was 37 g per day (8% of total intake) in 1977-1978 (Vos et al, 2008). Another study shows 29-54 g per day consumption of fructose in 1993 in American adolescents and adults (Elliott et al, 2002). Yet another study based on food disappearance data shows an increase in per capita use of HFCS from 0.23 kg in 1970 to 28.4 kg in 1997 in United States (Putnam and Allshouse, 1999).
The consumption of fruit and vegetables has also increased by 19% from 1982 to 1997, so investigators proposed that of the 97 g per day of fructose consumed in 1997; about 15-16
g came from fresh fruits and vegetables (Elliott et al, 2002). The consumption of two soft drinks per day (355 ml) could add about 50 g of fructose (Elliott et al, 2002). After the great change in diet from adding sweeteners more recently, the consumption level of fructose is often 85-100 g per day (Basciano et al, 2005).
2.4.3 Fructose metabolism
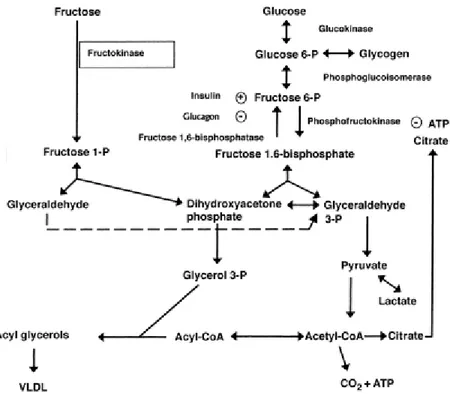
The metabolism of fructose is done in the liver. The portal vein delivers absorbed fructose to the liver and then fructose is phosphorylated there by adenosine triphosphate to make fructose-1-phosphate. The enzyme, fructokinase, catalyzes this reaction. Then aldolase B splits fructose-1-phosphate into glyceraldehyde and dihydroxyacetone phosphate, and these two molecules can transform to glyceraldehyde-3-phosphate (Elliott et al, 2002). So fructose bypasses the control point that is the inhibitory signals from citrate and ATP to inhibit phosphofructokinase production (Elliott et al, 2002) (Figure 1). The result of this different metabolism is that fructose is a source of glycerol-3-phosphate and acetyl-CoA for lipogenesis in the liver (Elliott et al, 2002). Fructose consumption also leads to increased amounts of circulatory lactate compared to glucose (Elliott et al, 2002).
Figure 1: Metabolic pathways for fructose; Adapted from Elliott et al (2002).
Further fructose does not stimulate pancreatic ß cells to release insulin but glucose does (Elliott et al, 2002). This could be because the fructose transporter GLUT5 is found in low concentration in these cells (Elliott et al, 2002). Insulin receptors in the central nervous system control food intake, body adiposity and energy homeostasis (Elliott et al, 2002). Subsequently, the reduction in the delivery of insulin into the CNS could affect weight gain (Elliott et al, 2002). Insulin stimulates leptin secretion and has a regulatory role for its production and secretion (Havel, 2002). Some studies have shown that leptin decreases food intake and activates the sympathetic nervous system in some animals (Elliott et al, 2002). Other studies have found that humans with impairments in producing leptin have resulting hyperphagia and obesity (Elliott et al, 2002). Researchers have found that a
reduction in circulatory leptin levels is associated with an increase in a sense of hunger and that leptin administration reduces appetite (Elliott et al, 2002).
The other point of difference between fructose and glucose metabolism is that the ghrelin level was less suppressed after the ingestion of a fructose-sweetened beverage compared with a glucose-sweetened beverage (Elliott et al, 2002).Ghrelin also has been proposed to be a key regulator of energy balance in the CNS, similar to insulin and leptin (Elliott et al, 2002). Ghrelin is the only known circulating orexigenic hormone. It is a stomach-derived peptide. Ghrelin is acylated with a medium-chain fatty acid by the enzyme ghrelin O-acetyltransferase (GOAT) and has a wide range activities including central control of food intake (Kirchner, 2010).Therefore, a decline in insulin and leptin levels and an increase in ghrelin could result in a larger energy intake and possibly an overweight condition and obesity (Elliott et al, 2002). There is also other research that found that the satiety level after fructose and glucose consumption differs, possibly because fructose was unable to stimulate enough insulin and leptin and inhibit ghrelin (Teff et al, 2004). Another theory is that calories ingested in liquid form do not give the sensation of satiety and the body does not compensate for calories in liquid form (Bray et al, 2004).
Some researchers have also proposed that fructose may slow the basal metabolic rate (Johnson et al, 2007).
2.4.4 Relationship between fructose and body weight
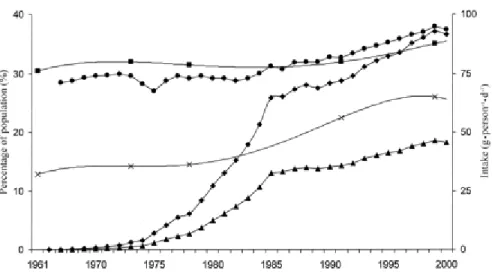
Studies suggest that there is an estimated parallel increase in the trends of HFCS’ availability and the prevalence of obesity in the United States (Bray et al, 2004) (Fig.2). The graph adapted from the study of Bray et al. (2004) shows these trends. They used the
data on HFCS availability and age-standardized nationally representative measure of obesity between 1960 and 1999.
Figure 2: Estimated intakes of total fructose (•), free fructose ( ), and high-fructose corn syrup (HFCS, ) in relation to trends in the prevalence of overweight ( ) and obesity (x) in the United States; Adapted from Bray, 2004.
Another ecological study showed that trends in the prevalence of obesity and diabetes were consistent with an increase in consumption of refined carbohydrates in the United States (Gross et al, 2004). Other findings show that there is a similarity between an increase in sugar consumption and obesity; obesity was originally observed in rich people with access to sugar and the countries that have the first documentation of obesity, high blood pressure and diabetes, England, France and Germany, are where the use of sugar first became common. Additionally, in the United States and United Kingdom there has been a corresponding increase in sugar intake and weight gain. The increase in obesity in developing countries is lagging in comparison to developed countries and the entry of sugar to these countries also follows this trend (Johnson et al, 2007).
There are some studies about the relationship between fructose consumption and the risk of obesity, but they are limited due to the newness of the subject. More time is needed in order to evaluate this relationship fully. Here we describe studies that generally have focused on proxies for fructose consumption. We searched Medline and Pubmed to find these studies using the key words fructose, high fructose corn syrup, obesity and overweight. We also found some studies by reviewing references of retrieved articles. The studies are presented in reverse chronological order, starting with animal studies and then human studies.
2.5.1 Evidence from animal studies
Shapiro et al. (2008) assessed if chronic fructose consumption causes leptin resistance, which consequently could promote obesity in response to a high-fat diet. They used 23 male Sprague Dawley rats that were divided into two groups: 12 rats on a 60% fructose diet and 11 rats were fed a fructose-free control diet for6 months. After six months half of the ratsin each group were then switched to a high-fat diet for 14 days,whereas the other rats continued on their particular diets. Rats in both groups gradually gained weightover the six months. In general there were no differences in food intake or body weightgain between control and high-fructose-fed rats. No differences were evident in serum cholesterol, uric acid, fasting glucose levels, blood urea nitrogen, or serum creatinine between the two groups. Serum leptin levels were also similar between groups and increased in both groups in parallel with the rise in adiposity. Intraperitoneal leptin injections howeverreduced 24-h food intake in the fructose-free group but had no effect in fructose-fed rats. All groups increased food intake and body weight when they were switched to the high-fat diet, but rats that had formerly been fed fructose then showed
significantly higher energy intake, weight gain and adiposity. The authors explained that a strong point in this study is that it showed that a silent leptin resistance occurred without any obvious differences detected between the fructose and control-fed rats. So the detrimental effects of chronic fructose consumption may build up long before there is any evidence of elevated leptin or detectable obesity.
Nakagawa et al. (2006) hypothesized that fructose-induced hyperuricemia may have a pathogenic role in metabolic syndrome. They performed four sets of experiments on male rats (n=24). The first experiment was treatment of fructose-induced hyperuricemia with allopurinol. The second experiment was prevention of fructose-induced hyperuricemia with allopurinol. A third experiment looked at the effect of lowering uric acid by either allopurinol or benzbromarone on body weight and food consumption. The fourth experiment was a comparison between 60% dextrose and 60% fructose in the development of metabolic syndrome and the effect of lowering uric acid with benzbromarone.
Serum uric acid levels, systolic blood pressure, and fastinginsulin levels were elevated in fructose-fed rats compared withrats fed a control diet. Thebody weight of fructose-fed rats tended to increase comparedwith rats fed a normal diet. In rats receiving a high-fructose diet, the lowering of uric acid improved features of metabolic syndrome. The administration of allopurinol prophylactically prevented fructose-induced hyperinsulinemia, systolic hypertension, hypertriglyceridemia and weight gain. As compared with the effects of the 60% dextrose and 60%fructose diets on the development of metabolic syndrome, only the fructose-fed rats developed hyperuricemia, hypertriglyceridemia, and hyperinsulinemia, and these symptoms were significantly improved by lowering uric acid levels with benzbromarone, the uricosuric agent. The
authors concluded that fructose caused metabolic syndrome. Allopurinol that lowers serum uric acid was able to prevent and reverse features of metabolic syndrome in fructose-fed rats. They suggest that uric acid may also have a contributory role in the development of metabolic syndrome induced by fructose.
Jürgens et al. (2005) assessed if and how fructose maypromote obesity in an animal model. Studies were performed in three month-old male adult mice. Mice were assigned to four groups (n = 8 to 9), with similar mean body weight among the groups. Water, fructose dissolved in water, a sucrose-sweetened soft drink, or a non-caloric "diet" soft drink was given for 73 days. They chose the concentration of fructosedissolved in water as 15% to be similar tothe highest amount of fructose in U.S. brands of fructose-sweetenedsoft drinks, which are higher than the European soft drinks because of the use of HFCS instead of sucrose. A standard diet was accessible ad libitum. Allfour groups of mice significantly gained body fat and weight during the study period but the fructose group gained more compared to the other groups. Body weight in the soft drink groupand the diet soft drink group did not change significantly comparedwith the water control group.
Davail et al. (2005) assessed the effect of partial replacement of dietary glucose provided by corn starch with fructose on body weight and fatty liver production in three groups of 30 Mule ducks. From hatching day to six weeks of age, they were fed on a diet providing 200 g protein and 12,200 kj/kg ad libitum. From six to twelve weeks of age, birds were given a restricted diet providing 182 g protein and 11,500 kj /kg to avoid excess fatness. The following eight days corresponded to the period before the overfeeding period, during
which the amount of food was progressively increased up to 380 g a day. Ducks were then overfed twice a day for two weeks with a mixture of grain, corn mash and water, supplemented with 9,800 kj in the form of glucose (control animals), sucrose or high fructose corn syrup (HFCS) solutions. The two-week overfeeding with these three substances (glucose, HFCS or sucrose) led to a significant body weight gain (41.7%, 45.7% and 44.7%, respectively). At the end of overfeeding, body weights in the three groups were similar, but liver weight was significantly higher in ducks overfed with food supplemented with HFCS or sucrose than in the glucose group. Postprandial plasma insulin concentrations were similar in all of the three groups. The authors concluded that the dietary fructose, by increasing hepatic lipogenesis, leads to liver steatosis and also that this effect of fructose on liver steatosis is not mediated by insulin.
Suga et al. (2000) examined the influence of dietary fructose and glucose on circulating leptin levels in sham-operated lean and ventromedial hypothalamic (VMH)-lesionedobese rats. They used female rats (n=92) that were divided into three groups, the Standard diet group, Fructose diet group and Glucose diet group, and given free access to food and water for a two week period of time. The food intake of rats with VMH lesions fed normal rations was increased twofold compared with that of sham-operated rats. Fructose or glucose feeding slightly increased the amountof food intake in sham-operated rats but not in VMH-lesioned rats.The VMH-lesioned rats gained body weight at rates fourfold higher and had two times the increased parametrial fat-pad weight comparedwith sham-operated rats. Fructose or glucose feeding tended tosuppress body weight gain in sham-operated rats, yet it did not reach statistical significance. In VMH-lesioned rats,neither fructose nor glucose feeding affected body weight gainor fat-pad weight. Plasma leptin concentrations were increased six times in VMH-lesioned rats fed normal food compared with lean rats.
Fructose feeding did not affect leptin levels in either of the two groups. Glucose feeding increased plasma leptin levels 2.4 fold in lean rats but not in VMH-lesioned rats. The authors concluded that hyperleptinemia in VMH-lesioned rats is related with increased adiposity and hyperinsulinemia but not with insulin resistance .Dietary fructose did not change leptin levels, suggesting that hyperinsulinemia compensated for insulin resistance does not stimulate leptin production.
Kasim-Karakas et al. (1996) evaluated the effects of diets containing 60% fructose or sucrose on glucose and lipid metabolism in hamsters. The authors used the male golden Syrian hamsters. They were separated into three groups (n=6-8): control group, fructose group and sucrose group. The hamsters received these diets for two weeks. Control and sucrose-fed animals had similar daily food intakes, whereas fructose-fed hamsters ate significantly more. The body weight of the fructose-fed animals was higher than that in controls and sucrose-fed animals. Both fructose and sucrose feedings increased the relative adiposity in the hamster but did not alter the fasting plasma glucose level. Fasting insulin was higher in the fructose group than in the sucrose group and control group. Glucose levels during the glucose tolerance test were higher in fructose-fed animals than in both other groups. Fructose-fed hamsters had higher plasma insulin levels than sucrose-fed hamsters and control hamsters, and also had higher non-esterified fatty acid and fasting plasma triglyceride levels than other groups. In all, fructose-fed animals consumed larger amounts of food and gained more weight than animals in the other groups. The authors concluded that fructose induces obesity, hyperinsulinemia and hypertiglyceridemia in hamsters.
Rawana et al. (1993) examined whether drinking fructose or glucose water with a balanced diet affects pregnant and lactating rats and their litters. The 60 female rats were divided into three groups with 20 rats per group. All groups consumed the same food but different water (tap water, 100 g/L glucose water or 100 g/L fructose water). Throughout pregnancy, body weights were similar in all groups. During lactation, the fructose-fed group gained significantly more weight than other groups. During gestation, the control group had significantly greater food intake, lower water intake and higher energy intake from others. The respective groups consumed a significantly greater amount of glucose water than fructose water, and the energy intake from water was significantly higher for the glucose water group than for the fructose-fed group. During lactation, food intake was significantly lower in the glucose water group, but its water intake was significantly greater than intakes of the other two groups. The dams ingesting glucose water consumed more energy from their water than dams that drank fructose water. Dams in the fructose-fed and glucose-fed groups consumed significantly less energy from food than the control group. On day 19 of pregnancy, plasma glucose concentration was significantly greater in the group consuming fructose water than in the group consuming tap water. After weaning, the fructose-fed and glucose-fed groups had significantly higher plasma glucose concentrations than did the group consuming tap water. The fructose-fed group had the highest plasma triglyceride concentration on day 19 of pregnancy. After weaning, the fructose- and tap water-fed groups had significantly higher plasma triglyceride concentrations than the glucose-fed group. The authors suggest that these observations could be the result of insulin resistance and the type of carbohydrate ingested may be responsible for this insulin resistance.
Rizkalla et al. (1992) evaluated the long-term effects of fructose feeding with normal or high amounts of Cu on body weight. Forty male rats aged 21 days were used. The rats were randomized into five groups, each consisting of eight rats. The rats in four groups were fed a powder diet containing 570 g carbohydrate/kg supplied either as corn starch (S), dextrose (D), fructose (F), or fructose-starch (FS) and an adequate amount of copper. The fifth group was fed a 570 g fructose/kg diet supplemented with twice the amount of Cu (FCu).
The rats fed on diets D and FS almost always gained more weight than those fed on diets S, F and F/Cu. These differences were significant until Week 6, after which this significance started to decline. The total food intake was significantly higher in the rats fed on diet D than in those fed on diets S, F, FS and FCu. At the end of Week 10, neither body weights nor weight gain were different, whereas epididymal fat pads increased in weight in groups F and FCu compared with groups S and FS. When the results were expressed as relative weight, groups F and FCu remained higher than groups S and FS. Fat deposition in the groups fed on fructose-rich diets was related to an increase in the number of adipocytes. The kidneys increased in weight in all of the fructose-fed groups compared with group S, but only in the high fructose groups (F and FCu) compared with group D. The authors concluded that a high fructose diet in rats over 10 weeks resulted in harmful effects on adipose tissue, insulin binding to adipocyte and plasma insulin. However, moderate fructose intakes are unlikely to have adverse effects.
Kanarek et al. (1982) examined if the type of carbohydrate could affect weight gain in rats. Thirty-five male rats were divided in five groups: glucose group, fructose group, sucrose group, granulated sucrose group and standard diet group. The rats were given the diets for
fifty days. Rats given the sucrose solution had the highest daily caloric intake followed by animals given the fructose solution and then those given the glucose solution. Animals provided with access to the sucrose solution consumed more sugar than animals in the other groups. The glucose group rats consumed more sugar than animals given either the fructose solution or granulated sucrose. Rats given the fructose solution consumed more stock diet than animals in the other three groups. Differences in weight gain were not significant but animals in the fructose and sucrose groups gained the most weight. After calculating daily weight gain as a function of caloric intake, it was concluded that rats given granulated sucrose gained the most weight, followed by animals in the fructose group, sucrose group, glucose group and animals given only the standard diet. The fructose group had higher serum triglyceride levels than others. Rats given one of the three sugar solutions consumed approximately 15% more calories per day than animals given the standard diet. The authors concluded that animals given fructose chose a smaller amount of their calories as sugar than did animals given either sucrose or glucose and also these rats had higher triglyceride levels than others.
Zavaroni et al. (1980) evaluated the effect of fructose on insulin secretion and insulin resistances in rats. Eighty-three Sprague-Dawley male rats weighing between 160-180 g were divided into two groups: animals (n=44) with a diet consisting of 66% fructose, 22% casein and 12% fat, and animals (n=39) with standard rat chow, consisting of 60% vegetable starch, 29% animal protein and 11% fat. These two diets were given for seven days. During the first three days, the weight gain was slower in the fructose group than in the control group (3.15 ± 0.3 g/d and 7.47 ± 0.21 g/d, respectively). On the contrary, during the next four days, the weight gain was similar for the two groups (7.36 ± 0.17 g/d and
7.22 ± 0.24 g/d, respectively). The authors concluded that fructose feeding for seven days resulted in an increase in the insulin response and a loss of normal insulin sensitivity.
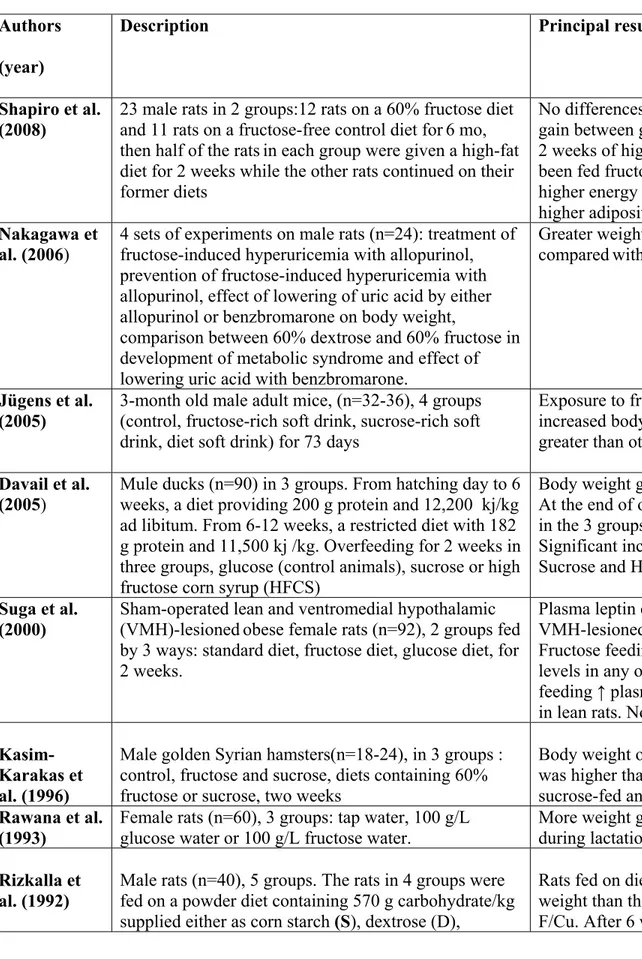
Table 1: Summary of animal studies
Authors (year)
Description Principal result
Shapiro et al.
(2008) 23 male rats in 2 groups:12 rats on a 60% fructose diet and 11 rats on a fructose-free control diet for6 mo, then half of the ratsin each group were given a high-fat diet for 2 weeks while the other rats continued on their former diets
No differences in food intake or weight gain between groups after 6 mos. After 2 weeks of high-fat diet, rats that had been fed fructoseshowed a significantly higher energy intake, weight gain and higher adiposity
Nakagawa et
al. (2006) 4 sets of experiments on male rats (n=24): treatment of fructose-induced hyperuricemia with allopurinol, prevention of fructose-induced hyperuricemia with allopurinol, effect of lowering of uric acid by either allopurinol or benzbromarone on body weight,
comparison between 60% dextrose and 60% fructose in development of metabolic syndrome and effect of lowering uric acid with benzbromarone.
Greater weight gain in fructose-fed rats comparedwith rats fed normal diet
Jügens et al. (2005)
3-month old male adult mice, (n=32-36), 4 groups (control, fructose-rich soft drink, sucrose-rich soft drink, diet soft drink) for 73 days
Exposure to fructose significantly increased body weight & adiposity greater than other groups.
Davail et al. (2005)
Mule ducks (n=90) in 3 groups. From hatching day to 6 weeks, a diet providing 200 g protein and 12,200 kj/kg ad libitum. From 6-12 weeks, a restricted diet with 182 g protein and 11,500 kj /kg. Overfeeding for 2 weeks in three groups, glucose (control animals), sucrose or high fructose corn syrup (HFCS)
Body weight gain during overfeeding. At the end of overfeeding, body weights in the 3 groups were similar.
Significant increased liver weight in Sucrose and HFCS groups
Suga et al. (2000)
Sham-operated lean and ventromedial hypothalamic (VMH)-lesionedobese female rats (n=92), 2 groups fed by 3 ways: standard diet, fructose diet, glucose diet, for 2 weeks.
Plasma leptin concentrations ↑ 6-fold in VMH-lesioned rats fed normal food. Fructose feeding did not affect leptin levels in any of 2 groups. Glucose feeding ↑ plasma leptin levels 2.4-fold in lean rats. No effect on weight gain.
Kasim-Karakas et al. (1996)
Male golden Syrian hamsters(n=18-24), in 3 groups : control, fructose and sucrose, diets containing 60% fructose or sucrose, two weeks
Body weight of the fructose-fed animals was higher than those of controls and sucrose-fed animals
Rawana et al. (1993)
Female rats (n=60), 3 groups: tap water, 100 g/L glucose water or 100 g/L fructose water.
More weight gain in fructose-fed group during lactation.
Rizkalla et al. (1992)
Male rats (n=40), 5 groups. The rats in 4 groups were fed on a powder diet containing 570 g carbohydrate/kg supplied either as corn starch (S), dextrose (D),
Rats fed on diets D and FS gained more weight than those fed on diets S, F and F/Cu. After 6 weeks, the significance
In summary (Table 1), some of studies found the association between fructose and weight gain. Shapiro et al. (2008) showed that chronic fructosefeeding induces leptin resistance, which in turn could predisposerats to increased weight gain in response to a high-fat diet. Nakagawa et al. (2006) showed a weight gain in fructose-fed rats comparedwith rats fed a normal diet. In the study of Jügens et al. (2005), providing mice with fructose-sweetened beverages resultedin an increase in body weight. Kasim-Karakas et al. (1996) found that body weights of the fructose-fed hamsters were higher than those of controls and sucrose-fed animals. Rawana et al. (1993) showed that an intake of fructose during gestation can cause, at weaning, greater weight gain in dams.
Other studies did not find this association including Suga et al. (2000) that didn’t find an effect of fructose on weight gain in rats. Rizkalla et al. (1992) didn’t find a significant effect of fructose on body weight in rats. Kanarek et al. (1982) didn’t find significant weight gain in rats fed fructose compared to other groups (i.e. glucose, sucrose, granulated sucrose and standard diet group), but rats in the fructose and sucrose groups gained the most weight. Zavaroni et al. (1980) didn’t find any effect of fructose on weight gain in rats.
fructose (F), or fructose-starch (FS) and an adequate amount of copper. The 5th group was fed on 570g fructose/kg diet supplemented with twice the amount of Cu (FCu).
started to decline.
Kanarek et al. (1982)
Male rats (n=35), 5 groups. Glucose, fructose, sucrose, granulated sucrose and standard diet group, 50 days.
Differences in weight gain were not significant but rats in the fructose and sucrose groups gained the most weight Zavaroni et
al. (1980)
Male rats (n=83), 2 groups. Diet consisting of 66% fructose, 22% casein and 12% fat and animals with standard rat chow consisting of 60% vegetable starch, 29% animal protein and 11% fat for 7 days.
In the first 3 days the weight gain was slower in fructose group. In the following days, the weight gain was similar for the 2 groups.
Animal studies seem therefore quite consistent in demonstrating a potential effect of fructose in promoting weight gain and metabolically related parameters in various experimental conditions.
2.5.2 Evidence from human studies
The studies are presented by reverse chronological order in each of three categories: clinical studies, cohort studies and cross-sectional studies.
2.5.2.1 Clinical studies
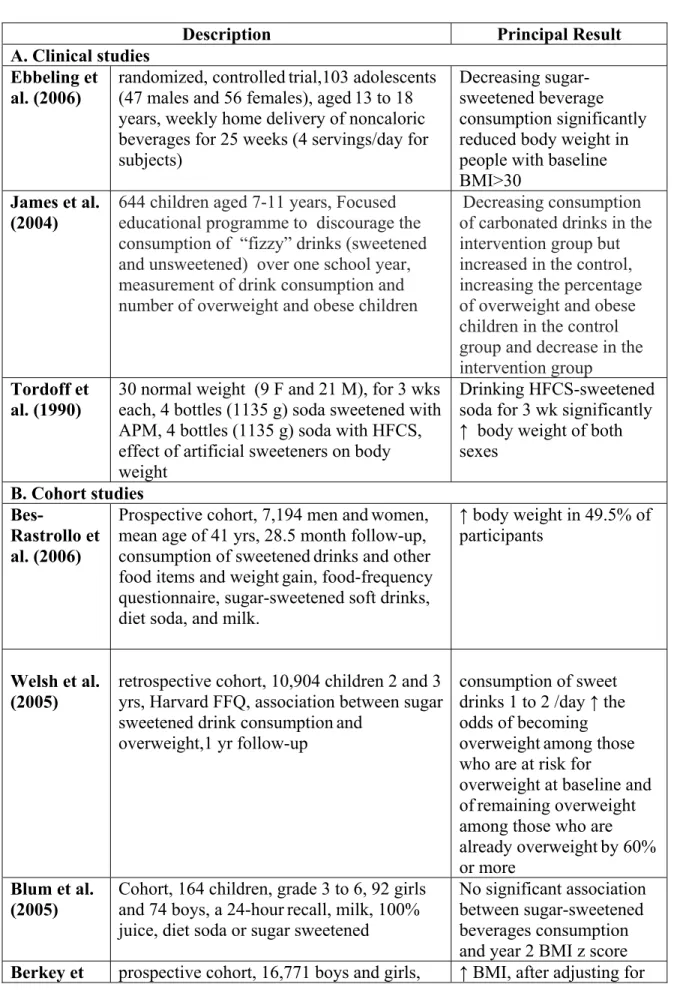
Ebbeling et al. (2006) in a randomized, controlledtrial evaluated the effect of diminishing sugar-sweetened beverages (SSBs) consumptionon body weight. The subjects were 103 adolescents (47 males and 56 females), aged13 to 18 years who reported the consumption of at least 1 serving (360 ml or 12 fl oz) of SSBs daily. Subjects were divided into intervention and control groups. During 25 weeks, the intervention group had home deliveries of non-caloricbeverages. They received 4 servings per dayeach week. Subjects in the control group continued their usualbeverage consumption habits during the 25-week interventionperiod. Consumption of SSBs decreased by 82% in the interventiongroup and did not change in the control group. The change in BMI was 0.07 ± 0.14 kg/m2 (mean± SE) for the intervention group and 0.21 ± 0.15 kg/m2 for the control group. The net difference, adjusted for gender and age, was –0.14 ± 0.21 kg/m2, and not significant overall. However, baselineBMI was a significant effect modifier. Among the subjects in the upper baseline-BMI tertile, BMI change differed significantlybetween the intervention
and control groups. The authors found that the interaction between weight change and baseline BMI was not attributable to baseline consumptionof SSBs. They suggested that decreasing sugar sweetened beverages consumption had a valuable effecton body weight for individuals with higher baseline BMI.
James et al. (2004) examined the effect of an educational program with the aim of reducing intake of carbonated drinks on preventing excessive weight gain in children. The subjects were 644 children aged 7-11 years in six primary schools in southwest England. Their intervention plan was a focused on nutrition over one school year with the objective to discourage the consumption of “fizzy” drinks (sweetened and unsweetened) with positive affirmation of a balanced healthy diet. Anthropometric measurements were taken at intervals of six months. They obtained diaries at baseline and at the end of the trial on drinks consumed over three days. Records were made over two weekdays and one weekend day. They found that the intake of carbonated drinks over three days decreased by 0.6 glasses (average glass size 250 ml) in the intervention group but increased by 0.2 glasses in the control group (mean difference 0.7, 95% confidence interval 0.1 to 1.3). The percentage of overweight and obese children increased in the control group by 7.5% in comparison to a decrease in the intervention group of 0.2% (mean difference 7.7%, 95% CI 2.2% to 13.1%) at the end of one year. The authors concluded that their school based educational program with the purpose of reducing consumption of carbonated drinks to prevent excessive weight gain in children aged 7 to 11 years old was effective.
Tordoff et al. (1990) studied if artificial sweeteners have an effect in the control of long- termfood intake and body weight. The subjects were 30 normal weight persons (9 females and 21 males).Each subject maintained a dietary record for nine weeks. During this period
they received, for 3 weeks each, four bottles (1135 g) of soda sweetened with aspartame (APM), four bottles (1135 g) of soda sweetened with high-fructose corn syrup (HFCS), or no experimental drinks. Subjects gained significantly more weight after three weeks of drinking HFCS-sweetened soda than after the same period drinking APM-sweetened soda or no experimental soda. To compare with when no soda was given, drinking APM-sweetened soda for three weeks significantly reduced calorie intake of both sexes and decreased the body weight of males but not offemales. Drinking HFCS-sweetened soda for three weeks significantly increased the calorie intake of both sexe. The authors concluded that consumption of HFCS-sweetened soda increased both calorie intake and body weight in normal weight subjects.
2.5.2.2 Cohort studies
Bes-Rastrollo et al. (2006) assessed whether the consumption of sweetened drinks and other food items increased the risk of weightgain in a Mediterranean population. This was a prospective cohort analysis of 7,194 men andwomen with a mean age of 41 years who were followed-up for a median of 28.5 months with mailed questionnaires. Dietary exposure wasassessed with a semi-quantitative food-frequencyquestionnaire for the sugar-sweetened soft drinks, diet soda, and milk. During the follow-up they observed that 49.5% of the participantsincreased their weight. In the participants who hadgained 3 kg in the five years before the baseline, the adjusted odds ratioof subsequent weight gain for the fifth quintile compared withthe first quintile of sugar-sweetened soft drink consumption was 1.6 (95% CI: 1.2, 2.1). They did not find this relationshipin the participants who had not gained weight inthe five year period before baseline. The consumption of hamburgers, pizza, and sausages (as a proxy for fast-food consumption) was also independently
associated with weight. The authors also found a significant, but weaker, association between weight gain and both red meatand sweetened fruit juice consumption. The authors observed that the association that they found was only evident in the subjects who reported a prior weight gain.
Welsh et al. (2005) examined the association between sweet drink consumption and overweight conditions among preschool children in a retrospective cohort study with 10,904 children who were aged two and three years. The data of these children was collected between January 1999 and December 2001 with the Harvard Service Food Frequency Questionnaire. Height and weight data was collected one year later. They evaluated sweet drinks as all sugar-sweetened and naturally sweet drinks listed on the HFFQ: "vitamin C juice," "other juices," "fruit drinks”and "soda.” They adjustedfor age, gender, race/ethnicity,birth weight, and the intake of high-fat foods, sweet foods, andtotal calories. For children who were normal or underweight at baseline, the relationship between sweet drink consumption and weight gain was positive but not significant. Children who were at risk for developing an overweight condition at baseline and who consumed1 to <2 drinks/day, 2 to <3 drinks/day, and 3 drinks/daywere, respectively, 2.0 (95% CI: 1.3–3.2), 2.0 (95% CI: 1.2–3.2), and 1.8 (95% CI: 1.1–2.8) times at risk to become overweight as the referent (<1 drink/day). Relative risk for children who were overweight at baseline and consumed 1 to <2 drinks/day, 2 to <3 drinks/day, and 3 drinks/day were, respectively, 2.1, 2.2, and 1.8 timesas likely to remain overweight as the referent. The authors suggested that one approach to manage and control the weight of preschool children could be to reduce sweet drink consumption.
Blum et al. (2005) evaluated changes in beverage consumption and relations between beverages consumedand BMI Z-score in children in grades 3 through 6 (n = 164) across two years. The sample consisted of 92girls and 74 boys. They obtained data on beverage consumption (milk, 100% juice, diet soda or sugar sweetened)using a 24-hour dietrecall. Subjects were categorized as normal weight, overweight,gained weight and lost weight. They found significant decreases in milk and increases in dietsoda over two years in all subjects. Change in milk consumption was inversely correlated with sugar-sweetened beverage consumption. Increases in diet soda consumption were significantly larger for overweight and subjects who gainedweight in comparison to normal weight subjects. The authors concluded that changes in beverage consumption were found in thisstudy during two years. Only diet soda consumption was associated with year 2 BMI Z-score, and consumption was greater in overweight subjects and subjects who gained weight as compared to normal weight subjects at twoyears. No association was found with sugar sweetened beverages .
Berkey et al. (2004) evaluated therelationship between intakes of sugar-addedbeverages, milk, fruit juices, and diet soda and changes in body mass index. This prospective cohort studyincluded 16,771 boys and girls. The participants were 9 to 14 yearsold in 1996. They completed questionnaires in 1996, 1997 and 1998. The data was gathered using a self-administered semi-quantitative food frequency questionnaire for youth. The beverages they studied were sugar-added beverages, fruit juices, diet soda, and milk. They asked about physical activity, race/ethnicity, tanner stage and menarche. In cross-sectional results, older children drank less milk but more orange juice, soda,iced tea, and punch than younger children. Boys reportedhigher energy intakes and drank more milk, punch, orange juice, and soda than same-age girls. At baseline, children whodrank more milk and less diet soda
were leaner, whereas girlswho drank more sugar-added beverages were heavier. Diet soda intakes were not associated with higher total energyintakes. Per serving effects for sugar-added beverages and fruit juice intakes were larger than their own energy contents. In longitudinal results,consumption of sugar-added beverages was associated with small BMI gains during the corresponding year. Girls who drank one serving per day of sugar-added beverages gained significantly more weight than girls drinking none, as did girls drinking two servings per day or over three servings per day. Boys who increased consumption of sugar-added beverages from the prior year had weight gain. Children who increased intakes by two or more servings per day from the prior year gained weight. After adjusting for total energy intake, the estimated effects were reduced and were no longer significant. The authors concluded that the consumption of sugar added beverages could have a role in weight gain among adolescents probably by virtue of their contribution to total energy intake, seeing that adjustment for calories greatly weakened the estimated associations.
Schulze et al. (2004) examined the association between consumptionof sugar-sweetened beverages, weight change and risk of Type2 diabetes. This study was a prospective cohort analysesconducted from 1991 to 1999. They had 116,671 female U.S. nurses aged 24 to 44 years at study initiation in 1989. The diabetes analysis included 91,249 women free of diabetes and other major chronic diseases at baseline in1991. The weight change analysis consisted of 51,603 womenfor whom there were records of complete dietary information and body weight in 1991, 1995, and 1999. The data was collected with a 133-item semi-quantitative food frequency questionnaire. They evaluated sugar-sweetened soft drinks, fruit juice, fruit punch, and dietsoft drinks. The persons with steady eating patterns had no difference in weight gain. Weight gain was highest among women who increased their sugar-sweetenedsoft drink consumption from one or fewer drinks per week to oneor more
drinks per day for both periods, 1991 to 1995 and 1995 to 1999, and was smallestamong women who decreased their intake after adjustment for confounders. Increased drinking of fruit punch and fruit juice was also associated with larger weight gain compared with decreased consumption. The authors commented that there is a positive relationship between sugar-sweetened beverages consumption and the risk of obesity and type 2 diabetes, and that effect may be due to the low satiety of liquids.
Ludwig et al. (2001) examined the relationship between the consumption of sugar-sweetened drinks and obesity in children. They obtained the data from the Planet Health intervention and project evaluation that was done in schools in four communities in the U.S. They enrolled children from five randomly assigned control schools that were not in the intervention program. A total of 780 children completed the baseline evaluation in October, 1995. Follow-up data was obtained in May, 1997, for 84% (654) of the baseline sample. After exclusion of children with implausible daily energy intakes, a cohort of 548 individuals with a mean age 7 to 11 years was remaining. The primary hypotheses were that the baseline and changes in consumption of sugar-sweetened drinks could predict a rise or fall in BMI over two academic years. The youth food-frequency questionnaire (YFFQ) was used to assess the average intake of drinks, percentage energy intake from dietary fat, and total energy intake. Sugar-sweetened drink consumption was calculated from responses to the YFFQ. Intake of sugar-sweetened drinks increased from baseline to follow-up: only 38 (7%) children showed no change in sugar-sweetened drink intake while 57% (312) showed increased intake, with a quarter drinking more than one extra serving daily. BMI for each serving per day and additional serving increased in the baseline. In the fully adjusted model, the odds of becoming obese increased 1.6 times (95% CI, 1.14-2.24) for each additional daily serving of sugar-sweetened drink. The authors concluded that the
consumption of sugar-sweetened soft drinks is related with weight gain in children probably for the reason of inadequate compensation for energy consumed in liquid form.
2.5.2.3 Cross-sectional studies
Ariza, et al. (2004) evaluated the prevalence of and possible risk factors for overweight in
a sample of 250 (123 girls, 127 boys), 5- to 6-year-old Hispanic children in Chicago,
Illinois. Data were collected at school during September–November 1996. They obtained
data about demography, acculturation, infant and toddler feeding practices, current eating patterns and food preparation habits, physical activity, and psychosocial family
characteristics. They asked about current eating and food preparation habits with 12
questions on food purchases, food preparation styles, and frequency of consumption of commonly used foods and beverages. They found that overweight children made up 23% of the sample and these children were significantly more likely than non-overweight children to watch television for more than 3 hours during weekend days and to consume
sweetened beverages (powdered drinks, soda pop, atole) daily. Children with daily
consumption of sweetened beverages were more likely to be overweight than those with less-than-daily consumption of sweetened beverages (adjusted odds ratio 3.7, 95% CI 1.2– 11.0).
Forshee et al. (2004) studied the relative importance of demographics, beverage consumption, physical activity, and sedentary behaviour for maintaining a healthy body weight. They used data from the third National Health and Nutrition Examination Survey 1988-/1994 on 2,216 adolescent males and females aged 12- 16 years. Dietary data were collected using both a food frequency questionnaire (FFQ) and a one-day 24-h dietary
recall (24HR). Using the 24HR, males 12-16 years old consumed a mean of 524.4 g/day of regular carbonated soft drink (RCSD) while females 12-16 years old consumed a mean of 346.8 g/day of RCSD. The results from the FFQ were slightly lower. They found a positive non significant association between soda consumption and body mass index and an inverse non significant relationship between fruit drinks consumption and body mass index. RCSD consumption was not statistically significant in any of the models. They suggested that changes in RCSD consumption produce only small changes in predicted BMI.
Gillis et al. (2003) studied if particular foods maybe associated with obesity in children and adolescents and attempted todetermine the effect of consuming food away from home (FAFH)on the nutritional quality of their diets. Subjects were 181 children and adolescents 4-16 years old and were observed over the year 2001. They were divided into two groups, one defined as obese (n=91) and the other as non-obese (n=90). The data regarding dietary history included a 24-hour recalland a modifiedfood frequency questionnaire (FFQ). The obese group consumed significantlymore servings of meat and alternatives, grain products, FAFH, sugar-sweetened drinks and potato chips compared to the non-obese group. Consumption of sugar-sweetened drinks was only significantly greater in boys. There were significant positive correlations betweenpercent body fat with consumption of meat and alternatives, sugar sweetened drinks and FAFH and significant negative correlations betweenpercent body fat and consumption of cheese and fruit including fruit juice. The authors concluded that obese children and adolescents consume more FAFH and sugar-sweetened beverages than non-obese ones which correlates positively with body fatness.
Giammattei et al. (2003) determined the prevalence of obesity amongstudents and studied lifestyle parameters related to obesity. The subjects were 385 sixth and seventh grade
students (186boys and 199 girls) from three schools. Their ages were from 11 to just under 14 years. They obtained data about health behaviors and the number of regular and diet soft drinks being consumed by the subjects each day. 17.9% of subjects had a BMI between the 85th and95th percentiles, and 17.4% had a BMI above the 95th percentile. These rates were higher among Latino students and lower among Asian students, as compared with non-Hispanic white students. They found significant associations between BMI and hours of television watched per day and daily soft drink consumption. The students who drank three or more soft drinks per day had a BMI z score that was 0.51 higher (95% CI, 0.17 to 0.85) and also had 4.4% more body fat. These students were more likely to havea BMI at or above the 85th percentile than those who consumedfewer than three soft drinks per day. The authors also observed a significant relationship between television watching and soft drink consumption with weight gain. They suggest that it is not the calories in the drinks that are responsible for this association because diet soft drinks also had this association with obesity.
Nicklas et al. (2003) examined the relationship between eating patterns and overweight conditions in children who participated in the Bogalusa Heart Study. The data was collected with a single 24-hour dietary recall in a sample of 1,562 ten-year-old children over was a 21 year period. They considered having a body mass index greater than the 85th percentile using Centers for Disease Control and Prevention reference standards as overweight. They adjusted for energy, age, study year, ethnicity, and sex. The authors found that the consumption of sweetened beverages (58% soft drinks, 20% fruit flavored drinks, 19% tea, and 3% coffee), sweets, and meats was positively associated with weight gain. They concluded that numerous eating patterns were associated with an overweight condition.
Liebman et al. (2003) assessed the relationship between different lifestyle variables and body mass index (BMI). They used baseline cross-sectional data from the “Wellness IN the Rockies” project. The subjects consisted of 928 males and 889 females, aged from 18 to 99 years from six rural communities in Wyoming, Montana, and Idaho (USA). The data was gathered with a questionnaire that consisted of sociodemographic information, self-reported height and weight, and data related to specific dietary intakes, like the individual's frequency of consumption of sweetened beverages, fruits and vegetables, milk, and whole grains, eating-related behaviors, and physical activity. They adjusted for confounding variables such as age, gender, race, and level of education. Prevalence of overweight conditions was 70% in men and 59% in women. The authors found that an increased probability of being overweight or obese was associated with greater frequency of drinking sweetened beverages such as soft drinks/soda pop, ordering supersized portions, eating while doing other activities, and watching television.