CIRPÉE
Centre interuniversitaire sur le risque, les politiques économiques et l’emploi
Cahier de recherche/Working Paper 06-36
Impact of Early Childhood Care and Education on Children’s
Preschool Cognitive Development: Canadian Results from a Large
Quasi-experiment
Pierre Lefebvre
Philip Merrigan
Matthieu Verstraete
Octobre/October 2006
___________________
Lefebvre: (address for correspondence) CIRPÉE and Department of Economics, UQAM, CP 8888, Succ. Centre- Ville, Montréal, QC Canada H3C 3P8; Tel.: 514-987-3000 #8373; Fax: 514-987-8494
lefebvre.pierre@uqam.ca
Merrigan: CIRPÉE and Department of Economics, UQAM Verstraete: Department of Economics, UQAM
The analysis is based on Statistics Canada’s National Longitudinal Survey of Children and Youth (NLSCY) restricted-access Microdata Files, which contain anonymized data collected in the NLSCY and are available at the Québec Inter-university Centre for Social Statistics (QICSS), one of the Canadian Research Data Centres network. All computations on these micro-data were prepared by the authors who assume the responsibility for the use and interpretation of these data. This research was funded by the Social Sciences and Humanities Research Council of Canada, the Fonds québécois de la recherche sur la société et la culture and CIRANO.
Abstract:
On September 1
st1997, a new early childhood care and education policy was
initiated by the provincial government of Québec, the second most populous province
in Canada. Providers of childcare services licensed by the Department of the Family
began offering daycare spaces at the reduced parental contribution of $5 per day per
child for children aged 4. In successive years, the government reduced the age
requirement and engaged in a plan to create new childcare facilities and pay for the
cost of additional $5 per day childcare spaces. By September 2000, the low-fee
policy applied to all children aged 0 to 59 months and the number of partly subsidized
spaces increased from 77,000 in 1998 to 170,000 spaces, totally subsidized, by
midyear 2003. In addition, on September 1
st1997, all public schools offered full-day
rather than part-day kindergarten for 5-year-old children. No such important policy
changes for preschool (including kindergarten) children were enacted in the other
Canadian provinces over the years 1994 to 2003. Using biennial data drawn from
Statistics Canada’s National Longitudinal Survey of Children and Youth (NLSCY),
conducted since 1994-1995, this study attempts to estimate the effect of the policy on
Québec’s preschool children cognitive test scores. A non-experimental evaluation
framework based on multiple pre- and post-treatment periods is used to estimate the
effect of the early childhood care and education regime on school readiness. The
econometric results support the hypothesis that the policy had no effects on the
cognitive development of 4-year-olds (the PPVT-R raw scores and the PPVT-R
standardized scores). However, we provide evidence that the policy had a substantial
negative impact on the scores of 5-year-olds.
Keywords: preschool children, school readiness, childcare, kindergarten, treatment
effects, natural experiment
The relationship between early childhood education and care (ECEC) and the developmental outcomes of children has been widely studied from a variety of perspectives. One strand investigates the potential benefits of early intervention childcare and/or remedial/compensatory education programs (see for literature reviews Barnett, 1995; Karoly et al. 1998; Carneiro and Heckman, 2003; Currie, 2001; Blau and Currie, 2006; Love et al., 2005). Another examines the effects of maternal employment and childcare during preschool years (see the review of Walfogel, 2002) on developmental outcomes. More recently, researchers have documented the forms of ECEC and their usage (such as parental and informal, center-based or preschool, pre-kindergarten and kindergarten) with the help of new data sets (e.g. NICHD/Early Childcare Initiative and the American Child Newborn and Kindergarten Cohorts Surveys) (see the review of Magnuson and Waldfogel, 2005).
These studies can be divided into two main types. The first, produced almost entirely in the United States, are based on the experimental evaluation of ‘model’ or demonstration programs. The second types are quasi-experimental and observational studies, some of them based on longitudinal data. Although these studies are diverse in terms of period under study, samples and control groups, conceptual and analytical methods, chosen and array of covariates, and treatment of omitted variables, heterogeneity or selection problems, (see, Blau, 2003; Blau and Currie, 2006 for a discussion of some weaknesses), there is a growing body of evidence that some ECEC interventions can lead to both short and long term gains be they cognitive or non-cognitive (emotional outcomes or social skills). However, little has been learned about the relationship between ECEC and child outcomes in settings outside the United States (for this point see Waldfogel, 2002). This study presents results from a large scale “natural” experiment in Canada with particular relevance for the school readiness of older preschool children.
On September 1st 1997, the government of Québec implemented a new policy of daycare subsidies. From that day on, accredited childcare facilities offered subsidized daycare (the $5 per child per full-day fee policy) for children who were 4 years of age on September 30th 1997. The government also promised to progressively decrease (every year) the age requirement for subsidies and increase the number of subsidized $5 per day daycare spaces, targeting a number of 200,000 for 2006. By September 2000, the low-fee policy applied to all children aged 0 to 59 months (not in kindergarten) and the number of (partly subsidized) spaces increased from 77,000 (available in late 1997) to 170,000 spaces, totally subsidized, by midyear 2003, while the number of eligible children in Québec, zero to four years old, declined from 428,000 to 369,000 over the same period. Families’ childcare arrangements changed dramatically over time as the policy favoured regulated subsidized center-based care (as well as family-based care under the supervision of not-for-profit centers). This new childcare policy was integrated with other major changes in education policy including full-time publicly-provided kindergarten in a school setting replacing half-day publicly-provided kindergarten with $5 per half-day before- and after-school half-daycare for kindergarten-age
and grade-school children. No such important policy changes for preschool (including kindergarten) children were enacted in the other Canadian provinces over the years 1994 to 2003.
The policy pursued three major objectives: to fight poverty, to increase mothers’ participation in the labour market, and to enhance child development and equality of opportunity for children. These goals are not particular to Québec and have been pursued in several countries since the eighties as ECEC public policies have spearheaded family policy.1
Despite the large amount of public funds dedicated to this program (see Table 1 for the amount of public funds dedicated to childcare) – direct public subsidies to childcare providers increased from $209 million in fiscal year 1995-96 to $1.6 billion in year 2006-072 – very few studies (reviewed below) have examined whether the objectives have been reasonably met. Furthermore, because the previous federal government of Canada formed by the Liberal Party of Canada instituted a $5 billion transfer program aimed at provinces and Territories over five years (2005-2009) for the creation of daycare spaces at a reduced price, it is important to use the Québec experiment as a beacon to form expectations about the impact of the policy as well as anticipate the problems that could emerge if it becomes effective across Canada.3
The paper shows that Québec’s families ECEC arrangements have changed dramatically over time compared to the rest of Canada and answers the following questions using data from the first five waves of Statistics Canada’s National Longitudinal Survey of Children and Youth (NLSCY): Has the policy improved children’s school readiness in Québec? Has the policy diminished “social” gaps (e.g. gaps between children with a low-education mother and those with a well-educated mother) in school readiness? Has the policy increased hours children spend in daycare and if yes does the effect differ by the child’s age group? How does half-day pre/kindergarten in a school setting (the policy chosen by the Province of Ontario for 4- and 5-year-olds) compare with Québec’s system in terms of school readiness?
A non-experimental evaluation framework based on multiple pre- and post-treatment periods is used to estimate the policy effects. Québec’s preschool children (the treatment group) are compared with children of similar ages in the other provinces (or only with Ontario), the control groups, over several years. Two estimation approaches are used to measure the impact of the childcare policy in Québec:
1 The approach is similar to the ones adopted by several European countries. See OECD (2001) for a review of ECEC policies, and Blau and Currie (2006) for a larger discussion and a presentation of American initiatives in this domain.
2 The initial expenditures (school infrastructure, equipment, materials and hiring of new teachers) associated with the passage to full-time kindergarten has been estimated for the first year at 200 million dollars by the Department of Education).
3 In fact, the government was defeated in the January 2006 general election and the new minority government formed by the Conservative Party ended the program (for years 2007 to 2009) and replaced it with a taxable family allowance of $100 per month for each child aged 0 to 5 years. The Liberal party has promised to revert to their former childcare policy if returned to power by the voters.
difference-in-differences (DD) and difference-in-differences-in-differences (DDD). All models are estimated by ordinary least-squares (OLS) with appropriate adjustments for the standard error of program effects.
The econometric results support the hypothesis that the policy had no effects on the cognitive development of 4-year-old children (the PPVT-R raw scores and the PPVT-R standardized scores). However, we provide evidence that the policy had a substantial negative impact on the scores of 5-year- olds. We also show that the policy increased hours in daycare substantially for all age groups under 5. The results for sub-samples of children (with mothers with a high school education or less, or with a university degree) suggest that the policy slightly affected “social” gaps in school readiness. Finally, the results show that the program did not improve the lot of Québec’s children relatively to those of Ontario where free part-time pre/kindergarten is provided for both 4- and 5-year-olds.
The rest of the paper proceeds as follows: Section 1 reviews prior research evidence. Section 2 presents public policy pertaining to ECEC across Canada and traces the unique evolution of Québec in this regard. Section 3 identifies the conceptual issues and lays the framework for the econometric analysis. Section 4 describes the data set used to perform the analysis and presents descriptive statistics. Section 5 contains the empirical results and a discussion. Section 6 concludes with policy implications and identifies extensions for future research on this topic with Canadian data.
1. A review of previous research on ECEC
Experimental studies and intervention programs
Random-assignment experimental studies (the most often cited are based on American programs) are considered to offer gold standard estimates of ECEC intervention programs. These high-quality programs targeted towards disadvantaged populations and vulnerable children generally produced a positive effect (albeit sometimes modest or weak) on developmental outcomes, promoting school readiness and improved school performance. Evaluations that did follow children throughout childhood, adolescence or adulthood identified other positive effects (higher high-school graduation rates and diminished juvenile arrests). Interventions at younger ages appear to be conducive to larger effects by enhancing non-cognitive skills as well as fostering motivation. Initial advantages tend to weaken over time in the absence of continued and extended high quality support (Brooks-Gunn, 2003). It is worth emphasizing that all randomized experiments that produced longer term effects on behaviour, school-related achievement and subsequent earnings, shared the following features: (1) they started early in the child’s life; (2) were quite intensive; (3) were implemented over several years; (4) in many cases, they involved the child’s parents; (5) were staffed by highly qualified employees.
Observational Studies
There are many studies on the effects of maternal employment/early childcare and education on child development (cognitive, behavioural, socio-emotional, and health related). Few studies use longitudinal data and few have been able to control for the quality of daycare. We focus our survey on those using large data sets with extensive controls in the regression analysis.
1. Early childcare and maternal employment of children aged 0 to 2
There is a growing body of empirical results indicating that early childcare and maternal employment, especially during the first year of life, can have adverse effects on a child’s development. Using American data (the National Longitudinal Survey of Youth-NLSY) on children followed from birth to age 3 or 4 and 7 or 8, Waldfogel et al. (2002) and Hill et al. (2005) conclude that full-time employment for mothers (21h/week or more) compared with staying at home has a significant negative effect on verbal scores (PPVT), at ages 3 or 4, and on reading, math and an index of behavioural problems, at ages 7 or 8. Other studies by the authors, Brooks-Gunn et al. (2002), Hill et al. (2002), based on the National Institute of Child Health and Human Development (NICHD) Study of Early Childcare, emphasize that even after controlling for childcare quality and the quality of the home environment and maternal sensitivity maternal employment by the ninth month of the child’s life is associated with lower cognitive scores at age 3, as measured by a school-readiness test. The negative effects were found to be stronger when mothers started working 30 hours per week or more at the ninth month.
In the United Kingdom, Gregg et al. (2005) focus their analysis on the effects of maternal employment, during the first 18 months of life, on the cognitive development of children, as measured by a literacy score at age 7. They find that early full-time maternal employment is the most likely cause of poorer cognitive outcomes for children, though the effect is very small. On the contrary, early part-time employment is not found to be harmful.
As for the cognitive and behavioural outcomes of the 1- and 2-year-old children, there are less conclusive adverse effects associated with maternal employment and childcare. Using data from the NLSY survey, Ruhm (2004) notes that part-time work for children who are at least 1 year of age is associated with better cognitive outcomes later. Results suggest that an additional 20 hours per week of work, in the first three years of life, is a probable cause of adverse effects on reading and math for children of ages 5 and 6 (measured by the PIAT-R and -M). These results are more pronounced than those for verbal scores (the PPVT-R), measured two years earlier for the 3- and 4-year-olds. Moreover, the size of these adverse effects rises when the mother works 40 hours per week or more throughout the first three years of the child’s life. Ermisch and Francesconi (2000), using the British Household Longitudinal Panel, find a negative and significant effect of the mother’s full-time employment when the child is aged 0 to 5
on later educational attainment. The effects of part-time employment for mothers and the father’s employment are smaller and less well determined but again negative.
Although not explicitly studying the optimal age of entrance in daycare, O’Brien Caughy et al. (1994) emphasize two results using the NLSY and the reading scores (PIAT-R) of 5- and 6- year-old children: (1) initiating daycare before the first birthday leads to higher scores for poor children; (2) the opposite is true for affluent children. Thus, it seems that poor children stand the least to lose from not being in contact with their generally less “skilled” mothers as also shown in experimental studies such as Perry and Abecedarian. However, there is a potentially important quality mismatch for affluent children. For them, the quality differential between center-based care and the care the mother would have offered had she stayed home seems most acute. Furthermore, there appears to be a minimum age “requirement” before one’s child is placed in care, and preferably in center-based care. The aforementioned studies suggest this minimum age “requirement” varies between one and two years of age. Other studies show that quality of care (sensitivity, responsiveness of caregivers) as well as hours of work mediates behavioural problems (Brooks-Gunn et al., 2002; NICHD-ECCRN, 2003, 2005; Ruhm, 2004).
2. Preschool children aged 3 to 5 years and preschool programs
A clear new policy initiative observed for the last few years in the United States is the establishment of universal pre-kindergarten (pre-K) generally in a school setting and mostly part-time. There are few evaluations of the impact of this policy and the existing studies are not convincing from a methodological point of view (Gilliam and Zigler, 2001, 2004; Ripple et al., 1999).
The evaluation of Oklahoma’s universal pre-K program on children in public schools from Tulsa uses a good research design that provides evidence of the short-term benefits from preschool participation for those who choose to participate. Gormley and Gayer (2005) and Gormley et al. (2005) exploit the strict age eligibility of the Oklahoma program for their evaluation. In effect, the analysis compares outcomes for the oldest children just entering the pre-K program, who missed attending preschool a year earlier because their birthday fell after September 1st with their counterparts who are just old enough to attend kindergarten (birthdays before September 1st) and attended the preschool program in the prior year. They find significant positive effects on cognitive outcomes (letter-word identification, spelling and applied problems) for the group of 5-year-olds enrolled in pre-K the preceding year. When considering racial background and intensity of “care” (half-day vs. full-day), their results show that the positive effects are stronger for black children in full-day care. On the contrary, Hispanic and White children seem to benefit most from half-day pre-K, with generally stronger effects for the former.
Several studies use the American Early Childhood Longitudinal Study-Kindergarten cohort (ECLS-K) following a large number of children in kindergarten in the fall of 1998 to examine the effect of preschool attendance on outcomes prior to or at kindergarten entry and later in kindergarten. Although the
preschool settings they analyze are more loosely defined than in Gormley et al., Magnuson et al. (2004, 2005) study the effects of “educational” care at age 4 on subsequent reading and math preschool tests, and on behavioural scores as they are reported by kindergarten teachers. They find that measures of school readiness, as well as performance in kindergarten, are significantly higher for children who attended a center-based preschool program in the year prior to kindergarten entry although they conclude that “pre-K” participation has little long-lasting positive effects on children’s cognitive outcomes. Longer hours in all type of pre-school are associated with more behavioural problems that persist over time. However, the cognitive gains for disadvantaged children (whether defined by poverty status, low maternal education, single parent headship, or mothers who do not speak English) are larger and more lasting than for the whole sample.
Knowing that center-based care is generally of better quality, Loeb et al. (2005) try to determine the optimal age to make use of such an arrangement, and if so, how intensely it should be used (hours/week, months/year) using the same data set and methods as Magnuson et al. they assess both cognitive (by preschool tests in reading and mathematics) and non-cognitive outcomes of children (by an evaluation of the child’s kindergarten teacher). The results suggest that the most important cognitive gains are for children who entered center-based care between ages 2 and 3. In terms of behavioural measures, the effects of center-based care are more adverse the earlier the child enters care. However, for disadvantaged children, 30 hours per week of care for at least 9 months per year (intensive care) has little detrimental effects on their behaviour, while producing positive effects on their cognitive outcomes. In contrast, wealthier children’s cognitive development appears to benefit from care only if it is moderately intensive (between 15 to 30 hours per week for at least 9 months per year). Moreover, the authors observe that wealthier children display increasingly negative behaviours the longer they stay in care.
In the UK, a large-scale study following children (2-year-olds or more) attending preschool shows similar results (Sammons et al., 2002, 2003). At school entry they have better cognitive outcomes (pre-reading, early number, and language) and superior social and behavioural skills than their peers without pre-school experiences; longer pre-school attendance leads to higher cognitive gains when entering school; children who spent long hours in daycare from age 2 and as early as age 1 seemed more likely to have one or more behavioural problems; attending full-day rather than half-day preschool did not confer better cognitive skills, and the cognitive gains of attending preschool are larger for disadvantaged children.
3. Quality and effectiveness of care A transversal issue in all studies is the question of the
quality of childcare and preschool programs (as measured by structural and caregiver characteristics4 as
4 ‘Structural quality’ refers to characteristics of the childcare environment such as child-caregiver ratio, group size, caregiver education and experience, and staff turnover.
well as more process-oriented indicators5 of care giving and activities) which are related to child developmental outcomes (NICHD/ECCRN, 2005). Almost all data sets on young children do not measure process quality of care because of the difficulties associated with this enterprise (e.g. gathering on-site observations). Structural quality and process quality are related, but not entirely. It may be that structural quality is a necessary but not sufficient condition for process quality to be effective (Blau, 1999). Blau, analysing an American data set on childcare characteristics, concludes that structural quality is not found to consistently affect child outcomes whereas process quality seems to have small positive effects on cognitive outcomes, results also reported by Duncan (2003). In this latter study, which is part of the NICHD’s Study of Early Childcare, the size of the effect of an additional unit of “quality” is found to vary between .04 and .08 of one standard deviation of the cognitive development measure. Of particular interest is Duncan’s remark to the fact that the effect sizes are more pronounced for children who spent all, versus none, of their third and fourth years of life in center-based care. In this case, the effect size increases to a minimum of .09 and a maximum of .27 for cognitive outcomes. Moreover, center-based care is not found to have any significant impact on cognitive outcomes if it was initiated earlier in childhood. One of the important limitations of Duncan’s study is that there are few children observed in low quality care. Thus, his estimates could understate the true impact of process-quality on children’s outcomes. Finally, this study suggests that children with low initial cognitive skills may benefit the most from quality care.
4. Welfare and employment policies
It is reasonable to ask whether increased employment among poor families would achieve the same results as early childhood interventions such as high quality childcare or preschool programs. One of the main reasons given for increasing employment among welfare recipients is that generating self-sufficiency serves as an example for children growing up in low-income families while higher income can increase resources for children. Yet, is increased employment alone a potential way to enhance a child’s development? Morris et al. (2005) answer this question. Their results are based on seven random-assignment studies analyzing the effects of increased employment for welfare mothers on children’s schooling achievement for 13 employment-based welfare programs in the United States and in two Canadian provinces (the ‘Self-Sufficiency Project’) for low-income families. These programs are grouped into two main categories: those with earning supplements (ES) and those with mandatory employment services and time-limits. The authors’ main result is that the programs which increased both employment and income (only the ES programs) had small transitory effects on children’s schooling achievements. As Morris et al. observe: “the effects on parents’ economic outcomes largely faded soon after the policies
5 It focuses primarily on the sensitivity and affective quality of caregiver-child interactions. It can also account for the interactions between the children themselves, with their environment, and with the diversity of developmental activities proposed.
ended.” This could be an indication that only changes in permanent income durably affect a child’s development (Heckman and Carneiro, 2003). The other programs had virtually no effects. It is not clear whether the short-lived effects were principally due to increased income, or to increased use of center-based care as a result of increased income.
Canadian Studies
Using the first cycle (1994-1995) of the NLSCY, Lefebvre and Merrigan (2002) show that non-parental care (center- or family-based), compared to non-parental care, has no effect on the cognitive development of children, as measured by an index of their social and motor development (in the case of children aged less than 48 months) or by PPVT scores (4- and 5-year-old children). The estimates show that some observable family characteristics such as the mother’s education and immigration status have very strong effects on a child’s score. Siblings fixed effect estimations support the results obtained from OLS.
With two more cycles of the NLSCY at hand (1996-1997 and 1998-1999), Gagné (2003) studies the effect of parental work and the use of daycare services on the PPVT scores of 4- and 5-year-olds. The author’s first step is to classify mothers within categories on the basis of their parenting ability scores and their level of education. The results suggest that full-time employment of a “high quality type” mother induces a lower cognitive score for the child. The converse is true for a “low quality type” mother. Otherwise, full-time employment has no effect, as well as hours of non-parental care, except for affluent children who benefit from them. Results are similar with fixed effect estimation methods.
Using the first two cycles (1994-1995 and 1996-1997) and the last two cycles (2000-2001 and 2002-2003) available of the NLSCY6, Baker et al. (2005) analyze the impact of Québec’s childcare policy on childcare use, maternal work, and diverse outcomes measuring the “well-being” of both children (0 to 4 year olds) and parents. The estimation approach is a modified (à la Bertrand et al., 2004) difference-in-differences. Their results on maternal work are very similar to Lefebvre and Merrigan (2007, 2005a, 2005b). Overall, they find the program to increase maternal labour supply as well as producing a shift in childcare use, from informal to formal settings. Moreover, they highlight the fact that Québec’s childcare policy had adverse consequences on the “well-being” of parents and children. Specifically, this policy is estimated to have had deleterious effects on both the behaviour and health of Québec’s children (aged 2 to 4 years). Parents are also subject to this last effect and, at the same time, appear to display worse parenting practices than before. They suggest that these effects may be temporary.
6 They do not consider the third cycle participants (1998-1999), surveyed during the two years immediately following the phasing-in of Québec’s low-fee childcare policy.
2. Early childhood care and education in Québec and across Canada
The implementation of Québec’s childcare policy (1997-2002)
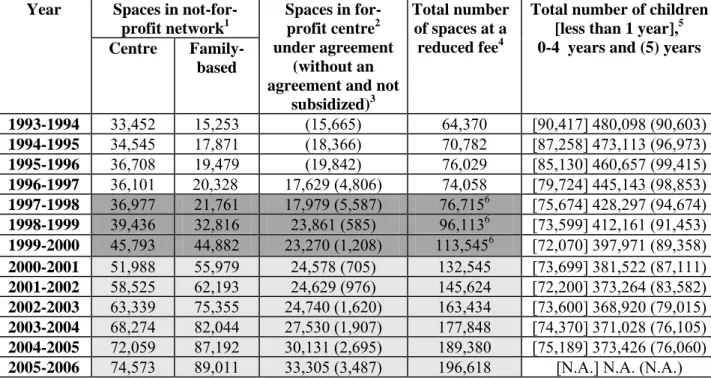
Before September 1997 in Québec, some subsidies partially covering fixed costs were directed to all licensed and regulated childcare facilities and low-income families received a fee-subsidy according to eligibility criteria. Table 1 displays the evolution and targeting of spending from 1996 onwards. In 1996-1997, these subsidies amounted to $288 million dollars. On September 1st 1997, licensed and regulated childcare facilities under agreement with Québec’s Department of the Family (not-for-profit centers, family-based daycare and for-profit centers) started offering spaces at the reduced contribution of $5 per day per child, for children aged 4 on September 30th. The rate of growth of subsidized spaces increased in the third year of the program (childcare facilities and spaces are created throughout the year). On September 1st 1998 and on September 1st 1999 respectively, the 3-year-olds and 2-year-olds (on September 30th) were eligible for the low-fee spaces. For the fiscal year 1998-1999, $390 out of $470 million in daycare subsidies were attributed directly to daycare providers. On September 1st 2000, all children less than 5 years old were eligible for fully subsidized spaces. In 2005-2006, subsidies had reached $1,500 million practically all directed towards daycare providers.
For children aged 5 on September 30th 1997, full-day instead of part-day kindergarten was offered by all School Boards (some private schools already offered this option). Kindergarten is not compulsory but if a child is enrolled in a public school, he or she must attend class for the full school day and school week. In September 1998, the Department of Education began subsidizing before- and after-school daycare. Since then, the School Boards must offer these services on the school premises at the reduced contribution of $5 per day per child for the children at kindergarten and grade school ages.
Table 2 presents the evolution of the number of spaces partly or totally subsidized by the government from 1996 to 2005-2006 by type of childcare setting as well as the total number of Québec’s children in different age groups by year.7 We observe that non-profit services are the main beneficiaries of the policy. The yearly increases from 1998 are all quite substantial. Since the introduction of the policy, it is well known that the program has not been able to satisfy all of the increased demand for low-fee spaces. It is difficult to obtain data on the number of children on waiting lists with no access to a subsidized space. Therefore, we could be underestimating the effect of the program.
Childcare use in Canada: what are the arrangements and how much are used?
We cannot trace such an elaborate picture of the evolution of childcare services for other provinces in Canada, but we know the number of children in subsidized-fee daycare is very small relative to Québec
7 As for 5-year-olds, according to administrative data, attendance increased from 88% half-time before 1997, to 98% full-time afterwards.
and has remained small during the period of analysis.8 It is also difficult to obtain a larger picture of daycare utilization, arrangements and reasons for the use of daycare across Canada. The last national survey on childcare use was conducted in 1988. Other than licensed centers and family-based regulated daycare, parents can choose unregulated daycare in their own home or in someone else’s home by a relative or by a non-relative. Provincial and federal policies provide tax relief for childcare spending as long as receipts are presented to income tax authorities.
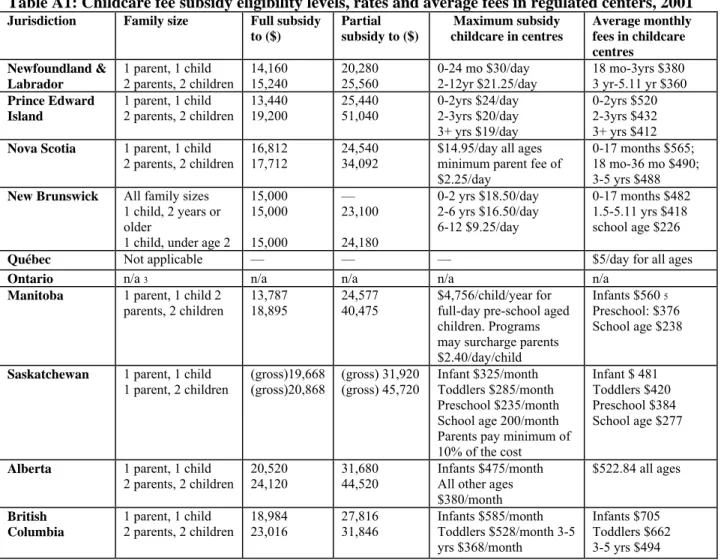
Table A1, taken from Doherty et al. (2003), shows the fee-subsidy policy of each province for the year 2001. Policy in provinces other than Québec remained largely unchanged during the nineties (although fee subsidy eligibility levels and rates have been raised modestly in some provinces) and the number of children in subsidized daycare remains very low. The constancy of subsidy policy in the rest of Canada is relevant, given our estimation methodology. Table A2 presents selected characteristics of kindergarten program by provinces for academic year, 2003-2004. All provinces offer publicly provided free kindergarten for 5-year-old children in a school setting under the auspices of the Department of Education. All programs are for a half-day (2 hours and 30 minutes) during the school year, except in Québec (which is for a full day, since the fall of 1997), New-Brunswick and Nova-Scotia. In most provinces parents are free to register their child in kindergarten as it is not a legal requirement (a large majority of eligible children do attend kindergarten). In Ontario, most School Boards offer a half-day of junior kindergarten for 4-year-old children. Again, most eligible children attend these kindergartens. Finally, several provinces, including Québec, offer a limited number of junior kindergarten spaces for handicapped and underprivileged children of age 4.9 Since the fall of 1997, almost all 5-year-old children in Québec attend full-time kindergarten while a large number attend before- after-school subsidized daycare settings. We conclude that the only major change in kindergarten policy for 5-year-old children from 1994-1995 to 2002-2003 occurred in Québec. Furthermore, the fact that in Ontario most 4- and 5- year-old children are enrolled in (pre)kindergarten suggests that this province offers an interesting control group as an alternative to the whole of Canada.
The NLSCY asks parents if they use childcare services for the purpose of studying or work (the question is not asked to households where parents do not work nor attend school) and for each mode of childcare used the number of hours per week. Figure 1 presents graphs, for Québec and the other provinces, of the principal care arrangements used by parents for children from 0 to 5 years of age for the 5 cycles of the NLSCY. From the third wave of the survey (1997-1998), it appears that a larger percentage of children in Québec are in daycare relatively to other provinces. Family-based daycare outside of the child’s own home is the most widely used mode of daycare across Canada. Daycare is growing rapidly in
8 For some partial and tentative estimates, see Friendly et al. (2003) and Doherty et al. (2003). The OECD (2004) study on Canadian childcare deplores the state of patchy daycare statistics in Canada.
Québec relatively to other provinces since 1998. Daycare in the household (by relatives or non-relatives) is slightly higher outside of Québec. Center-based care, including before- and after-school care increases rapidly in Québec compared to the other provinces where this arrangement ranks third.10 To summarize, the figure shows an important shift in daycare use occurring in Québec after the introduction of the daycare policy in 1997 but not in the rest of Canada.
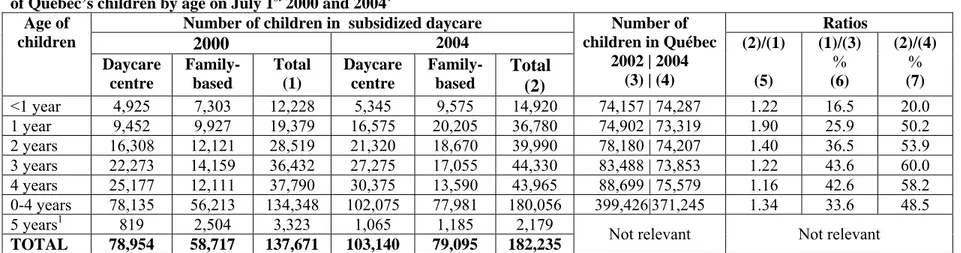
Figure 2 graphs the mean hours children spend in the primary care arrangement by age of the children for Québec and the other provinces. From the third wave of the survey, there is a large increase in the average hours children spend in daycare for each age group (less than 1 to 4) in Québec compared to the rest of Canada. The 5-year-olds, as expected, spend less time in childcare than 4- year-olds and the rise of hours in daycare is smaller than for younger children. Before 1998 a large proportion of 5-year-olds were at home and their hours in daycare were 0. From 1998, practically all 5-year-olds are in kindergarten. However, this does not affect hours in daycare. The slight increase is explained by the $5 per day before- and after-school daycare policy introduced in 1998. Table 2 presents the breakdown of children benefiting from the low-fee childcare by age and setting in years 2000 and 2004, and shows the number of children that have been exposed to those childcare services over the years.11 The last three columns of the Table 3 indicate a significant regression of entry age in childcare and a large progression of the proportion of children having experienced childcare by age four. In 2000, 34% of all children aged 0 to 4 years were in low-fee childcare services, 45% in 2003 (statistic not shown) and 49% in 2004. To summarize, the Tables presented so far show important shifts in daycare use, modes, and intensity occurring in Québec after the introduction of the daycare policy in 1997 but not in the rest of Canada.
3. Conceptual issues and econometric modeling
To interpret cautiously the empirical results resulting from the econometric modeling of the effect of the childcare policy, the channels by which the policy affects children must be identified. The assumptions made are based on the empirical literature on child development reviewed above.
Conceptual issues
The preceding studies (Lefebvre and Merrigan, 2007, 2005a, 2005b; Baker et al., 2005) have shown the program had a strong impact on the labour supply of mothers with pre-school children and the number of hours children spend in daycare (see Figures 1 and 2). However, using the Canadian Survey of Labour and Income Dynamics (SLID), we show (Lefebvre et al., 2007) that the program had a moderate impact
10 Lack of inclusion of full-day kindergarten as a mode of care probably distorts the changes here. Five-year-olds and eligible four-year-olds may attend kindergarten making it the main mode of care, particularly in the Province of Ontario where most five-year-olds and eligible four-year-olds attend (pre)kindergarten. If they are not in before and after school programs, they will be recorded as “no care arrangement used” in all likelihood, or perhaps care in own home by a relative (see Figure 2 for the 4- and 5-year-old children).
on net family income as the additional earnings from the mother’s increased labour supply were taxed and transfers geared to families (some of which in Québec and Canada depend on total family income) reduced. Given previous empirical studies, such moderate gains should have a very small positive impact on child development. If this is the case, the treatment effect is mainly capturing the effect of an increase in female labour supply which is basically the effect of substituting hours with the mother with hours in daycare. It is also capturing the effect of a change in type of daycare setting, children mostly going from more informal daycare in the child’s home or in a non-related person’s home to formal full-time12 regulated daycare, especially in center-based settings.
It is very difficult here to pinpoint who are the “treated” in the technical sense. One might assume that children who would not have been in daycare in the counterfactual world and who are now in daycare are the treated. But we must also count those who would have been in a different setting in the counterfactual world. In some sense, even children who would be in the same setting are treated because daycare facilities now have more children and are more diverse than before. Children in daycare are mostly spending longer hours in daycare and children who stay home could have fewer friends at home because most are in daycare. In some sense, all children are touched by this policy. Therefore, we do not attempt to estimate the treatment on the treated effect but consider our estimates to be the average treatment effect for children in Québec.
Our a priori hypotheses about the sign of the effect is based on the previous studies surveyed earlier which have concluded that increasing the mother’s hours of work has a negative impact on child development if this increase occurs in the first year of the child’s life. Because only a few subsidized places existed for our sample of children when they were at a very young age we expect the effect coming from the increased hours to be negligible. Furthermore, most studies show that centers are superior settings for young children. Since a large number of children are in centers by cycle 5 of our data set, this aspect of the policy should have a positive impact on development. Therefore, we expect the policy, overall, to have a positive impact on the PPVT score.
Econometric modeling
The econometric approach is based on a “difference-in-differences” procedure which is now well established to evaluate natural experiments (Angrist et Krueger, 1999). The modeling uses both a double difference (DD) and a triple difference (DDD) estimation technique, where treatment groups are Québec’s children and children of the same age in the rest of Canada are the control groups. More precisely, the DD and DDD estimators are given by:
12 Almost all the subsidized spaces in the childcare network are offered (and must be occupied) on a full-time basis (for a maximum of 20 days per four weeks and no more than 261 days per year). A family must pay for the 261 days ($1,305) on a yearly basis to maintain its access to a space, even if the child is absent from the childcare service (due to sickness or for family vacations).
(
)
(
)
[
]
[
(
)
(
)
]
{
}
(
) (
)
[
]
[
(
)
(
)
]
{
}
(
) (
)
[
]
[
(
)
(
)
]
{
| 0 | 0 | 0 | 0}
(2). 1 | 1 | 1 | 1 | ) 1 ( 0 | 0 | 1 | 1 | * * * * = − = − = − = − = − = − = − = ≡ = − = − = − = ≡ − + − + − + − + Q Y E Q Y E Q Y E Q Y E Q Y E Q Y E Q Y E Q Y E DDD Q Y E Q Y E Q Y E Q Y E DD t c c c t c t c c c t c t c t c t c t cWhere E is the mathematical expectation operator, Y is the value of the outcome of interest, Q=1 if the child lives in Québec, and 0 otherwise; and c+t and c- are respectively the post- and pre-policy periods, with and >0. * t
0
≥
t
t*To estimate the econometric counterpart of these models, we refer to a general specification presented by Francesconi and Van der Klaauw (2007):
Yit = α + θQit + (γ11 + γ12Qit)t + [γ21 + γ22(t-s)]I(t≥s) +
∑
+Φ′ Xit + εit (3).= 5 3 cycle cycle t it t
Q
β
It is important to include a specification where the effects of the policy change for each post-policy cycle because each cohort was treated differently. For example the cycle 3 children (age 4 and 5) were exposed to the first year of the policy. The cycle 4 age 4 (age 5) children were exposed for 2 (3) post-policy years. The cycle 5 age 4 (age 5) children were exposed for 3 (4) post-policy periods. Because of the policy’s gradual implementation, the number of total additional hours in daycare because of the policy is much higher for the cycle 5 children than for the cycle 3 children. These remarks justify equation (3), where
β
t represents a time-specific effect of the policy. Xit is a vector of socioeconomic control variables and Φ is a vector of parameters, Qit takes the value of 1 if the child lives in Québec, 0 otherwise, t is a time trend, I()is an indicator function and s is the period the policy is implemented. In our case, post-policy periods start in 1999 when a substantial number of new spaces are created. The parameter γ11 is the effect of the aggregate trend, γ12 captures the effect of the specific trend in Québec, and γ22 is the aggregate post-policy change in the trend. Equation (3) is the final specification with Yit representing child outcomes in our case the PPVT-R scores. The following restrictions yield the DD and DDD models. If γ11=0, γ12=0, γ22=0 and βcycle3= βcycle4= βcycle5 then we obtain the DD specification (1). If we observe only three periods, where the
middle period is equally distanced between the first and third, γ22=0, and βcycle3 = βcycle4 = βcycle5 then we
have the DDD specification (2).
To test the sensitivity of the results to specification, we estimate three models. The first is a DD specification without trends and policy effects that are equal for each period (βcycle3=βcycle4=βcycle5). The
second is a DD specification with policy effects varying by period, (βcycle3≠βcycle4≠βcycle5). The third is a
DDD specification with a Canadian and a Québec trend. A generalized DDD specification (equation (3)) with a pre-policy aggregate trend, a pre-policy Québec trend and a post-policy change in the aggregate
trend was also estimated but yielded very imprecise estimates because we have very few periods to identify these trends. For this reason we do not report the full model, but a DDD model with an aggregate trend and a Québec trend (equation (3) with γ22=0). When policy effects are significant, we estimate the model using the method of Bertrand et al. (2004) to correct for standard errors and test policy effects while being more conservative. All estimations were performed with “bootstrap weights”, as computed by Statistics Canada for the NLSCY, which take into account the complex survey scheme.
We also, for sake of robustness, present results with data from cycles 1, 2, 4 and 5 only, because cycle 3 was a particular sample with a very large number of observations for 5-year-olds, and because the years (1998-1999) covered by cycle 3 might be considered as an implementation period. Furthermore, the estimations are also conducted with Ontarian children as an alternative control group (Ontario is the most populous province and part-time pre-K and K are available to all children aged 4 or 5). Finally, as shown later, given that the policy increased hours in daycare more for children with well educated mothers, we estimate the models for two sub-groups based on mothers’ level of education.
4. Data set
The data used for our empirical analysis are provided by Statistics Canada’s National Longitudinal Survey of Children and Youth (NLSCY) which is a probability survey designed to provide information about children and youth in Canada. The survey covers a comprehensive range of topics including childcare, information on children’s physical development, learning and behaviour as well as data on their social environment (family, friends, schools and communities). The NLSCY began in 1994-1995 and data collection occurs biennially. The unit of analysis for the NLSCY is the child or youth. Since the NLSCY objectives are to produce longitudinal and cross-sectional estimates, several populations are targeted.
In Cycle 1 (1994-1995), a sample of 22,831 children aged 0 to 11 was selected in each of the 10 provinces making up the first longitudinal sample. In Cycle 2 (1996-1997), to reduce the response burden on families with several eligible children, the number of children selected was limited to two per family. Therefore, some children were dropped from the original sample (16,903 children remained in the longitudinal sample). Furthermore, a new initiative was added to the main longitudinal survey – ‘Understanding the Early Years’ (UEY) - which focussed on a sample of children, aged 0 to 11 months and 1 to be followed until the age of 5. A total of 4,153 children were included in this second longitudinal cohort, approximately 2,000 children each of age 0 and 1, and also the new siblings of Cycle 1 longitudinal children who were already in the sample. In Cycle 3 (1998-1999), a new third longitudinal cohort of children aged 0 and 1 was created, which repeated the UEY initiative which added “the readiness to learn” aspect of children entering the school system to its preoccupations. It was determined that a large sample of 5-year-olds was required to meet these analytical goals. Simultaneously, it was
decided that a larger sample of 1-year-old children would meet those objectives once they were 5 years old in Cycle 5. Approximately 2,000 children aged 0 to 11 months, 7,944 one-year-old children and an additional sample of 7,052 5-year-olds were added to the preceding longitudinal cohorts. In Cycle 4 (2000-2001), the longitudinal children introduced in Cycle 2 are now 4 and 5 years old; it is the last contact cycle for these children. A new fourth longitudinal cohort of children, aged 0 to 11 months (2,358) and 1 (2,673), was surveyed by Statistics Canada. As in the previous cycle, there were not enough five-year-olds (introduced in Cycle 2) to meet the analytical goals of the “readiness to learn” objectives. A supplemental sample of 4,395 5-year-old children was selected across Canada. In Cycle 5 (2002-2003), a new fifth longitudinal cohort of children aged 0 and 1 was created for longitudinal purposes. Over all cycles, about 25 percent of children are from Québec and about 40 percent from Ontario. It should be noted that although four new longitudinal cohorts were introduced in the survey in Cycles 2 to 5, these 0 and 1 year-old children are surveyed only three times until they are aged 4 or 5.
Test scores
The analysis is based on the 4- and-5-year-old children who completed the Peabody Picture Vocabulary Test-Revised (PPVT-R), without taking into account whether some children are purely cross-sectional and others are purely longitudinal.13,14 The PPVT-R was designed to measure receptive or hearing vocabulary. For the NLSCY, it was used to measure school readiness for children in the four- and five-year-old age groups.
The master files present both the PPVT raw and standardized scores. However, Statistics Canada has used different methodologies to standardize the scores.15 The released measurements for cycles 1 to 3 were standardized within cycle (with slight variations in the methodology), while cycles 416 and 5 were standardized over the grand population of all tests over the 5 cycles of data. Cycles 1 to 3 would in essence look similar from one time to the next as they are standardized to the same expected statistical parameters. This type of standardization is common for analysis of domains within a cycle, however provides limited insight for in between cycle analysis. Thus, all the cycles are adjusted by age groups to have a mean of 100 and standard deviation (SD) of 15, so overall population changes are arbitrary as they are standardized to the same standards (the norms used were different in cycle 1 while in cycles 2 and 3 the norms recalculated in cycle 2 was reused for cycle 3). Realizing this limitation, Statistics Canada introduced in Cycle 5 a less restrictive normalization technique where the expected age performance is
13 The test is usually applied to children whose effective cohort age is 4 or 5 (very few 3 and 6 year-olds are included as some children are assessed early before their fourth birthday or after their fifth in the next calendar year).
14 In Cycle 2 to 4, the PPVT was extended to the 6 year-old children belonging to the first cycle longitudinal cohort, but there are no comparison groups in the longitudinal cohorts appearing in cycles 1 and 2.
15 The score is adjusted for the age (the smoothing technique is applied by 2-month age groups) and the language of children.
benchmarked against all children of that age over time versus those measured at the same time. The scores are still adjusted by age groups to have a mean of 100 and a SD of 15 computed over 5 cycles and they are less susceptible to sampling variation as 5 samples have been used to determine the norm. For robustness and to facilitate longitudinal analysis (to capture true population difference over time and not simply difference resulting from sampling error), we have re-standardized the PPVT-Raw scores using all the cycles in the NLSCY.17 It should be noted that the standardization was done separately for the PPVT-R and EVIP-R (the acronym for the French adaptation of the test). Therefore, when global comparisons are made between children who completed the test in English vs. French, by definition, performance should be equivalent.For sake of robustness, we also perform regression analysis with PPVT raw scores.18 We control for children passing the test in French (English) in the other provinces (Québec).
General sample and sub-samples for the analysis
First, from the data sets of the 5 cycles, we sampled all children aged 4 and 5. Children living in foster families are excluded as well as those (very few) with a mother with missing information on the socioeconomic control variables (see Tables A3 and A4). Children with a missing PPVT score are also excluded. Secondly, we separated our sample by the level of education of the mothers (with a high school diploma or less, and with a university degree). For the NLSCY, the unit of sampling is the child, and weights (cross-sectional or longitudinal) are designed for the child, not the parents nor the household. It is possible that some mothers have more than one child in the data set for a particular cycle. Since we are using children as the unit of analysis, all means and regression results are weighted by the child’s cross-sectional weight.
A descriptive analysis
Figure 3 contains graphs tracing the time-series evolution of the average PPVT scores for children aged 4 and 5 for Québec, Ontario and the other provinces (including Ontario). A rough calculation of the
17 Statistics Canada made available their smoothing routine. The norms are based on 28,214 records from Cycles 1 to 5 of the NLSCY main survey with PPVT-R raw scores. Some records with zero PPVT-R raw scores were excluded from the data used to create the norms: 1 record from Cycle 2, 49 records from Cycle 3, and 6 records from Cycle 4. These zero scores were probably incomplete tests so they are not reliable and would underestimate the true measure of ability (particularly in Cycle 3). To obtain the norms, each record was weighted by its cross-sectional weight divided by the average cross-sectional weight of records from the same cycle.
18 The NLSCY User Guide (Cycle 5) makes the following comments: “Originally, the PPVT-R test was calibrated by using a representative sample of about 5,000 English-speaking children, similar efforts were undertaken to calibrate the French version. The item difficulties were calculated using the Rasch model. In the language of Item Response Theory, this is known as the one parameter logistic model. Since the test calibration was done some years ago, it is natural to expect some drift of the item difficulties, as the language itself evolves and some words become more or less common. To check whether this is the case an IRT analysis of the items was done, and derived scores based on the new difficulties of the items were created. For some of the items we did find some deviation from what was to be expected in the original test. However, no systematic - consistently up or consistently down in any portion of the test – deviations were found. Furthermore, the scores derived by using IRT were consistent with the raw scores. The correlation coefficient between the tests was 94% for the English version, and 96% for the French version, which is high by any standards. Therefore we (the NLSCY) are confident that the raw scores can be used as they are.”
programme effects using the PPVT means of children in Québec and in the rest of Canada yields program effects that are very close to those found econometrically. For four-year-olds, the mean score slightly decreases in Québec and slightly increases in Canada, a simple DD estimate gives a treatment effect of -1.63; and, for the five-year-olds, -4.41. In both cases, we see positive trends, strong for five-year-olds, for the rest of Canada, and a very slight decreasing trend in Québec. Table A3 for Québec and Table A4 for the Rest of Canada present the mean values of variables used in the regressions. These statistics show that mothers in both regions are very similar except for education in Québec in cycle 2 where better educated mothers are over sampled and immigration status for all cycles.
5. Econometric results
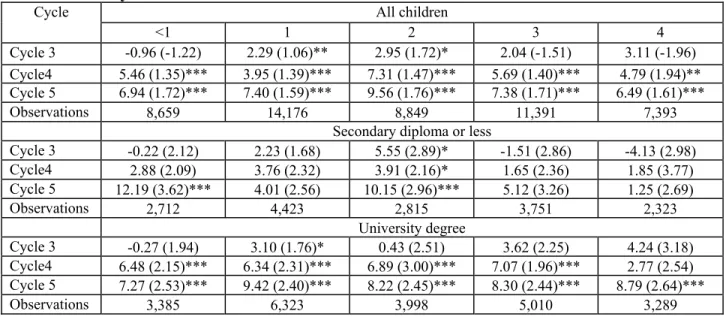
We start by providing evidence on the effect of the program on hours in daycare for children of different age groups. As explained, the program had different effects on hours in daycare for different cohorts because of the gradual way it was implemented. In order to evaluate this program effect, we estimated a DD model with different policy effects for different cycles. Table 4 displays the policy effects by age group (0 to 5) for cycles 3, 4 and 5. For children under 1, the policy has no effect during the period of cycle 3 (1998-1999) as subsidized places were not available for this age group. For cycles 4 and 5, the effects are respectively, 5.45 and 6.94 hours, in both cases significant (p<.01). For ages 1, 2 and 3, the effects are small for cycle 3, between 2 and 3 hours, but increase substantially in cycles 4 and 5, reaching 7.40, 9.36, 7.38 hours respectively. For children aged 4, the impact is already over 3 hours in cycle 3, when the program is already one year old in their case, reaching 6.48 hours in cycle 5. It is important to note that cycle 4 effects are all smaller than cycle 5 effects as new spaces were created every year during that time period. It is quite clear then that the cycle 5 children were exposed to the longest hours in daycare considering the time since birth. Unfortunately, the birth cohorts of cycles 4 and 5 will not be followed in future cycles as many will be exposed to substantial hours in daycare starting from their early months.19 Note that the slight positive effect found for 1- and 2-year-olds in cycle 3 could be due to the announcements by the government to support additional new subsidized spaces as soon as possible. Knowing that the space would be subsidized a year later, parents could have placed children in daycare centers before the place was subsidized. However, the cycle 3 effect is either barely significant or not significant for children aged 2 and 3 years old, therefore the cycle 3 effect for age 1 children could be a
19 These results may suggest that Québec’s mothers return to the labour market rapidly after giving birth. This is not the case. Before 2001, maternity and parental benefits were paid for 25 weeks to eligible mothers by the federal unemployment insurance program. In Québec, around 50% of mothers giving birth were entitled to the program, the same rate as for all Canadian mothers. Most entitled mothers, around 68% (12%) who returned to work did so after 5 to 8 months (9 to 12 months). Since 2001, the benefits period was extended to 50 weeks and a majority of entitled mothers (53% in 2002; 59% in 2003) returned to work after 9 to 12 months. Since the year 2000, a little more than 60% of Québec’s mothers giving birth are entitled to these benefits. Thus, most returning to work mothers do so before the child’s first birthday.
false positive. The two other panels demonstrate that the effect is substantially larger for women in the higher education group which could explain later results on cognitive development. The significance of the results for well educated mothers (starting in cycle 4 for children aged 3 and less) also suggests these women took an “early advantage” of the policy, probably for career reasons, compared to women in the lower education group. Another way to put it is that qualified women stand the most to lose, in terms of career advancements, from a prolonged absence from the job market. Clearly, the last two cohorts of our data set (cycles 4 and 5) were more intensely affected by the program than the earlier cohort.
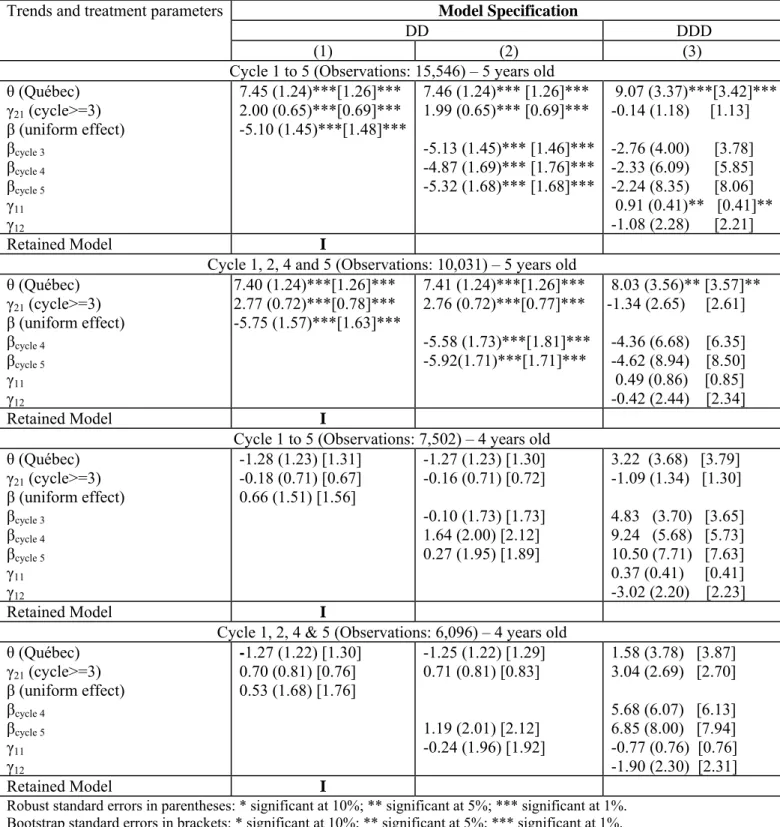
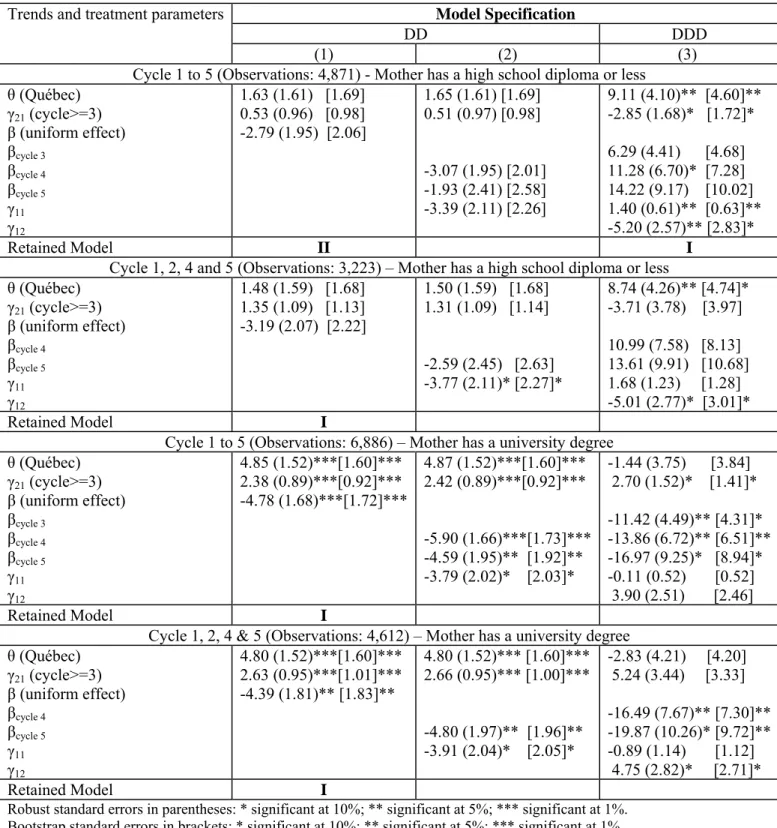
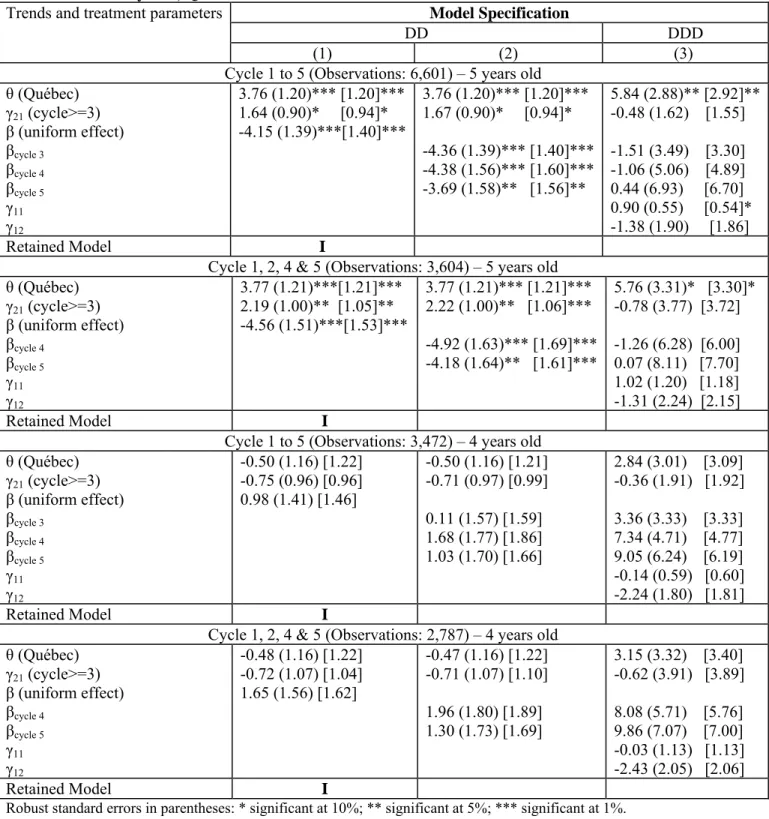
We now turn to the effects of the policy on child development. The econometric results (Tables 5 to 8) display a strong negative effect of the policy for the 5-year-old group. The sample of 4-year-olds shows no effects of the program on PPVT scores. We start our discussion with the 5-year-olds. When the effect of the policy is constrained to be the same for all the post-policy years and the DD method and full sample of mothers are used (Table 5, top panel, column 1), we estimate a negative effect of the parameter estimates that is close to -4.00. This is a very large effect (almost one third of a standard deviation of the dependent variable). As a comparison, the ceteris paribus “effect” of a mother moving from a high school degree to a university degree mother is about 3. The negative effects are observed for both high and low education mothers (Table 7), but are slightly higher and statistically significant only for mothers with a university degree for whom the policy causes a larger increase for hours spent in daycare. Results for the DD specification with the policy effect changing across time and the full sample are in Table 5, top panel, column 2. The effects are quite similar across periods. The differences between the period effects are not statistically significant. The results are robust to the inclusion or exclusion of cycle 3 as seen in the second panel of Table 5 where policy effects remain negative and significant.
In most cases, for the DDD specification, the pre-policy trend for Québec is not significant so that the DD specification is preferred. Results using the raw scores are also very similar to results with the standardized scores (Table 6). For the 5-year-olds, the DD model with a constant effect of the policy provides us with estimates of -5.10 when all cycles are used, and of -5.75 when cycle 3 is excluded from the estimation. One of the robustness checks consisted of estimating a DD estimator à la Bertrand et al. (2004). The policy effects remained significant and quite close in magnitude for the 5-year-olds (results not presented but available from the authors).The specification with only Ontario (Table 8) as the control group gives the same results, as with all provinces, they are almost “point on.” In some sense, this is not surprising as 40% of sampled children reside in Ontario.
Turning to 4-year-olds, the results in the first two columns of Table 5, panel 3, show very small and insignificant effects. Column 3 shows very large and imprecisely estimated positive effects when all cycles are included. This is due to a very large and negative trend for Québec which is not credible. When cycle 3 data are not used for the estimation, panel 4, the Québec trend is not significant and the DD
specifications in columns (1) and (2) are preferred on this basis. The samples based on the level of education yield the same results. Using the 4-year-old Ontarian children, as a control group, does not alter the significance of the results, even if it does alter the sign and/or size of the effects (Table 8).
Discussion
In summary, the effects of the program are found to be negative for 5-year-olds and null for 4-year-olds, contrary to our a priori assumptions which predicted positive effects. The results for sub-samples of children (mothers with a high school education or less, with a postsecondary diploma) suggest that the policy slightly affected “social” gaps in school readiness: children whose mother is well-educated may stand the most to lose from being cared for longer hours and for the better part of the year. Finally, a half-day pre/kindergarten regime in a public school setting, like in Ontario, may be a better approach to ECEC than a highly subsidized network offering different childcare settings (not-for-profit and for-profit centers, family-based), like in Québec, from the perspective of children’s developmental outcomes.
We propose three major explanations for our results when compared to former studies on the impact of ECEC on preschool achievement. Most studies that attempt to evaluate the impact of additional daycare are plagued by endogeneity problems which is not the case in our study. Second, rarely can we observe variations in hours of care for young children of the magnitude observed after the implementation of the program. For example, in 1994, 45% of all children aged 1 to 4 were in child care and 32% for more than 21 hours per week, while in 2002, 70% of children of the same age are in child care and 54% for more than 21 hours. Not only are more children in daycare but they are there for much longer hours. Finally, although children are now in more formal regulated types of daycare, which is supposed to be helpful or at a minimum not harmful, two major studies (ISQ, 2004; Japel et al., 2005) show that the average quality in Québec’s subsidized daycare network is at best satisfactory and in many cases low or not acceptable, particularly for children in lower income families. Table A6 summarizes the results of the 2004 study on educational quality by characteristics of daycare and overall quality: family-based, for-profit-center and childcare for infant services are of rather fair quality and, except for non-profit centers, childcare services are largely unsatisfactory or fair in terms of overall quality. Part of this is explained by the rush to implement the program, build up new settings and create new spaces to respond to the excess demand for spaces, which forced the government to accept daycare workers with no specific training in ECEC.20 It would therefore be recommended to any state intending to follow Québec’s footsteps to be weary of
20 According to administrative data from the Department of Family, in 2001: 42% of not-for-profit centers do not respect the ratio of two out of three ‘qualified’ educators; 25% of for-profit centers do not respect the very less stringent ratio of 1/3; overall 40% of educators have no specific qualification in ECEC. A person is considered as having qualification if she has a university diploma (17%; generally they are directors of centers) or training in ECEC at the university level (6%), a post-secondary “non-university” degree (37%), or a secondary school diploma or vocational training in ECEC (40%). Family-based educators have less formal qualification: 45% have a high-school high-school diploma or less, 84% have no specific training in ECEC; and they have only 7.7 years of experience in childcare occupations.
offering long hours to parents at very low prices. Since it is important to offer high-quality daycare services, it would be advised to implement slowly such programs, starting in low-income neighbourhoods, where experimental studies have proven their efficacy when providing high quality services. This would also give some time to the proper educational facilities to start offering programs that better prepare workers for the daycare industry.
6. Conclusions
We present evidence that the subsidized daycare policy of the province of Québec has produced negative effects on the PPVT for children of age 5 and no effect for children of age 4. They are in line with the results of Baker et al. (2005) which show that the program had negative effects on several non-cognitive dimensions.
Therefore, if the policy increased substantially the labour supply of mother’s with young children, one of the goals of the policy, there is no evidence, up to now, that it has increased family income, school readiness or child-well being in general, the other major goals of the policy. Our intuition is that children are simply spending too much time, especially when they are less than 3, in daycare for the policy to have any positive effect. This is explained by the structure of the program which creates strong incentives for families to let the child spend long hours in daycare at a very young age and for all other pre-K ages. For example, the daily fee ($5 per day per child from September 1997 to 2004, and $7 since January 2004) is the same for all age groups despite the fact that daycare costs are much higher for the very young.21 Services are available 10 to 12 hours (depending on the setting) per day, 261 days a year. The government asks daycare providers to make sure parents use daycare services every day of the week (unless the child is sick): if a space is not occupied full-time the subsidy is reduced. In other words, even if a family would like to pay for a full week despite wanting the service part-time, a child cannot be enrolled only three days or five half-days per week. Furthermore providers themselves prefer to offer full-time full-week spaces because it is easier to manage.
Of course, we have looked at only one measure of development. However, it has been shown to be a consistently good forecaster of schooling achievement in numerous studies. Unfortunately, the data will not permit thorough analysis on the long-term impacts of the policy as only one longitudinal cohort followed after children are older than 5 (4 year-olds in cycle 3) was subjected to the treatment and it lasted only one year. Future research should be looking at the impact of the program for children at different percentiles of the distribution of scores using the methodology of Athey and Imbens (2006).
21 The public subsidy provided to not-for-profit centers providers for a child aged less than 18 months is approximately $60 per day and $45 per day for a child aged from 18 to 59 months.