François: Associate professor of Finance, HEC Montréal; Research Fellow, CIRPÉE
pascal.francois@hec.ca
Hübner: Deloitte Professor of Financial Management, HEC Management School – University of Liège, Belgium; Associate Professor, School of Economics and Business, Maastricht University, the Netherlands; Founder & Chief Scientific Officer, Gambit Financial Solutions Ltd, Belgium. Corresponding author: University of Liège, HEC Management School, Rue Louvrex 14 – N1, B-4000 Liège, Belgium. Phone: (+32) 42327428
g.hubner@ulg.ac.be
This paper has benefitted from comments by Eric de Bodt, Georges Dionne, Roland Gillet, Sonia Jimenez-Garces, Sophie Manigart, William Megginson, Auke Plantinga, Armin Schwienbacher, as well as Brandeis University, Skema Business School (Lille) and Paris 1 Panthéon-Sorbonne University seminar participants, the 2010 Benelux Corporate Finance Day (Groningen), the 2010 CIRPÉE Conference, and the 2010 French Finance Association Conference (St-Malo) attendees. We thank Yan Alperovych and Arnaud Cavé for excellent research assistance. Part of this research was completed while the first author was visiting HEC Management School – University of Liège. Pascal François acknowledges financial support from SSHRC. Georges Hübner acknowledges financial support of Deloitte Luxembourg. This research was partly supported by a Belgian Fonds de la Recherche Fondamentale Collective (FRFC) Grant.
Cahier de recherche/Working Paper 10-46
A Portfolio Approach to Venture Capital Financing
Pascal François
Georges Hübner
Abstract:
This paper studies the contracting choices between an entrepreneur and venture capital
investors in a portfolio context. We rely on the mean-variance framework and derive the
optimal choices for an entrepreneur with and without the presence of different kinds of
venture capitalists. In particular, we show that the entrepreneur always has the incentive
to share the risk and benefits of the venture whenever possible. On the basis of their
objectives and characteristics, we distinguish the situations of the corporate,
independent, and bank-sponsored venture capital funds. Our framework enables us to
derive the optimal contract design for the entrepreneur, featuring the choice of investor,
the entrepreneur’s investment in the venture, and her dilution in the project’s equity as a
function of her bargaining power. This result allows us to characterize the choice of the
investor depending on her cost of equity and debt capital. In addition to project size and
risk, entrepreneur’s risk aversion turns out to be a critical determinant of VC investor
choice –a finding which is strongly supported by a panel analysis of VC fund flows for 5
European countries over the 2002-2009 period.
Keywords: Venture capital, Portfolio choice, Entrepreneur, Risk aversion
1
Introduction
To date, financial research devoted to the determination of the entrepreneur’s cost of capital in the context of portfolio choice has preferably applied principles based on the integration of illiquid assets in the CAPM framework (see in particular Meulbroeck, 2001; Kerins et al., 2004). The specificity of the entrepreneurial project, and the impossibility to partition it into transferable financial securities make it difficult to precisely assess the relevant risk premium. Still, within the context of the CAPM, it is possible to move forward to address a mean-variance formulation of the cost of capital. Garvey (2001) introduces an entrepreneur-specific project into the classical framework, and relates the venture’s cost of capital to the entrepreneur’s risk aversion coefficient. But he further goes in the direction of identifying the cost of capital in a pure portfolio context with only financial assets. So far, the examination of the entrepreneur’s problem within the portfolio theory framework has not dealt with the explicit intervention of an outside investor such as a venture capitalist, in spite of the relevance of this scenario.
At another level, the vast majority of the researchers addressing the initial investment relationship between entrepreneurs and venture capitalists focus on information asymmetries, liquidity, costs, and the value-added of the venture.1 Upstream from this approach, several issues are still unresolved and can be directly considered within the CAPM equilibrium framework. Amongst the most important ones, the entrepreneur’s choice to resort to a venture capitalist raises two questions that directly relate to a portfolio problem: (i) would the availability of a venture capital contract induce the entrepreneur to undertake a profitable venture if she did not otherwise? and (ii) could the characteristics of such a contract enhance the risk-return properties of the entrepreneur’s global portfolio? To the best of our knowledge, despite their importance, these questions have not been addressed in the financial literature.
In a dispassionate context where economic agents are rational risk averters with homogeneous
information, our paper studies the determinants of contracting preferences between the entrepreneur and the investor in a pure portfolio choice context, where allocation decisions are taken on the basis of risk and return characteristics. These preferences feature the choice of the investor type and the characteristics of the contract between the entrepreneur and the selected investor. We deliberately leave aside considerations regarding the positive externalities brought by the investor on the intrinsic value of the venture (i.e. reduction of risk and/or enhancement of expected returns), and concentrate on the pure portfolio issues. Because her financial surface is much larger than the entrepreneur’s, the venture capitalist fully perceives the diversification potential of the project in her global portfolio. Hence, the same undertaking induces a lower risk penalty for the professional investor than for the entrepreneur, resulting in an inducement for the entrepreneur to transfer part of project risk and forego a proportionally larger share of project excess return. As a major outcome of this analysis, we get that the entrepreneur always has a rational incentive to seek for an outside investor in the venture, even if she would have undertaken the project anyway and despite the fact that the investor would not bring any added value to the project. Bringing an analogy to insurance policies, the reason for this positive result has to be found by the risk sharing property of the contract, whereby the entrepreneur is better off by giving up some project return in excess of financial asset in exchange of a more-than proportional reduction in her global risk exposure through the venture capital contract.
The second aspect of the venture capital financing decision is related to the choice of which investor type to contract with. The literature devoted to the determinants of this decision is abundant. Be-sides their usual categorization based on their level of involvement in the venture, potential investors can be discriminated in various ways, such as level of private information (Ueda, 2004; Chemmanur and Chen, 2006), availability of internal resources (Katila et al., 2008; Subramaniam, 2009), expe-rience (Sørensen, 2007), presence of complementarities (Hellmann et al., 2008), perceived expeexpe-rience by entrepreneurs (Bengtsson and Wang, 2010) or project innovativeness (Hirsch and Walz, 2006). Consistent with the context of portfolio theory, we adopt a partitioning of investors with a semantic
similar to Hirsch and Walz (2006) and Hellmann et al. (2008), based on the distinction between independent, corporate or bank-sponsored venture capital investors. Such a classification enables us to analyze investor characteristics from the point of view of their cost of capital, which would be their major source of difference in a risk-return framework. We derive that the optimal choice of investor depends on her cost of capital components, on the risk aversion level of the entrepreneur and on the characteristics of the project, but is independent of the design of the contract itself. In particular, investor selection is not contingent on the bargaining power of the entrepreneur.
Starting from the same neutral point of view, in the absence of synergy or asymmetric information effects, we endogenize important contractual elements such as the proportion of capital invested and the entrepreneur’s equity ownership from the point of view of the relative strength of the contracting agents. Regarding the entrepreneur, our major finding is the separation between the decision of how much to invest in the venture, which only depends on cost, risk level and risk tolerance characteristics, and the arrangement of the share of equity held in the project, after dilution, which depends on the bargaining power of the contractors. Our findings that, whatever the contractual arrangements, the entrepreneur’s stake in the project decreases with project risk and increases with her wealth endowment, holds firmly in our framework with symmetric information. We do not have to resort to signaling (Leland and Pyle, 1977) or agency theory (Bitler et al., 2005) to make such a derivation.
The portfolio approach to venture capital has the potential to fill an important gap in the economic motivations of venture investments. We show that, whenever possible, the entrepreneur has always a rational incentive to enter a contract with a venture capitalist. By partitioning venture capital investor groups into corporate, independent, and bank-sponsored funds, we identify the discriminating factors that drive the choices of contractors and contracts in a pure context, i.e. in the absence of externalities induced by the relationship, but where the difference between investors is driven by market imperfections regarding their cost of capital. Our framework enables us to derive the optimal contract design for the entrepreneur, featuring the choice of investor, the entrepreneur’s share in
the venture, and her dilution in the project’s equity as a function of her bargaining power. This result allows us to link the optimal investor choice to her cost of equity and debt. Combined with our numerical analysis, the results derived in this study shed new light on the fundamental choices underlying the entrepreneur-investor relationships.
A panel data analysis of venture capital fund flows in five European countries over the 2002-2009 period provides strong support for one of the main predictions of our model, namely the relation between entrepreneur’s risk aversion and the choice of venture capital investor type. In line with our predictions, we find a clear tendency to finance with independent funding sources in a low risk aversion environment, while bank-sponsored funds are financed when risk aversion is higher. Furthermore, we theoretically as well as empirically show a substitution effect between bank-sponsored versus corporate funds. We also emphasize the importance of the level of risk aversion on the financing choice for different stages of corporate development.
The paper is structured as follows. Section 2 presents the model setup. In sections 3 and 4, we characterize the preferences and contracts between the entrepreneur and the venture capital investors. The fifth section presents the results of the numerical analysis. In section 6, we report our empirical analysis. Section 7 concludes. Proofs are gathered in the Appendix.
2
Setup
Consider a financial market where a set of risky securities and a risk-free asset are traded in the absence of arbitrage. There are two agents: a potential entrepreneur (e) and a financial investor. Both have full access to all traded securities, but may differ in their risk aversion. The entrepreneur, whose endowment is normalized to 1, has proprietary access to a non-marketed venture investment π yielding a rate of return rπ. This venture is not accessible to the investor. We assume that the
venture initial outlay is K > 1 so that the entrepreneur needs additional financing to undertake it.2
2The initial outlay K should be viewed as the amount in the project that cannot be diversified
All portfolio rates of return ˜rj are entirely characterized by their expectation rj ≡ E(˜rj), their
standard deviation σj ≡ σ(˜rj) and their beta βjm with respect to the market portfolio m. The
return on the riskless asset is denoted rf. For any given portfolio j, each agent a assigns a utility
score E(Ua(j)) ≡ Uja = rj −12γaσ2j, where Uja is a shortcut for the expected utility operator and γa
represents the agent’s constant absolute risk aversion coefficient.3
The CAPM with two-fund separation holds on the financial market. At equilibrium with financial assets, each investor holds her utility-maximizing portfolio φ by combining the risk-free asset with the market portfolio with expected return rm.
2.1
Absence of venture capitalist
When scaled by its relative size, the project’s risk-return trade-off (Kσπ, rf + K (rπ − rf)) locates it
above the market market CML for the entrepreneur.4 In the absence of any financial investor, the entrepreneur has to choose between her initial financial portfolio and the investment in the venture financed through a loan.
The no-venture case If the entrepreneur does not undertake the venture, she holds a portfolio of financial assets whose expected rate of return is:
reφ= σ e φ σm rm+ µ 1 − σ e φ σm ¶ rf, where σeφ= arg max σ µ σ σm rm+ µ 1 −σσ m ¶ rf − 1 2γ eσ2 ¶ = rm− rf γeσ m . The entrepreneur’s initial utility score is
Uφe= rf+ 1 2γe µ rm− rf σm ¶2 = rf + 1 2γe à rφe− rf σeφ !2 . (1) and friends.
3Throughout, subscripts and superscripts refer to portfolios and agents, respectively.
4Because the project risk is not wholly diversifiable for the investor, the Security Market Line is
The self-financed venture case To self-finance the project, the entrepreneur must borrow K − 1 at the risk-free rate.5 The expected return from her investment in the venture has expectation rf+K (rπ− rf) and standard deviation Kσπ. The expected utility extracted from the venture project
is Uπe= rf + K (rπ− rf) − 1 2γ eK2σ2 π. (2)
The characterization of the venture is relevant when the following two conditions are met: (C1) the investment opportunity induces a higher risk for the entrepreneur than her financial portfolio φ, i.e. Kσπ > σφ; (C2) the venture investment lies above the CML, i.e.
rπ−rf σπ >
rm−rf σm .
Proposition 1 Under conditions (C1) and (C2), the venture is self-financed iff
γe < γe= (rπ− rf) + r (rπ− rf)2− σ2π ³r m−rf σm ´2 Kσ2 π .
Given project and market risk-return profiles, the upper bound of entrepreneur’s risk aversion for self-financing the venture is inversely related to K, which is the project size normalized by the entrepreneur’s wealth. That is, all else equal, when the entrepreneur is highly financially constrained (i.e. large K), it will take a low level of risk aversion for her to accept self-financing. In other words, outside financing from venture capital is more likely to be needed when (i) entrepreneur’s risk aversion is high, or (ii) entrepreneur’s financial constraint is high. The result of Proposition 1 represents the starting point adopted by Garvey (2001) in his study of the cost of capital for the undiversified investor. Our paper diverges by considering the interaction between the entrepreneur and the investor, while Garvey’s analysis focuses on the entrepreneur’s portfolio choices and their impact on the required rate of return for the venture.
2.2
Availability of venture capital
The entrepreneur and the investor can enter a venture capital contract. Broadly speaking, such a contract is characterized with two features. First, it specifies the participations of each party. We denote 0 ≤ S ≤ K the amount invested by the entrepreneur, the remainder (K − S) comes from the investor. Second, the contract determines how the expected returns generated by the venture are split between the entrepreneur and the investor. Consistent with our contract characterization, Bengtsson and Ravid (2009) report, in their empirical studies of 1,800 venture capital contracts, six types of contract terms that fundamentally serve two goals: (i) to define the contingent cash flows to be received by the investor (e.g. cumulative dividends or participation clauses) and (ii) to define the contingent cash flows that the investor commits to put on the table (e.g pay-to-play clause). Interestingly, the sharing rule of profits can differ from the initial participations and dilution in venture capital contracts reflect this difference. We therefore denote dKS the fraction of the expected project revenues that the entrepreneur is entitled to, where d is the dilution factor.
Alternatively, dilution in the venture capital contract can be captured through an interest payment. Taking dilution into account, the entrepreneur obtains an expected dSrπ from his investment on the
venture and (1 − S)rf from his remaining endowment. Consider instead a contract where the investor
offers the entrepreneur Srπ+ (1 − S) τ as a reward for the total investment, where τ denotes a riskless
contractual transfer rate. The two contracts are made equivalent by setting
τ = S
1 − S (d − 1) rπ+ rf. (3) If, for example S > 1, then the entrepreneur borrows extra money to increase her investment in the venture. The investor offers to lend this amount but proposes to charge a transfer rate τ > rf,
hence from equation (3) d < 1. That is, the entrepreneur agrees to receive a diluted fraction of the project revenues.6
6In actual venture capital contracts, the entrepreneur often issues equity as well as convertible debt
With d > 1 (i.e. dilution is favorable to the entrepreneur), the entrepreneur enjoys favorable terms for lending (τ > rf if S < 1) or for borrowing (τ < rf if S > 1). This situation reflects the reward for
the entrepreneur’s "sweat equity" in the project. With d < 1, the reverse is true. Therefore, there is no economic difference between defining a dilution factor d or setting a transfer rate τ . We will further characterize the venture capital contract with the pair (S, τ ).
A contract between the entrepreneur and the investor is feasible if each of them has an incentive to participate. Denote Ua(S, τ ) the expected utility extracted by agent a from the contract. A contract is feasible iff ⎧ ⎪ ⎨ ⎪ ⎩
Ue(S, τ ) ≥ Uφ,πe ≡ max³Uφe, Uπe´ Entrepreneur’s participation constraint Ui(S, τ ) ≥ Uφi Investor’s participation constraint
(4)
A participation constraint becomes binding when the other agent has all the bargaining power in the contract negotiation. If the entrepreneur’s participation constraint is binding, the contract is investor-dominant. If the investor’s participation constraint is binding, the contract is entrepreneur-dominant.
Whichever the investor’s type, the entrepreneur’s expected utility can be written as
Ue(S, τ ) = τ + S (rπ− τ) −
1 2γ
eS2σ2
π. (5)
The investors’ commonly shared utility function is discussed below. The investors differ from each other by the parameter value.
2.3
Investor types
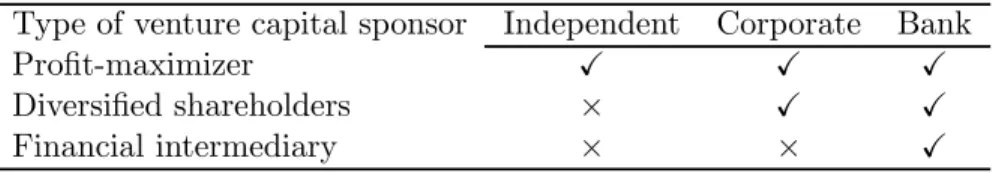
Building on earlier literature that has recognized some heterogeneity among venture capitalists, we identify three archetypes of investors. First, Hellmann (2002), de Bettignies and Chemla (2003), Chemmanur and Chen (2006), or Goldfarb et al. (2009) make a distinction between independent debt-related rate τ in a single relationship. The model’s intuition is not altered by these contractual arrangements.
investors (e.g. business angels) and captive venture capitalists. This distinction is not only organiza-tional or agency-based, but is also related to the goals for the investors who finance the fund. As our setup does not introduce asymmetric information issues, only the second dimension is relevant in our setup. Independent investors’ sole objective is to maximize profit through active management of their portfolio of ventures. They have a significant commitment to the VC activity,7 and consequently the complement portfolio to each individual venture investment is itself dominated by a number — that can be large — of other ventures. This induces that the risk-return trade-off of the independent’s pool of assets cannot be proxied by a financial portfolio such as a market index.
Besides their holding in the venture, shareholders of captive VCs hold a well-diversified portfolio of financial assets. They also have access to financial markets for their leverage decision. Their involve-ment in the venture capital industry is primarily motivated by the search for additional diversification benefits through investment vehicles showing an attractive return potential at the expense of large specific risks. Because each venture capital investment represents a tiny proportion of a large, balanced portfolio, the specific risks are considered to be diversified away. This interpretation is in line with the common explanation of the large capital inflows from U.S. pension funds in venture capital funds following the 1979 amendment to Employee Retirement Income Security Act’s (ERISA’s) prudent man rule (Gompers and Lerner, 1998). Manigart et al. (2002) test and confirm the hypothesis that, on average, captive VC funds require a rate of return from their investments that is lower than the one required by independent venture capitalists. This finding lends support to the diversification argument as a motive for setting up captive VC vehicles.
Another important distinction is made among captive venture capitalists (see e.g. Ueda, 2004, Hirsch and Walz, 2006, Bottazzi et al., 2008, Hellmann et al., 2008, Bengtsson and Wang, 2010): corporate VCs are owned by a parent company whereas bank-dependent VCs are subsidiaries of a banking institution.8
7Bottazzi et al. (2008) document that independent VCs generally display more investor activism
than captive VCs.
The bank-dependent VC, besides its activity as a venture capitalist, is a financial intermediary and so has a significant deposit and lending activity, which leaves her with better funding and investment conditions than the rest of the market. In our setup, this funding advantage is the major difference with the angel investor and the corporate VC. Such a view is consistent with empirical evidence shown by Hellmann et al. (2008) that a strategic motive for banks to invest in venture capital is to create opportunities for enhanced lending possibilities, which is close to their actual core business as financial intermediaries. Such a view also entails that the key dimension for classifying an investor as bank-sponsored is the transformation of maturities at large. Therefore, unlike traditional classifications, we associate the sponsoring activities of insurance companies (for their life insurance activities) and pension funds to the ones of financial intermediaries.
Table 1 summarizes the characteristics of each fund provider.
Insert Table 1 here
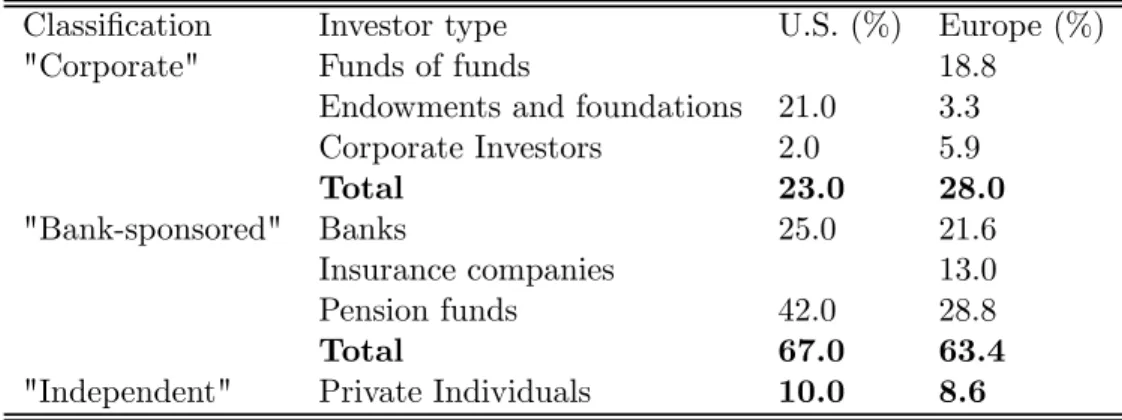
To get a better picture of the market, the market shares in total venture capital funds in Europe and in the U.S. according to different investor types are reported in Table 2. As underlined by Mayer et al. (2005), the broad evidence reported in table 2 masks large cross-sectional geographical differences. They report larger proportions of bank VC in Germany, of corporate VC in Israel, of pension funds (assimilated to bank VC in our analysis as they act as a maturity transformation vehicle) in the United Kingdom, and of government VC in the U.K. as well. Evidence from the U.S. shows a greater commitment from endowments and foundations (more than 20% of the VC funding) and the virtual absence of government-sponsored venture capital (NVCA, 2004).
Insert Table 2 here
We use superscripts ind, crp and bnk for the Independent, Corporate or Bank-sponsored types of investors, respectively, for further analysis.
in that the public investor motives go beyond profit maximization. Its analysis requires further assumptions related to social welfare criteria, and is left for future research.
3
Characterization of preferences
Unlike the entrepreneur for whom the project scale represents a substantial fraction of her endowment, the professional investor considers the project as a building block in her financial portfolio. For any profit-maximizing investor with a well-diversified portfolio, the purpose of the investment is to provide the fund’s shareholders the highest possible surplus over invested capital. The rationale underlying this reasoning is the fact that, from Tobin’s separation theorem, financial investors dissociate their risky investment decision from their financial leverage. Only the latter decision depends on their level of risk tolerance. The only aim of the risky vehicles they invest in is to provide the highest possible residual income, i.e. the surplus over the opportunity costs of their funds. Consequently, the profit-making VC fund’s utility function can be written as the expected cash flow less the dollar-cost of capital of the venture, i.e.
Ui(S, τ ) = CFi = (K − S) (rπ − µi) − (1 − S)
¡
τ − κi¢, i = ind, crp, bnk, (6) where µi and κi represent the opportunity cost of equity and the opportunity cost of risk-free financ-ing/investment, respectively, which can differ from one investor to another. The first term is the VC’s net expected profit from the venture, while the second term accounts for the transfer to the entre-preneur. As this utility function is expressed in terms of net cash flow, the corresponding reservation utility Ui
φ is set to zero for all i.
Next, we turn to the identification of the opportunity costs applicable to each investor.
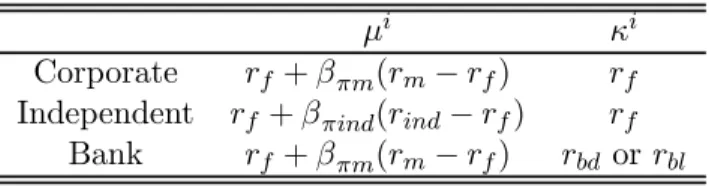
• The independent venture capital fund, with superscript ind, is held by a number of committed private investors. They view the fund as an actively-managed overlay to their current portfolio, whose aim is to provide a superior Sharpe ratio to a portfolio of traded assets. Hence they assess the project in light of its contribution to the whole risk and return profile of the fund. The cost of equity capital is thus µind= rf + βπind(rind− rf), where rind and βπind stand for the fund’s
• The corporate venture capital fund, with superscript crp, represents a large pool of shareholders who are well-diversified. Therefore, in line with Kerins et al. (2004), any investment opportunity is assessed according to its position relative to the security market line. The corporate venture capitalist has otherwise the possibility to borrow or lend on financial markets at the riskless rate.
• The bank-sponsored venture capital fund, with superscript bnk, is a subsidiary of a regulated financial institution. The bank-sponsored venture capitalist starts with no initial endowment but gets funding from its parent institution. It can count on the contractual amount 1 − S transferred from the entrepreneur via a deposit account at the parent bank (if S < 1) or via a loan contracted at the bank (if S > 1). Being a financial intermediary, the bank can finance loans and invest deposits at better conditions than the market risk-free rate rf.9 We denote
rbf = ⎧ ⎪ ⎨ ⎪ ⎩ rbl > rf if S > 1 (loan) rbd< rf if S < 1 (deposit) (7)
In line with their status, we assume that both the parent and the subsidiary are subject to regulatory capital constraints. Namely, to participate in the venture, the fund has to withdraw the full investment from the parent’s equity. As the parent institution is itself fully diversified, we get the cost of equity capital according to the CAPM as for the corporate venture fund.10
Table 3 summarizes the inputs for the various investors’ utility maximization programs.
Insert Table 3 here
We now characterize and contrast the sets of contracts between the entrepreneur and the different categories of investors.
9This rate applies regardless of whether the bank-sponsored VC offers the investor to lend or borrow
by the parent’s office or whether it negotiates a dilution factor d that will be financed through deposits or invested in loans anyway.
1 0Alternatively, we could refer to Pillar I of the Basle III Accord to obtain that the regulatory capital
4
Characterization of contracts
4.1
Feasible contracts
There exists a continuum of possible contracts (S, τ ) between the entrepreneur and each type of investor, depending on their relative bargaining powers. We will examine the extreme conditions, when either the investor or the entrepreneur can impose the terms of the contract, to assess the scope of feasible contracts.
The entrepreneur-dominant contract with investor i, is denoted (S[e,i], τ[e,i]). It corresponds to the pair (S, τ ) that maximizes the entrepreneur’s utility while satisfying the investor’s participation constraint. Oppositely, the corresponding investor-dominant contract (S[i,e], τ[i,e]) maximizes the in-vestor’s utility while binding the entrepreneur’s participation constraint.
The following proposition11summarizes the characteristics of the non-degenerate contracts (S 6= 1):
Proposition 2 If µi− κi 6= γeσ2
π, a non-degenerate contract (S∗i, τ∗i) between the entrepreneur and
the investor i is feasible when the following condition is respected:
τ[e,i] > τ∗i> τ[i,e] if S∗i< 1 and τ[e,i]< τ∗i< τ[i,e] if S∗i> 1, where τ[e,i] ≡ κi+K − S ∗i 1 − S∗i(rπ− µ i), τ[i,e] ≡ U e φ,π− S∗irπ+12γe ¡ S∗i¢2σ2π 1 − S∗i ,
and where the entrepreneur’s optimal level of investment S∗i is the same for any contract and is given by
S∗i= S[e,i]= S[i,e]= min µ µi− κi γeσ2 π , K ¶ , with, for the bank-sponsored VC, the additional condition that:
γeσ2π+ rbl< rf + βπm(rm− rf) or γeσ2π+ rbd> rf + βπm(rm− rf). 1 1All proofs are gathered in the appendix.
Proposition 2 yields a Corollary with a strong economic relevance.
Corollary 3 If the entrepreneur self-finances the venture, then any venture capital contract is feasible in that it leaves both parties better-off.
Before contracting, the entrepreneur has proprietary access to a project with risk-return profile (σπ, rπ). In one extreme case where the entrepreneur has all the bargaining power
(entrepreneur-dominant case), she and the venture capitalist will agree on the rate of transfer τ[e,i], which allows her to shift her utility score from Uφe to Umaxe . In the other extreme case where the venture capitalist has all the bargaining power (investor-dominant case), they will agree on the rate of transfer τ[i,e], which
leaves the entrepreneur to the same initial utility score Uφe (since the investor captures all the benefits of the contract). In all cases, both parties agree on the same entrepreneur’s level of investment S∗.
The optimal share of the entrepreneur is constant regardless of the contract. This share only differs with the identity of the investor. Two extreme cases require some discussion: the corner solution S = K and the no-transfer solution S = 1.
In the first situation, the entrepreneur takes over the whole project, and borrows money from the investor. Note that Ue(K, r
f) = Uφe. As stated in Table 2, there is no investor who offers a lending
rate lower than rf, so there simply is no contract. Indeed, if the investor’s risk premium µi− κi is too
high relative to the preference-adjusted risk of the project γeσ2π, then there is no feasible contract. In this case, the venture yields an attractive risk profile for the entrepreneur (low denominator of S∗i), while it is costly to finance for the investor (high numerator), who then steps away.
The second situation is more insightful. The special case µi− κi = γeσ2
π is the one where the
marginal cost of the project is equal to its marginal benefit for the entrepreneur, and so she merely gives up the share of the project that she cannot finance herself. There is no transfer and thus no dilution in that particular case.
For the bank-sponsored VC, the additional condition implies that situations where the lending rate is very high or when the deposit rate is very low precludes the bank’s financial intermediation.
In those situations, any transfer would become unacceptable for the entrepreneur who would receive too little money for her deposits or would pay too much interest for her borrowing. In these cases, the only feasible contract would be the degenerate one (1, 0) which is feasible if rπ− 12γeσ2π ≥ Uφ,πe .
Thus, this contract is much more than a curiosity, as it is likely to prevail in a wide variety of market situations.
Corollary 3 shows that the entrepreneur would prefer to contract rather than undertaking the project on her own. The rationale underlying this result is straightforward. The linear shape of the utility function of the investor enables the entrepreneur to get rid of a share of the project’s risk in exchange of a proportional premium. On the other hand, the concavity of the entrepreneur’s utility function provide a gain in expected utility from risk sharing which is more than proportional to the loss in returns. This implies that the presence of venture capitalists always induces the entrepreneur to seek for a risk sharing contract to get venture capital financing. Indeed, as any feasible contract satisfies the investor’s participation constraint, then both the entrepreneur and the investor are better off with the contract than with their initial investment choice.
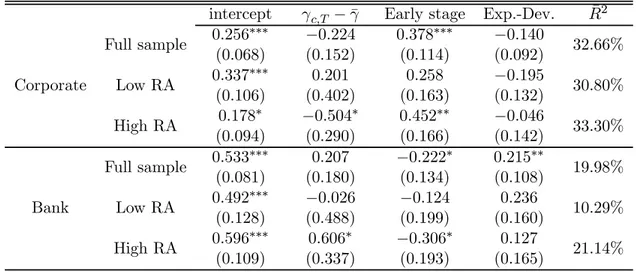
Insert Figure 1 here
Figures 1a and 1b provide a graphical representations of the feasible contracts between the entre-preneur and the venture capitalist. In Figure 1a, the utility score of the project is not sufficient to induce the entrepreneur to shift her money away from the initial financial portfolio. The availability of a VC contract is powerful enough to shift up the expected utility, leading to a portfolio whose risk is S∗iσπ and that intersects the straight line relating¡0, τ[i,e]¢to (Kσ
π, rf + K(rπ− rf)) . In the
investor-dominant case, the entrepreneur has access to a lending rate which is just high enough to make her indifferent with the initial financial portfolio. If the bargaining power of the entrepreneur increases, she can manage to raise her utility further, up to the moment when the investor’s partici-pation constraint becomes binding. This situation corresponds to the upper segment originating from point (Kσπ, rf + K(rπ− rf)) in the figure.
The idea put forward in Corollary 3 is best illustrated in Figure 1b. The project is attractive as it clearly stands above the Capital Market Line. If the entrepreneur could self-finance the project, she would increase her utility level, but in the absence of venture capital, she is financially constrained and can only obtain the utility score Uφe derived from investing on financial markets. Nevertheless, the availability of a VC contract enhances the level of expected utility, up to the maximum achievable indifference curve Umaxe corresponding to the entrepreneur-dominant contract, as shown by the arrow represented on the figure.
This finding sheds new light on the discussion provided by Schwienbacher (2007) about the en-trepreneur’s choice between the "just-do-it" versus the "wait-and-see" strategy. In our model, where access to the venture capital market is assumed to be readily available to the entrepreneur and the project is found to be good, the "just-do-it" (adventurous) strategy of immediately investing in the project and attracting the complement through venture capital, is indeed always the best choice. It holds irrespective of the entrepreneur’s risk aversion, which can be related to the entrepreneurship style. Individuals pursuing the "wait-and-see" strategy can only do it rationally if they do not fit into our framework. This means that their decision to wait before investing in the venture would not be driven by some reluctance to share the venture’s profits with an external investor, but rather by the fact that the project is not ready for investment and they could not attract a venture capitalist.
We turn to the discussion of feasible contracts and the comparison of contracts with different types of investors. This analysis of existence of feasible contracts and the comparison of contracts with different types of investors is instructive about the properties of the venture capital markets in a portfolio theory approach.
4.2
Contracting preferences
We first characterize the solution of the bargaining game between the entrepreneur and the investor. Next, we study the determinants of contracting preferences with the three types of investors.
4.2.1 Optimal contract design
The project is specific to the entrepreneur, but there are three possible kinds of investors she can contract with. Thus, two facets characterize the optimal contract design: the choice of the contractor and the terms of the contract.
If all the bargaining power lies within the hands of the entrepreneur, she will choose to contract with the investor that enables her to maximize expected utility while binding the investor’s participation constraint. Therefore, the program to maximize is
U[e,¯ı]= max
i=ind,crp,bnk
h
Ue(S∗i, τ[e,i]) − Uφ,πe i s.t. Ui(S∗i, τ[e,i]) = 0. (8)
In the mirror case, the investor maximizes net cash flows while imposing a level of utility to the entrepreneur. If each investor competing for the same project is able to dictate the contract to the entrepreneur, the winner will be the one for whom the surplus extracted from the contract is highest. The resulting level of utility for the investor achieving the largest net return is given by:
U[¯ı,e]= max
i=ind,crp,bnkU
i(S∗i, τ[i,e]) s.t. Ue(S∗i, τ[i,e]) = Ue
φ,π. (9)
Between these two extreme cases, the entrepreneur and each type of investor enter a bargaining game.12 We adopt the solution proposed by Fan and Sundaresan (2000) to solve for the surplus split between the entrepreneur and the investor. Specifically, denoting η as the entrepreneur’s bargaining power, and 1−η as the investor’s bargaining power, the Nash solution to the bargaining game between the entrepreneur and investor i is the sharing rule that maximizes the following surplus
G(S∗i, τ∗i; η) =£Ue(S∗i, τ∗i) − Uφ,πe ¤η£Ui(S∗i, τ∗i)¤1−η. (10)
Note that the optimal contract design involves two objectives: (i) for a given investor, finding the optimal contract terms¡S∗i(η), τ∗i(η)¢as a function of the bargaining power η; and (ii) determining
1 2To simplify the optimal contract derivation, we abstract from competition effects that would result
the kind of investor for whom the game output is maximized. So the objective function is
max
i=ind,crp,bnk Smax∗i,τ∗iG(S
∗i, τ∗i; η). (11)
Given the optimal share of the venture determined in Proposition 2 and the range of transfer rates that corresponds to each type of investor, we can characterize the optimal contract terms and the optimal investor choice altogether, provided that there exists an interior solution for S∗i, through the following Proposition.
Proposition 4 If the entrepreneur can enter a non-degenerate venture capital contract with any type of investor, the solution of the Nash bargaining game in equation (10) with 0 ≤ η ≤ 1 is given by
S∗¯ı(η) = S∗¯ı= µ ¯ı − κ¯ı γeσ2 π , τ∗¯ı(η) = ητ[e,¯ı]+ (1 − η)τ[¯ı,e], ¯ı = arg max i=ind,crp,bnk à κi− Kµi+ ¡ µi− κi¢2 2γeσ2 π ! with µ i− κi γeσ2 π < K.
In particular, G(S∗¯ı, τ∗¯ı; 1) = U[e,¯ı] and G(S∗¯ı, τ∗¯ı; 0) = U[¯ı,e].
The determinants of the optimal investor choice involves a mix of investor, project and entrepreneur-related elements. The function to maximize provides the impact of the characteristics that differentiate investors, namely µi and κi, in case of an interior solution. It is straightforward to see that, ceteris paribus, their impact are both indeterminate on the entrepreneur’s preferences, depending on the values taken by the triplet (K, γe, σ2π). This result calls for a closer look at the possible contracts, as discussed hereafter. The situation where µγie−κσ2i
π ≥ K corresponds to the corner solution in which
S∗i = K, where we have seen that the entrepreneur would indeed be at least as well off with her financial portfolio φ.
Conditionally on the optimal investor choice, the optimal contract characteristics bear a simple and intuitive form. As the entrepreneur’s proportion invested in the project is constant whatever the bargaining power, her relative strength in the negotiation shows up only in the transfer rate. Given the
structure of the game, the equilibrium transfer rate is a weighted average of the two extreme values that bind the corresponding participation constraint. In other terms, each counterparty’s share of the surplus created by the presence of a VC investor is strictly proportional to their bargaining power. Such a simple structure appears very useful in light of equation (3), that displays a linear relation between the transfer rate and the dilution factor in VC investment contracts. It is obvious that the level of entrepreneur’s dilution in the ownership of the project is an indicator of her bargaining power. What Proposition 4 shows is that, knowing what is the range of dilution factors acceptable by the entrepreneur and the investor, the dilution level is directly proportional to their bargaining power.
Proposition 4 can also be viewed as a separation theorem regarding the optimal contract. It shows that the proportion of wealth invested in the project, S∗¯ı, is only a function of the investor’s risk premium µ¯ı− κ¯ı, the entrepreneur’s risk tolerance, and project risk. This proportion is independent of η. The subsequent dilution in the entrepreneur’s equity stake is only reflected in the transfer rate τ∗¯ı(η), which depends on bargaining power. Such a finding holds very strongly. It entails that, whatever the bargaining power of the entrepreneur, she will invest a larger proportion in the project if its risk is lower or if her outside wealth is larger (through a concurrent reduction in the risk aversion parameter γe). Bitler et al. (2005) derive a similar prediction in the context of an agency theory framework. This is also consistent with the signaling approach of Leland and Pyle (1977). But unlike both streams of research, our results are derived in a framework of symmetric and homogenous information.
Note that the expected rate of return of the venture, rπ, has strictly no impact on the contracting
preferences. Yet, this rate is relevant as it drives the feasible character of each contract.
4.2.2 Determinants of investor selection
Proposition 4 provides a general framework to compare contracts with the three sources of venture capital and the initial portfolio. From Table 2, the corporate VC shares one characteristic with the other two types of investors: it bears the same cost of equity capital as the bank-sponsored VC,
while it has access to the same riskless rate conditions as the independent VC. Thus, it is logical to perform two-by-two comparisons with the corporate venture capital fund as one branch of the alternative, the other branch being (i) the initial financial portfolio, (ii) the independent VC and (iii) the bank-sponsored VC. These comparisons are done through the following corollaries.13
Corollary 5 If the entrepreneur does not self-finance the venture, she will strictly prefer to contract with the corporate venture capital investor over her initial portfolio iff
γe > γe ≡ 1 − ρ 2 πm 2K(rπ− rf − βπm(rm− rf)) µ rm− rf σm ¶2 .
This Corollary has to be interpreted together with Proposition 1 and Corollary 3. From these two results, we know that for 0 < γe≤ γe, the entrepreneur would self-finance the venture (Proposition 1)
but would indeed even prefer to contract with a venture capitalist (Corollary 3). On the other hand, Corollary 5 tells us that for γe> γe, the entrepreneur would like to contract as well. Thus there would be no feasible contract if the project is such that γe> γe.
Corollary 6 The entrepreneur will strictly prefer to contract with the corporate over the independent venture capital investor iff
⎧ ⎪ ⎨ ⎪ ⎩ µind< µcrp if 12¡µind+ µcrp¢> rf + Kγeσ2π µind> µcrp if 1 2 ¡ µind+ µcrp¢< r f + Kγeσ2π
Corollary 6 presents a very counter-intuitive result. To enter a contract, the entrepreneur only has to verify that her participation constraint is verified. It would be natural to expect that she would choose the investor i whose cost of equity investment µi is lower, so that binding the investor’s
participation constraint could be done at a cheaper cost and thus the return on investment would be greater. But a lower µiinduces a reduced entrepreneur’s optimal stake in the venture S[e,i](Proposition
1 3For simplicity of the exposition, we restrict the analysis to the interior solution S∗i= µi−κi γeσ2
π . The
case where S∗i= K is not very interesting as, from Proposition 4, the analysis boils down to seeking the investor whose cost of funds κi is the lowest.
2). Therefore, µi has opposite impacts on the quantity of invested funds and the rate of return on
this investment. The entrepreneur only prefers the investor with a lower cost of equity if the average risk premium for the competing venture capital investors — represented by (µ
ind−r
f)+(µcrp−rf)
2 — does
not exceed a risk premium reflecting the risk- and preference-scaled size of the project (the product Kγeσ2π). The average risk premium reflects the relative importance of the difference in costs of equity. If it is high, the absolute difference in costs of equity matters less for the entrepreneur’s decision. Then, she cares more about the surplus that can be reaped, represented by the size of the project K. She prefers to get a higher share S[e,i] proposed in the optimal contract, even though the corresponding
transfer rate τ[e,i]is less attractive. The product γeσ2π adjusts for the risk aversion of the entrepreneur. The higher the product, the less likely the choice of the investor with the greater value of µi, and the more important the cost saving effect over the surplus size effect.
In a realistic setup, most projects are such that the effect of project size dominates the inequalities, so that the project risk premium exceeds the average of the investor’s risk premia. In this case, the first condition of Corollary 6 holds. Furthermore, because of her disadvantage in diversification, the independent venture capital investor is likely to have a required return µindthat exceeds the one of the corporate investor. Under such circumstances, the entrepreneur has an incentive to address a corporate venture capitalist. In order to convince the entrepreneur to contract with her, the independent investor has two possibilities: (i) to reduce its cost of capital through a large diversification between the individual venture investments (i.e. reducing βπind), or (ii) to provide an extra rate of return that compensates for the loss in expected utility resulting from the higher cost of capital.
Corollary 7 The entrepreneur will strictly prefer to contract with the corporate over the bank-sponsored venture capital investor iff
(i) γeσ2π+ rbd> rf + βπm(rm− rf) or (ii) γeσ2π+ rbl < rf + βπm(rm− rf) or (iii) K (rπ− βπm(rm− rf)) − (K − 1) rf +( βπm(rm−rf)) 2 2γeσ2 π > rπ− 1 2γ eσ2 π.
Corollary 7 means that if the contract with the bank-sponsored VC fund is not degenerate (cases (i) and (ii)), then the entrepreneur would never want to contract with the bank-sponsored VC. Only if the intermediation margin rbl− rbd is high enough, neither of these conditions is satisfied, and the
bank could be freely chosen by the entrepreneur.
Unlike the independent investor studied in Corollary 6, the bank-sponsored venture capital investor does not have the possibility to weigh on its cost of capital. Thus, if the entrepreneur is dominant in the relationship, she will probably not knock on the banker’s door to impose a venture capital contract. In order to induce her to enter such a contract, the banker would have to accept less favorable conditions than with another venture capital investor. This view is consistent with a dynamic view of the banker-entrepreneur relationship proposed by Hellmann (2002) in which the banker tries to lock a durable relationship in order to foster its lending opportunities.
5
Numerical analysis
In this section we illustrate the results implied from Proposition 4 and its Corollaries 6 and 7. To this end, we need to rely on a base case parametrization that is discussed below.
5.1
Calibration
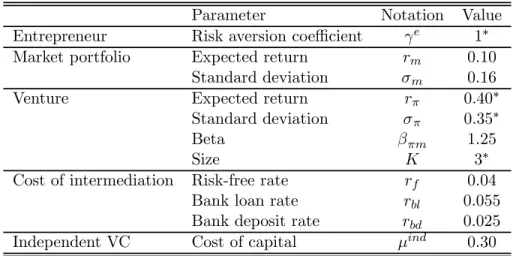
Entrepreneur’s risk aversion Several contributions propose a methodology for estimating investor’s attitude towards risk. But we should keep in mind that entrepreneurs should by definition be less risk averse than average individuals. Tarashev et al. (2003) show that the risk aversion coefficient implicit from S&P options varies from 0 to 2. Bliss and Panigirtzoglou (2004) obtain a range from 0 to 4.4, but the upper bound decreases to less than 1.3 after removing the five largest stock return volatility changes. Based on the empirical distribution of terminal payoffs from venture-capital backed projects, Hall and Woodward (2010) induce that a risk aversion coefficient of 2 makes the entrepreneur indifferent between launching the venture or not. We therefore set γe = 1 for the
base case and take a value of 2 as an upper limit for our simulations.
Market portfolio We follow Kerins et al. (2004) who estimate an annual standard deviation of S&P500 index returns of 16.2% over the last 20 years and use a 10% market rate. Therefore, we set rm = 0.1 and σm = 0.16.
Venture characteristics One way to proxy for K is to divide the value of the venture’s assets by the book value of entrepreneurs’ equity (interpreted as their historical cost of acquisition of the project). From Bitler et al. (2005), Table II (who use National Survey of Small Businesses data), this ratio is worth 2.8 if we take mean values. It remains the same if we take median values.
Gompers and Lerner (1997) study the investments of a single venture capital firm and measure an average annual return of 30.5% gross of fees from 1972 to 1997. Cochrane (2005) estimates the arithmetic average returns of his sample venture capital projects at 59%. In their study of venture capital investments across five European countries, Manigart et al. (2002) obtain estimates of required returns from early-stage VC investments that range between 36% to 45%. Accordingly, we set rπ =
40%. Kerins et al. (2004) rely on the CAPM to estimate the cost of capital for an entrepreneur. They find that the average correlation between a sample of 2,623 early stage firms’ equity returns and S&P500 returns is 0.195. The standard deviation of their sample firms’ equity returns is 102.4% (see their table 4). Consistent with these figures, the value of βπm is set equal to 0.2 × 100/16 = 1.25. Dividing the value of the standard deviation of equity returns by the average project size of 2.8, we finally obtain σπ = 35%.
Cost of intermediation Demirgüç-Kunt et al. (2004) report a net interest margin for G7 countries between 2.03% (Canada) and 4.34% (the U.S.), with an unweighted average of 2.94%. We use these numbers as a proxy for cost of bank intermediation, which in our model is reflected by 2 |rf− rbf|. Assuming a risk-free rate of rf = 4%, we therefore set rbl = 5.5% and rbd= 2.5%.
Independent venture capitalist As for the entrepreneur, Kerins et al. (2004) obtain that her average cost of capital ranges from 31.1% to 57.5% depending on her degree of commitment in the venture. Assuming these figures also apply to the partially diversified independent VC, we set rf + βπind(µind− rf) equal to 30%.
Table 4 summarizes our model calibration.
Insert Table 4 here
5.2
Feasible contracts
Figures 2 and 3 provide numerical illustrations of Proposition 2. The upper and lower bounds for the optimal transfer are plotted against project characteristics (expected return and volatility) as well as against entrepreneur’s risk aversion and project’s size relative to entrepreneur’s wealth. Figure 2 reports the case of the corporate VC while Figure 3 reports that of the independent VC (the case of the bank-sponsored VC is very close to that of the corporate and is therefore not reported).
Insert Figures 2 and 3 here
As expected, the higher the project volatility or the higher the entrepreneur’s financial constraint, the greater room for agreement between the VC and the entrepreneur (i.e. the wider is the band for the optimal rate of transfer). A similar result holds for entrepreneur’s risk aversion. Note however, that the space for feasible contracts does not depend on project expected return (see Figures 2a and 3a). Interestingly, if project size gets a bit low (see Figure 3d), then there is no more contracting possibility between the independent VC and the entrepreneur.
5.3
Investor selection
Figure 4 illustrates the entrepreneur’s contracting preferences highlighted in Proposition 4 and Corol-laries 6 and 7 as far as investor selection is concerned. Parameters are those of Table 4. For various
degrees of entrepreneur’s risk aversion, Figure 4 reports the optimal choice of venture capitalist in the space of project characteristics (K, σπ).
Insert Figure 4 here
Each figure produces the same type of output. Using our base-case parameterization, they show three types of tendencies: (i) corporate-backed VCs tend to be favored for the riskiest projects, espe-cially the larger ones; (ii) independent VC funds tend to invest in the least risky projects, irrespective of their size, and in the smallest projects, irrespective of their risk; and (iii) bank-sponsored VC investors have a window of large, middle-risk projects.
Such findings are broadly in line with the empirical literature devoted to the determination of VC adequacy to project types. On a pure U.S. sample, Hellmann et al. (2008) find that bank-dependent VCs invest less often in early rounds and they engage more in larger deals than other types of VC firms. These authors posit an underlying explanation related to relationship banking. The bank-sponsored VC is supposed to try to invest in firms in which the entrepreneurs may demand loans in the future. In their study on a detailed sample of German VC-backed companies, Hirsch and Walz (2006) also conclude that venture capital investors that are not backed by a bank tend to finance more innovative projects. Mayer et al. (2005) carry out an empirical investigation on four countries (Germany, Israel, Japan and the U.K.). Using a granular classification of VC investor types on the basis of funding sources, they find robust evidence that corporate and independent VCs prefer to invest in early-stage projects, typically characterized by high risk and/or low size. By contrast, funds whose funding comes from banks, insurance companies and pension funds favor late-stage projects. Although each country’s financial system widely differs in their sample, they do not find any evidence that these differences explain observed variations in funding sources in their sample. Note that all empirical predictions focus on the dichotomization between bank and non-bank sponsored investors. Beyond the large consistency of our predictions with this stream of literature, we also bring a rationale for a strong segmentation of project financing between corporate and independent VC funds.
Besides evidence on project segmentation by investor type, the comparison of the graphs in Fig-ure 4 reflects the influence of risk aversion on VC investor choice. The effect of an increase in the entrepreneur’s risk aversion on the likelihood of contracting with the independent and corporate is clear-cut. Whatever the distribution of project size and risk, and considering the pure effect of a change in the representative entrepreneur’s risk aversion, a more risk averse entrepreneur (i.e. higher γe) ends up being more likely to contract with a corporate VC investor than with an independent one. The impact on the bank-sponsored VC investor is less obvious. The lower and the upper bound of the zone of bank-sponsored fund contracting preference both increase with the level of risk as risk aversion increases. Therefore, if project risk is relatively high, a greater risk aversion will lead to a greater likelihood of a bank-sponsored VC implication. The opposite holds for low levels of project risk. More risk averse investors would then tend to look for an independent VC fund rather than a bank-sponsored one.
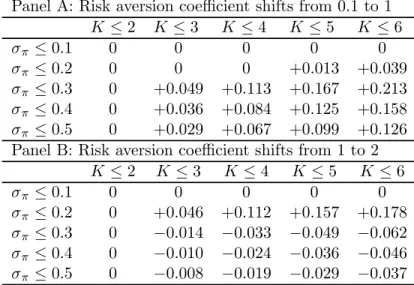
Table 5 clarifies the relation between the likelihood of contracting with the bank-sponsored VC and the entrepreneur’s risk aversion for different levels of project size and risk. It shows the evolution of the relative market shares for the three types of investors as K and σπ gradually increase.14
Insert Table 5 here
As shown in Table 5, the bank-sponsored VC market shares increase with entrepreneur’s risk aversion coefficient (across all project sizes and risks) for small values of γe. However, this behavior is reversed for high values of γe.
Insert Figure 5 here
Figure 5 provides an additional illustration of Corollaries 6 and 7. It shows the difference in surplus between the corporate VC contract and the independent VC contract (Figure 5a) and between the corporate VC contract and the bank-sponsored VC contract (Figure 5b). With parameters as given as in Table 4, we obtain µcrp = 0.115 < µind = 0.3. As stated by Corollary 6, the entrepreneur will
prefer contracting with the independent VC as long as 1
2 ³
µind+ µcrp´> rf + Kγeσ2π,
which is true for small values of K and/or small values of σπ. But as project size and/or project risk
increase, the former condition will not hold anymore and preference will be given to the corporate VC, as shown by Figure 5a.
Similarly, parameters of Table 4 induce that S∗ < 1 and the bank will offer a deposit account at rate rbd. According to Corollary 7 part (i), the entrepreneur will prefer the corporate VC contract
over the bank-sponsored VC contract iff
γeσ2π+ rbd> rf + βπm(rm− rf),
which translates into a lower bound condition for project risk, as shown by Figure 5b.
Note that the magnitude of surplus difference is much smaller between the corporate VC and the bank-sponsored VC (Figure 5b) than between the corporate VC and the independent VC (Figure 5a). Combined with the empirical evidence quoted above, this might indicate that the main source of reported differences between the use of financing sources arises because of the bank-sponsored vs. independent VC dichotomy. When matched with the independent VC fund, the bank and corporate investor types look very much alike. From the pure funding cost approach that we adopt, the most adequate approach to clustering venture capital types should probably be a distinction "independent versus bank and corporate", while empirical papers have mostly adopted a "independent and corporate versus bank" type of approach.
5.4
Dilution factor
In this subsection we analyze the endogenous dilution factor as obtained from the optimal transfer rate from Proposition 4 and retrieved from equation (3). Figure 6 displays the dilution factor in the (K, σ) space. As far as the base case is concerned, the venture is financed by a bank-sponsored VC
and the optimal transfer rate is 1.34, which is equivalent to a dilution factor of 3.07. Insert Figure 6 here
We see that contracting with the independent VC yields a dilution factor of one. When dealing with the bank-sponsored VC, the entrepreneur obtains a favorable (i.e. strictly greater than one) dilution factor that is convex in project size and relatively constant in project risk. Finally, with the corporate VC, the endogenous dilution factor becomes linear in both project size and project risk.
6
Empirical analysis
Even though they bring some geographical variety in their sample, Mayer et al. (2005) confess that their results regarding the determinants of financing choice remain puzzling in that "a large proportion of variation within as well as between countries is unrelated to sources of finance. Moreover, differences in the relation between funding source and VC activity are unrelated to the country’s financial systems." A potential solution of this puzzle is provided by the link that exists between the prevailing level of risk aversion on a given market and the partitioning of investments by VC type. For the same spectrum of projects, a country in which risk aversion is stronger witnesses greater investment opportunities seized by corporate VC investors, less by independent VC investors, and more or less by bank-sponsored funds, depending on the distribution of project size and risk as discussed in the previous section.
The aim of this section is to test some of the main predictions of the model. We focus on the influence of the entrepreneur’s risk aversion as this dimension has, to our knowledge, not yielded any specific predictions regarding financing choices in the literature to date. We first confront our model-inferred project characteristics with country-level evidence. Next, we investigate the link between entrepreneur’s risk aversion and VC investor type contracting preferences. Finally, we analyze the model implications in terms of VC stage financing.
We carry out the analysis on a panel of European countries. Yearly fund flows between 2002 and 2009 are obtained from the European Venture Capital Association (EVCA). Thanks to the aggregation
of country-specific data performed at the level of the EVCA, this sample benefits from a homogenous data collection methodology and classification. Furthermore, the categorization proposed by the EVCA focuses on the funding sources and not on the allocation of actual investment by VC type. The latter approach would classify funds around their organizational structure and control rights. As we differentiate investors solely on the basis of the costs of their funding sources, an organizational or control-based partitioning would not be justified.
Consistent with previous empirical evidence by Mayer et al. (2005) on European data, but also on our interpretation of bank-sponsored investors, we consider that banks, insurance companies and pension funds constitute a homogenous group under the umbrella of "bank-sponsored" investors. In-dependent VC investors gather sources from individuals, family offices and capital markets. Corporate VC investors encompass all other sources except the ones coming from public authorities, namely cor-porations, academic institutions, endowments and foundations, funds of funds, other asset managers, and others. Because governments are not counted but represent a substantial level and variability, the sum of bank-sponsored, independent and corporate VC types is inferior to one and enjoys considerable variation over country and time.
The estimation of the entrepreneur’s risk aversion coefficient on each market relies on an approxi-mation using stock market data. This approach is justifiable by the fact that the representative stock market investor’s risk aversion reflects the risk attitudes of an equity investor. Even though this is presumably a strongly downward biased estimator for the overall population, it may be a reasonable proxy for the risk tolerance of the actual entrepreneur. This is the population under review in our study, since we are only interested in contracting preferences for actual venture investments. Following Bliss and Panigirtzoglou (2004), yearly risk aversion coefficients of the representative agent are esti-mated by regressing daily stock index returns on the changes in the daily VIX (or equivalent) implied volatility index:
where index c stands for the country under consideration, T is the calendar year of the regression, and γc,T is the estimator for the representative agent’s relative risk aversion coefficient.15 Daily stock market data is collected from Thomson Financial Datastream for the 2001-2009. For this time period, only seven European markets display complete and continuous series for implied volatility indices: the United Kingdom, France, Germany, Switzerland, the Netherlands, Finland and Austria. We discard the latter two countries because of too little liquidity on their stock market and lack of representativity of the venture capital investments during the period under study. The panel we create features five countries, which are the top five European countries by fundraising for the period 2005-2009.16 Taking
the most active countries represents the best guarantee of having a reliable connection between the domestic market-implied risk aversion coefficient and the type of VC activity, be it domestic or foreign, originating from the same countries.
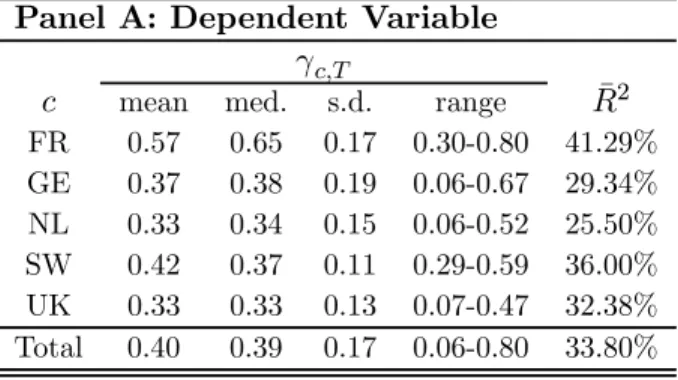
In order to enhance the significance of the empirical analyses, we perform the analysis on a two-year average risk aversion coefficient, thereby losing the first observation. This leaves us with a panel of 40 observations (8 years × 5 countries). The descriptive statistics of the sample are reported in Table 6.
Insert Table 6 here
Panel A presents the estimation results from equation (12). The results are of the same order as those of Bliss and Panigirtzoglou (2004) on U.S. data. They report a sample average of 0.40 as well. This is also in the same neighborhood, although slightly inferior, to the values obtained for the U.S., the U.K. and Germany, with a different methodology, by Tarashev et al. (2003) on a 1995-2002 time window. As expected, these values are much lower than the typical risk aversion estimates obtained in studies of the whole economy (see Bliss and Panigirtzoglou, 2004, for an overview).
1 5Adding an intercept to Bliss and Panigirtzoglou’s initial specification improves the fit, even though
its estimate is never significant in our sample. The RRA estimate reflects the absolute risk aversion coefficient for a normalized wealth of 1, as in our setup.
1 6Funding sources by country of management. See the EVCA Yearbooks from 2006 to 2010 for
Because we allocate a substantial fraction of funding sources to the bank-sponsored category, Panel B shows a dominance of that particular source of funds across time and countries. Nevertheless, we observe a large variability for all three independent variables, both cross-sectionally and over time. The correlations reported in Panel C indicate a large negative value between the proportion of independent invested funds, wind, and the risk aversion coefficient. The other correlations are moderate, except
between bank and corporate VC funds, which appear largely substitutes. This observation is consistent with our analysis of surplus in the preceding section, that showed a relatively small dichotomization between these two types of funding sources regarding the level of economic gain to extract from the contract.
6.1
Project risk and size characteristics
As a first check of our theoretical model, we first examine the risk and size profile of VC-backed projects as a function of the country-specific level of risk aversion. Using the median value for the estimated risk aversion coefficient per country, we can use our model to retrieve the range of project risk (σπ) and project size (K) that are consistent with the observed median shares of VC fund raising
per investor type.17 Results can be visualized in Figure 7.
Insert Figure 7 here
The model predicts that the most risky projects are undertaken in the United Kingdom while the least risky ones are in the French economy. There is little variation in the project minimal size across countries. However, the biggest ventures appear to be financed in the Netherlands and in the U.K.
Next, we independently gather information on the types of usage of the funds gathered. Until 2007, the EVCA classified VC funds on the basis of "expected allocation of funds raised" by stage (early stage/expansion-development) and by technological focus (high-tech/non high-tech). We aggregate the global funding by country from 2002 to 2007. We proxy for the importance of larger size projects by
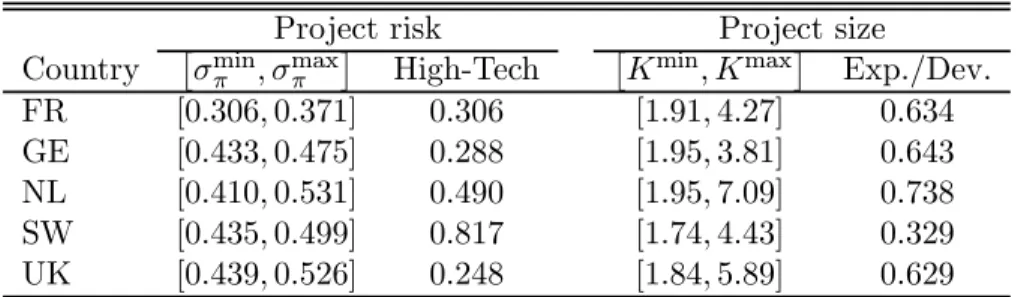
using the proportion of funds directed to expansion-development projects. Likewise, the proxy for the importance of riskier projects by using, within the expansion-development projects, the proportion of funds directed to high-tech projects. The results, together with the numerical translation of Figure 7, are reported in Table 7.
Insert Table 7 here
With such a limited sample size and as the figures result from successive approximations, it is not possible to perform statistical inference from this table. Nevertheless, the comparison of risk and size figures delivers an insightful impression of common variations. The correlation between the High-Tech figures and the estimated upper bounds of the rectangles, σmaxπ , is 26.4%. Similarly, the correlation between the Expansion-Development values and Kmaxis 46.8%. By contrast, the correlations between
σmaxπ and Exp.-Dev. and between Kmaxand High-Tech are -1.8% and 0.1%, respectively. Even though this analysis does not constitute statistical evidence, it suggests that there could be some link between the proportions of fund sources and the types of investments performed with these funds. According to our model, this link is influenced by the level of risk aversion specific to each country. This claim is to be formally tested in the next sub-sections.
6.2
Choice of investor type
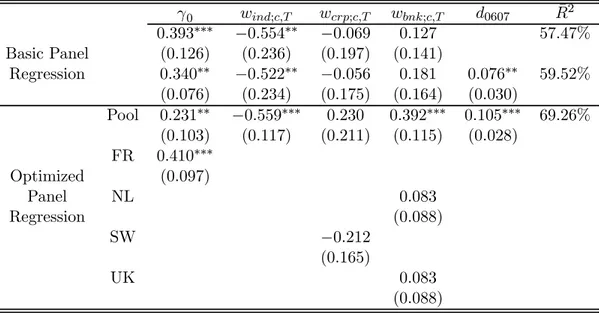
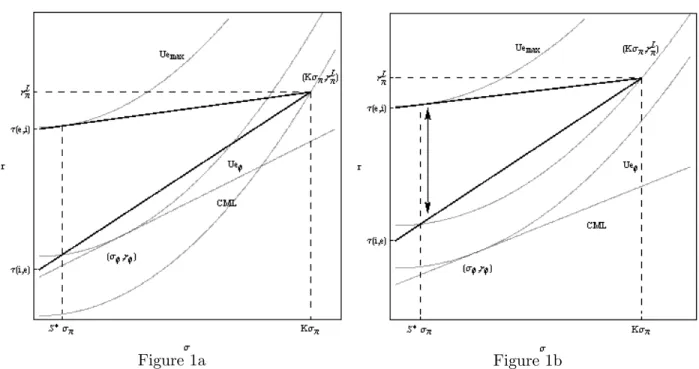
We now turn our attention to the direct impact of risk aversion on the choice of investor type. Naturally, the causal relationship to test is whether the entrepreneur’s decision to contract with a given investor type depends on her level of risk aversion. But through a multiple regression setup, we can assess the likelihood of choosing each investor type simultaneously based upon the entrepreneur’s attitude towards risk. To this end, perform a multiple linear regression of estimated risk aversion coefficients on fund flows for each type of VC.
The equation to test is
γc,T = γ0+ X
i=ind,crp,bnk