Which Scientific Elites? On the Concentration of Research Funds, Publications and Citations
Vincent Larivière, 1 Benoit Macaluso
Observatoire des sciences et des technologies (OST), Centre interuniversitaire de recherche sur la science et la technologie (CIRST), Université du Québec à Montréal, CP 8888, Succursale Centre-ville, Montréal, Québec, H3C 3P8, Canada. E-mail: lariviere.vincent@uqam.ca; macaluso.benoit@uqam.ca
Éric Archambault
Science-Metrix, 4572 avenue de Lorimier, Montréal, Québec, H2H 2B5, Canada and
Observatoire des sciences et des technologies (OST), Centre interuniversitaire de recherche sur la science et la technologie (CIRST), Université du Québec à Montréal, Montréal, Québec (Canada). E-mail: eric.archambault@science-metrix.com
Yves Gingras
Observatoire des sciences et des technologies (OST), Centre interuniversitaire de recherche sur la science et la technologie (CIRST), Université du Québec à Montréal, CP 8888, Succursale Centre-ville, Montréal, Québec, H3C 3P8, Canada. E-mail: gingras.yves@uqam.ca
Abstract
Using the population of all university professors (N=13,479) in the province of Quebec (Canada), this paper analyses the concentration of funding, papers and citations at the level of individual researchers. It shows that each of these distributions is different, citations being the most concentrated followed by funding, papers published and, finally, number of funded projects. Concentration measures also vary between disciplines; social sciences and humanities generally being the most concentrated. The paper also shows that the correspondence between the elites defined by each of these measures is limited. In fact, only 3.2% of the researchers are in the top 10% for all indicators, while about 20% are in the top 10% for at least one of the indicators. The paper concludes with a discussion of the causes of these observed differences and formulates a few hypotheses.
1 Address for correspondence
Vincent Larivière
Observatoire des sciences et des technologies (OST)
Centre interuniversitaire de recherche sur la science et la technologie (CIRST) Université du Québec à Montréal,
CP 8888, Succ. Centre-ville, Montréal (Québec)
H3C 3P8
Tel +1-514-987-3000 #6799 Fax +1-514-987-8733
2 Introduction
Since the creation of the Research Assessment Exercise (RAE) in Britain in the mid-1980s (Morgan, 2004) and the multiplication of university rankings in the 1990s, the question of the evaluation of researchers has become a hot topic of discussion in higher education (see, among others von Tunzelmann and Mbula, 2003; Adler and Harzing, 2009). In trying to identify the “best” universities or the “best” researchers, use is often made of “top” publications, grantees or citations. In this context, detailed knowledge of the properties of these various distributions has become important.
Distributions of researchers’ productivity and citations have been studied fairly extensively by early information scientists. For instance, as early as 1917, Cole and Eales analysed the distribution of researchers’ productivity in the discipline of comparative anatomy. A decade later, Lotka (1926) found that a minority of scientists were responsible for the majority of the scientific papers published. Similar patterns of concentration were also found for journals in which researchers published (Bradford, 1934) as well as for words used in language and texts (Zipf, 1949). With the development of the sociology of science and the advent of the Science Citation Index (SCI), these distributions were analysed in light of the inequalities of the reward system of science (Merton, 1973), the scientific elite (Zuckerman, 1977) and the debate surrounding the ‘Ortega hypothesis’ (see, among others, Cole and Cole, 1972; 1973; MacRoberts and MacRoberts, 1987). More recently, following Pratt (1977), bibliometricians such as Egghe (1988), Rousseau (1992) and Burrell (1991) worked on the mathematical aspects of concentration measures. More specifically, Allison (1980), Allison and Stewart (1974) and Rousseau (1992), using data on U.S. scientists, showed that citations were more concentrated than publications. Along the same line, Ioannidis (2006), Evans (2008) and Larivière, Gingras and Archambault (2009) provided empirical measures of concentration at the paper and journal levels. However, no study has yet combined, for a large population of researchers, measures of concentration of publications, citations and research funding.
Using a very large dataset of publications and citations for the full population of professors and university-based researchers in the province of Quebec (N=13,479), this paper presents concentration measures of research funding, publications and citations at the level of individual researchers. More specifically, this paper addresses the following research questions:
1) In which disciplines are research funding, publications and citations the most concentrated?
2) Which distribution (funding, publications or citations) is the most concentrated?
3) Do we find the same group of scientists in the top ranking for these measures of funding, scientific output and impact?
Two indicators are used to measure the concentration of research funding, publications, and citations. The first is the percentage of researchers who have published at least one paper or have received at least one citation over the 2000-2007 period. The second indicator is provided by the cumulative Pareto distributions (Lorenz curve) of funding, publications and citations. It shows the percentage of researchers who account for given percentages (20%, 50%, 80%, etc.) of the variable under study (funding, publications and citations). The lower the percentage of researchers needed to account for any percentage of a variable the more concentrated that variable is.
3 Methods
This paper draws on a very large dataset comprising funding, publication and citation data for each professor or university-based researcher in the Canadian province of Quebec over the 2000-2007 period (1999-2006 for funding). In order to compile such data, the list of all Quebec university researchers and professors (N=13,479) was provided by the Ministère du développement
économique, de l’innovation et de l’exportation (MDEIE) and Quebec’s three research councils.2 Coming from four different sources, this list included several double counts which were carefully eliminated. In addition to including the name (family name and given name) of each researcher, the list also includes each researcher’s university and department, which proved very helpful for the reconstitution of researchers’ publication files. Each professor and university-affiliated researcher in Quebec was categorized into one of nine disciplines that cover all disciplines of university research, which were adapted from the Classification of Instructional Programs (CIP – see Figure 1).3 A few professors who were affiliated with more than one department were counted in more than one discipline (N= 215).
745 783 833 976 1 167 1 543 1 566 1 913 4 168 Education Health Sciences Non-Health Professions Business & Management Engineering Humanities Social Sciences Natural Sciences Basic Medical Sciences
Number of researchers Figure 1. Number of researchers by discipline
About one third of the professors are active in basic medical sciences. The other important groups are researchers in the natural sciences, social sciences and humanities, each of these three groups being of comparable size. Non-health professions include researchers in planning and architecture, media and communications, social work, library and information science, and law. Health science researchers include those active in public health and health administration, kinesiology and so forth (see Appendix 1 for the list of specialties included in the various disciplines).
All bibliometric indicators in this paper are constructed using bibliometric data from Thomson Reuters’ Web of Science (WoS), which covers about 9,000 journals annually in all disciplines of the natural sciences, medicine, social sciences and humanities. This database list several types of scientific document but, as is customary in bibliometric studies, the statistics presented here are
2 Fonds de la recherche en santé du Québec (FRSQ), Fonds québécois de recherche sur la société et la culture
(FQRSC) and Fonds québécois de la recherche sur la nature et les technologies (FQRNT).
4 limited to articles, research notes and review articles, which are the generally considered as the main forms of original publication (Carpenter and Narin, 1980; Moed, 1996). Thomson Reuters’ databases do not cover all published research. Some scientific discoveries are diffused in non-indexed journals, but also in other types of document, such as conference proceedings, grey literature and books. Nevertheless, the WoS contains research that is published in core international journals, that is, journals that are most visible to international scientific communities and that have the highest citation rates in their respective specialties (Garfield, 1990).
In addition to the obvious fact that two or more researchers can have the same name, Thomson’s databases have two shortcomings when it comes to compiling statistics on individual authors. First, until very recently, bibliometric databases did not include the first names of authors of papers, but only their initials. In other words, in the bibliographic record of his papers, John William Dawson would appear as Dawson-JW or Dawson-J, creating many homographs, especially for very common surnames. The same applies for the citations John William Dawson might receive. The other limitation is caused by the fact that the WoS did not contain, at the time this research was done, any information on the relationship between authors’ names (Allen-PA, Smith,-J, etc.) and their institutional addresses (Laval University, University of Montreal, etc)4 Thus, for a given paper signed by John, Jack, Jane and Jacky and on which the universities of Laval and Montreal appear, it is impossible to know which researcher belongs to which research organization: indeed, several different combinations are possible.
Using, on the one hand, the surname and initials of professors and, on the other hand, the surname and initials of authors of Canadian scientific articles indexed by Thomson Reuters, a database of 125,656 distinct articles (and 347,421 author-article combinations) authored by these researchers and their homographs was created. When papers were written in collaboration, one paper was attributed to each of the co-authors. In order to remove the papers authored by homographs, each article was manually validated (assigned or rejected). To do that, we look closely at all papers contained in a file with a critical eye at their disciplines and their particular topics. The titles of the papers were often searched on the Internet to find the original paper where the complete name of the authors as well as the links between the authors and their institutional addresses could be found.
This time-consuming but essential step reduced the number of distinct papers by 51% to 62,026 distinct articles and by 70% to 103,376 author-article combinations. In order to have data on “inactive” researchers, non-publishing university researchers were kept in the dataset.5 On the whole, the 62,026 distinct papers received 1,189,423 citations over the 2000-2007 period (including self-citations). Hence, citations were counted only for the set of WoS-indexed papers published between 2000 and 2007.
A more complete approach would be to compile all the citations received by these authors including non-source material, such as books, and citations to source material published before
4 This was implemented in 2008 WoS data.
5 Although we know that Cole and Eales (1917) and Lotka (1926) did not include data on non-publishing
researchers—as they used a bibliographic database of papers published instead of a lists of researchers—it is not clear whether the survey performed by Allison and Stewart (1974)—and used in Allison (1980) and Rousseau (1992) included such researchers without any publication.
5 2000. Compiling citations to non-source material at the author level for such a large dataset would be prohibitively time-consuming and expensive and is therefore not practical (Butler and Visser, 2006). Counting citations to source material published before 2000 would have been possible but would have meant substantially increasing the work to be performed, which was already a time-consuming undertaking given the available resources.
The data on research funding comes from the Information System on University Research,6 which contains all funded research in Quebec’s universities and comprises data such as project titles, researchers’ full names, and funding sources and amounts. Matching this funding database with the list of university researchers and professors proved to be easier than matching bibliometric data, as both lists included a unique researcher ID to match each researcher to its funded projects. For a total of 133,273 distinct projects and CDN$6,760,445,931 in funding over the 1999-2006 period, 8,787 researchers had at least one project funded (65% of the listed researchers).
Results
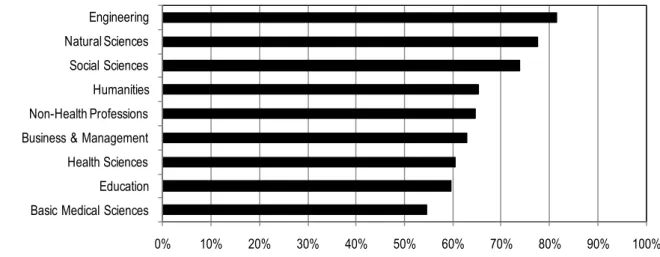
Figure 2 presents the proportion of researchers who received funding for at least one project during the 2000-2007 period. It is interesting to note that not all researchers receive funding from external sources (that is, in addition to their salaries). The discipline with the lowest proportion of funded researchers (55%) is basic medical sciences, with health sciences and education not far above with 60%. At the top of the scale, one can find engineering, where more than 80% of researchers received funding for at least one project. Such differences between disciplines can probably be explained by the presence of large research teams in the medical sciences, with few leaders securing the lion share of the funding as principal investigators and a greater proportion of researchers who are hierarchically dependent on them and, hence, have no funding of their own. Also many physicians affiliated to universities for teaching are not involved in research activities.
0% 10% 20% 30% 40% 50% 60% 70% 80% 90% 100%
Basic Medical Sciences Education Health Sciences Business & Management Non-Health Professions Humanities Social Sciences Natural Sciences Engineering
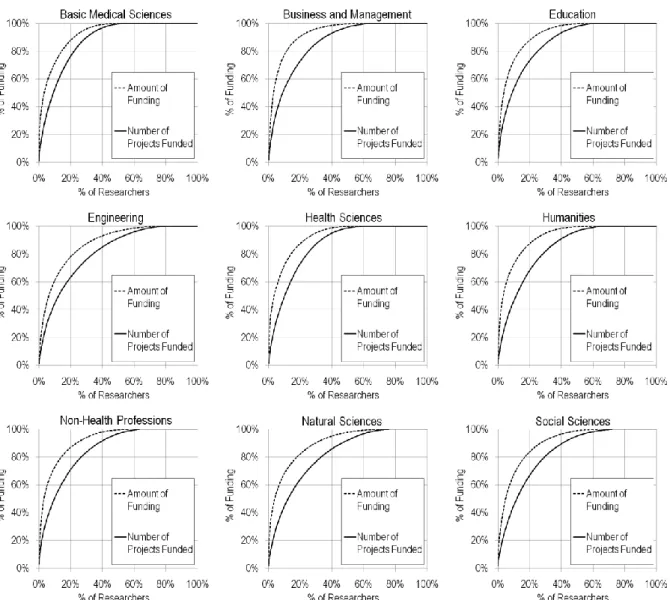
Figure 2. Percentage of researchers with at least one funded project by disciplines, 2000-2007 Figure 3 presents Pareto distributions (Lorenz curves) for the number of funded research projects as well as the total amount of funding (CDN$) by researcher. It is immediately obvious
6 Système d’information sur la recherche universitaire (SIRU). More details on the SIRU database can be found at
6 that, in every discipline, the dollar amount of research funding is considerably more concentrated than the number of projects funded, which is to be expected given the huge variability in the size of research grants. These data also show that funding is highly concentrated. For instance, 80% of research funds are concentrated between 11% and 18% of researchers except in engineering, the natural sciences and the social sciences, where the proverbial 80:20 rule can be observed. Business & management is the discipline where funding is the most concentrated. This can probably be explained by the fact that in these disciplines, many professors are more active in consultation than academic research based on peer-reviewed funding. As mentioned previously, the number of research projects funded is distributed much more evenly—especially in the natural sciences and engineering, where 33-34% of researchers can be found in 80% of the projects funded. These disciplines are followed, in increasing order of concentration, by the social sciences and humanities (SSH), and then health sciences and basic medical sciences.
Figure 3. Pareto cumulative distributions of research funding (amount and number of projects funded per researcher) by disciplines, 2000-2007
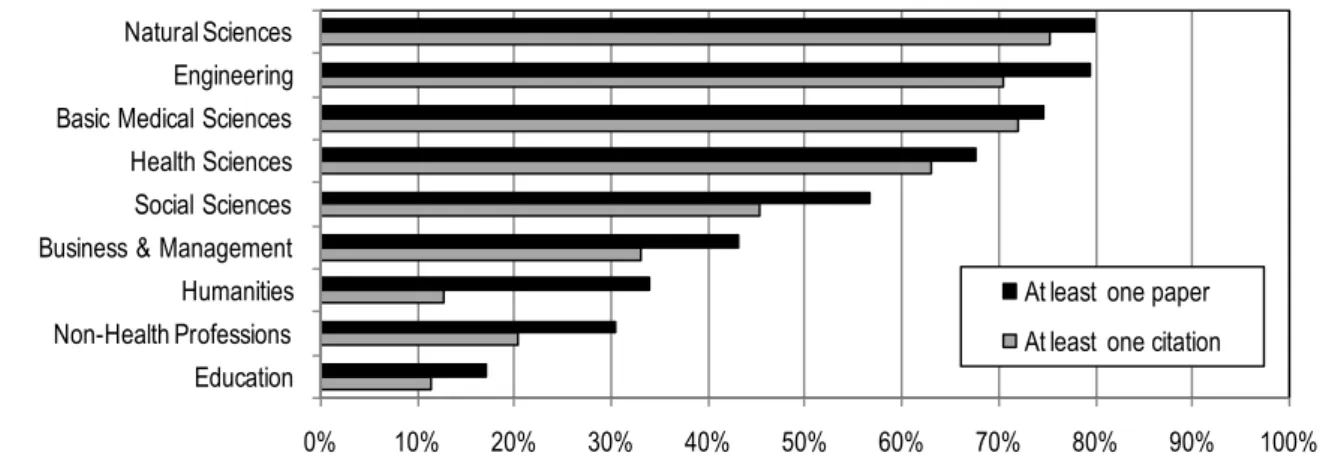
Figure 4 presents data on the proportion of researchers who have published at least one paper indexed in the WoS between 2000 and 2007 and the proportion of researchers who have received at least one citation to any one of these papers. As could be expected, the results vary
7 considerably between disciplines—much more considerably than the proportion of researchers who have received research funding. In one group of academic disciplines, comprising the natural sciences, engineering, basic medical sciences, health sciences and the social sciences, more than 50% of researchers have published at least one paper during the last eight years. However, disciplines like business and management, non-health professions, humanities and education present a substantially different picture, since less than 50% of researchers published at least one paper that was indexed in the WoS in the last eight years. These results are consistent with previous research (Nederhof et al., 1989; Hicks, 1999; Larivière et al., 2006), which showed that in disciplines such as the humanities, journal articles are not the mainstream outlet for knowledge diffusion, books being still much more cited than papers. Also, there is a language factor that must be considered, as many researchers in the social sciences and humanities in Quebec publish in French-language journals, and these are known to be under-represented in Thomson’s databases (Archambault et al., 2006). Despite these mitigating factors, it is interesting to note that so many researchers—close to one third of the population—have not published a single paper in eight years in the 9,000 mainstream journals indexed by Thomson. This suggests that despite strong pressure to do so, many researchers still find it more useful to publish their results in other types of publication, namely books, book chapters and local journals.
Because cited researchers are a subset of publishing researchers in our methods, since we search citations only to papers in the database, the percentage of researchers with at least one citation is lower than the percentage of researchers with at least one paper. Unsurprisingly, the disciplines in which there is a high percentage of researchers without any citations are also the ones in which the proportion of uncited papers is the highest (Larivière, Gingras and Archambault, 2009). For instance, uncited researchers over the eight-year period covered represent more than half of the population in SSH disciplines, while they represent less than half of the population in the disciplines of natural sciences, engineering and health (NSE). Obviously, these two indicators (publications and citations) are highly concentrated, especially in some disciplines—such as the humanities, non-health professions and education—where less than 40% of researchers published at least one paper, and 20% or less were cited at least once over the period.
0% 10% 20% 30% 40% 50% 60% 70% 80% 90% 100%
Education Non-Health Professions Humanities Business & Management Social Sciences Health Sciences Basic Medical Sciences Engineering Natural Sciences
At least one paper At least one citation
Figure 4. Percentage of researchers with at least one paper and at least one citation by disciplines, 2000-2007
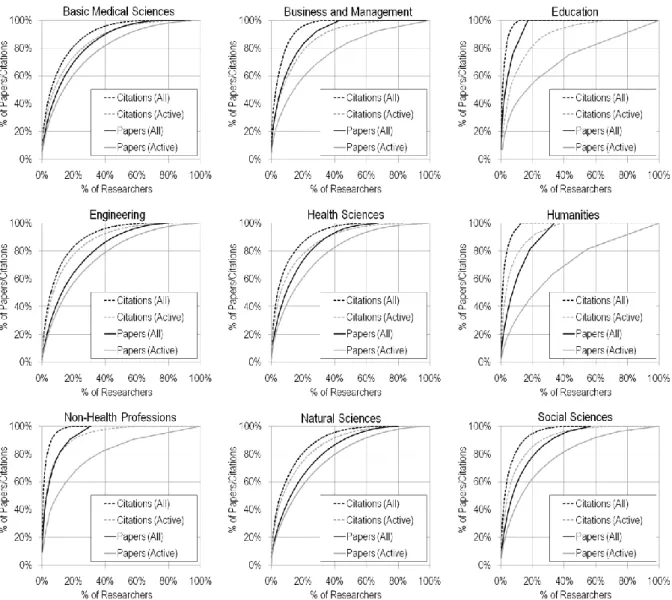
In light of the fact that there is such a large difference between disciplines in the proportion of researchers who do not publish WoS-indexed papers, it is relevant to present Lorenz curves for
8 both the whole population of researchers and for the subset comprising researchers with at least one indexed paper. Figure 5 shows that while publications are significantly more concentrated in the SSH than in NSE when non-publishing researchers are included, the opposite is true when they are excluded. For example, in education, the percentage of researchers needed to account for 80% of the publications goes from 9.2% to 54% when researchers with no indexed papers are excluded; in addition, the discipline moves from being the most concentrated to being the most evenly distributed. Because the majority of researchers in the NSE have published at least one paper over the period, the difference between the two curves is smaller. It is important to bear in mind that many researchers in the SSH could in fact be publishing books, book chapters or papers in journals not covered by Thomson’s databases and that the results for these disciplines are certainly less complete than the ones obtained for natural and medical sciences. Hence, the curve obtained by eliminating “non publishing” researchers may provide a more useful representation of these distributions by only focusing on the subset of SSH researchers who publish WoS-indexed articles.
Figure 5. Pareto cumulative distributions of papers and citations, using all professors and professors who published at least a paper (active) as denominators by discipline, 2000-2007 One can also note that citation distributions are much more concentrated than publication distributions and that the difference between the two curves (all and active) is less pronounced.
9 In both cases, citations are much more concentrated in the disciplines of the SSH than of the NSE. In all disciplines of the SSH, except business and management, 80% of citations were obtained by less than 20% of active researchers. If inactive researchers are included, this figure drops to less than 10%, and as low as 3-4% for education, non-health professions and humanities. In NSE, 80% of citations were obtained by 22-25% of active researchers, and by 15-20% of all researchers. Citations are thus much more dispersed across researchers in the NSE than in the SSH, whether non-publishing researchers are included or not.
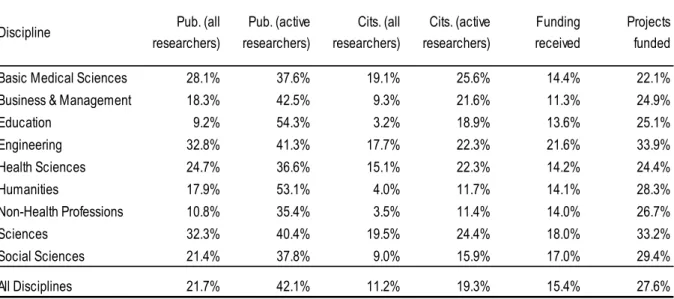
Table 1. Percentage of researchers needed to account for 80% of the number of papers, citations, funding received and number of projects funded by discipline, 2000-2007
Discipline Pub. (all
researchers) Pub. (active researchers) Cits. (all researchers) Cits. (active researchers) Funding received Projects funded
Basic Medical Sciences 28.1% 37.6% 19.1% 25.6% 14.4% 22.1%
Business & Management 18.3% 42.5% 9.3% 21.6% 11.3% 24.9%
Education 9.2% 54.3% 3.2% 18.9% 13.6% 25.1% Engineering 32.8% 41.3% 17.7% 22.3% 21.6% 33.9% Health Sciences 24.7% 36.6% 15.1% 22.3% 14.2% 24.4% Humanities 17.9% 53.1% 4.0% 11.7% 14.1% 28.3% Non-Health Professions 10.8% 35.4% 3.5% 11.4% 14.0% 26.7% Sciences 32.3% 40.4% 19.5% 24.4% 18.0% 33.2% Social Sciences 21.4% 37.8% 9.0% 15.9% 17.0% 29.4% All Disciplines 21.7% 42.1% 11.2% 19.3% 15.4% 27.6%
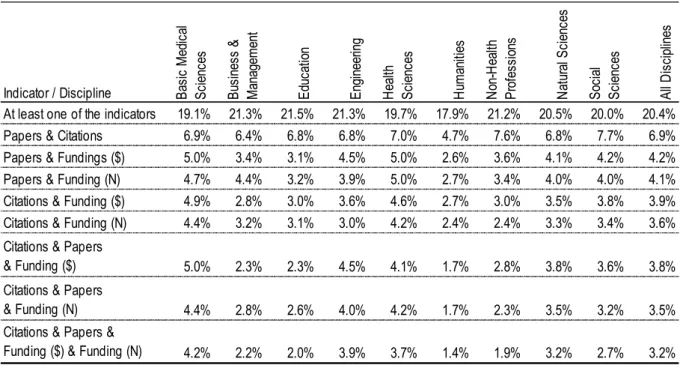
Taken globally (as in Table 1), these data all show that the majority of scientific resources, output and impact are associated with a small minority of researchers. One might ask then if this scientific elite is composed of the same group of researchers for all three measures of activity. In other words, is the group of researchers receiving the majority of research funds also the group publishing the majority of papers and receiving the majority of citations? Table 2 presents, for each discipline as well as for all disciplines combined (discipline-normalized), the percentage of researchers who are in the top 10% for 1) at least one of the four indicators, 2) two indicators, 3) three indicators, and 4) all four indicators. As one would expect, the percentage of researchers who are in the top 10% for at least one of the four categories is higher than the percentage of those who are in this top ranking for all four indicators. Although slightly more than one-fifth of all researchers are in the top 10% for at least one of the indicators, only 3.2% are in the top 10% for all four indicators. As one might expect, the percentage of researchers who are in the top 10% for both citations and impact (6.9%) is higher than that of researchers in the top 10% for either publications and funding or citations and funding (≈4%). Though not shown, data for the top 20% revealed similar patterns: about one-third of all researchers are in the top 20% for at least one indicator, 15% are at the top for publications and citations, 10% are at the top for three indicators and about 8% are at the top for all four indicators. The data also show that the “elite” thus defined (top in all four performance indicators) is generally more concentrated into a smaller proportion of researchers in the SSH than in the NSE, which is, again, likely to be, at least in part, a reflection of the fact that the databases capture only some of the research outputs in the SSH. Although the differences between each of the disciplines is not always significant from a statistical point of
10 view, the differences between the SSH and NSE, taken together, is significant at p < 0.001 using a z-test.
Table 2. Percentage of researchers in the top 10% number of papers, citations, projects funded and total funding received by discipline, 2000-2007
Indicator / Discipline Basi c M ed ic al Sc ie nc es Bu si ne ss & M an ag em en t Ed uc at io n En gi ne er in g H ea lth Sc ie nc es H um an iti es N on -H ea lth Pr of es si on s N at ur al S ci en ce s So ci al Sc ie nc es Al l D is ci pl in es
At least one of the indicators 19.1% 21.3% 21.5% 21.3% 19.7% 17.9% 21.2% 20.5% 20.0% 20.4%
Papers & Citations 6.9% 6.4% 6.8% 6.8% 7.0% 4.7% 7.6% 6.8% 7.7% 6.9%
Papers & Fundings ($) 5.0% 3.4% 3.1% 4.5% 5.0% 2.6% 3.6% 4.1% 4.2% 4.2%
Papers & Funding (N) 4.7% 4.4% 3.2% 3.9% 5.0% 2.7% 3.4% 4.0% 4.0% 4.1%
Citations & Funding ($) 4.9% 2.8% 3.0% 3.6% 4.6% 2.7% 3.0% 3.5% 3.8% 3.9%
Citations & Funding (N) 4.4% 3.2% 3.1% 3.0% 4.2% 2.4% 2.4% 3.3% 3.4% 3.6%
Citations & Papers
& Funding ($) 5.0% 2.3% 2.3% 4.5% 4.1% 1.7% 2.8% 3.8% 3.6% 3.8%
Citations & Papers
& Funding (N) 4.4% 2.8% 2.6% 4.0% 4.2% 1.7% 2.3% 3.5% 3.2% 3.5%
Citations & Papers &
Funding ($) & Funding (N) 4.2% 2.2% 2.0% 3.9% 3.7% 1.4% 1.9% 3.2% 2.7% 3.2%
Discussion and Conclusion
This paper has analysed concentration measures of research funding, production and citations at the researcher level. It reveals important differences between disciplines in the percentage of researchers who have published papers and received citations and funding, and clear differences between disciplines in the percentage of researchers needed to account for the majority of papers, citations and funding. Although concentration is greatest in the SSH when all researchers are included, the opposite is true when non-publishing academics are excluded, which is likely a reflection of the fact that in those disciplines, a smaller share of researchers are publishing papers, books still being the privileged medium for knowledge diffusion, in the humanities for example. The pattern is different for funding, where the majority of researchers have had at least one grant over the period under study and where SSH researchers are, overall, on a par with their colleagues in the NSE. This is at least in part a reflection of the limitations of our indicators: whereas our funding database is fairly exhaustive and should not discriminate in favour of one group over the other,7 our output indicator measures only one part of the scientific output, especially in the disciplines of the SSH.
In contrast to the tendency to see “universal” distributions everywhere, these data highlight the peculiar nature of these distributions, which are both discipline- and indicator-dependant. Indeed, while for all disciplines combined, 27% of all researchers account for 80% of the projects funded, 20%, 14% and 10% of researchers respectively account for 80% of the papers published, total funding and citations received. This percentage increases to 42% and 19% for publications and citations, respectively, when one excludes researchers who have not published at least one paper, which reveals the sizeable effect of including or excluding such “zero” cases
7 Except possibly for those researchers who would receive contract money as consultants, thus using their own
11 in the distributions. The observed difference between publications and citations is also consistent with Allison (1980) and Rousseau’s (1992) observations.
Although we cannot fully explain these differences yet, some hypotheses can be formulated. As mentioned previously, the fact that researchers in the SSH diffuse their research in media other than WoS-indexed journals clearly increases the concentration of publications in these disciplines. The low citation rates and long half-lives of citations to papers published in those disciplines also affect the concentration of citations, as only a minority of papers are cited in the immediate years following their publication (Larivière, Gingras and Archambault, 2009). Hence, we can infer from this relationship that high productivity, high citation levels and low uncitedness decrease concentration. Along the same lines, the size of the discipline in terms of both papers published and citations received seems to be negatively related to concentration. On the other hand, the size of research teams might affect the concentration of funding— especially in basic medical sciences—where principal investigators might receive large grants but then redistribute the funding to their collaborators. At the opposite end of the spectrum, in the SSH, researchers are less likely to work in large teams and are thus more likely to have their own grants.
Finally, this paper also suggests that one should take care in defining the “elite” of a scientific discipline as it can differ appreciably depending on the indicator used. While about 20% of all researchers are in the top 10% for at least one of the chosen indicators, only about 3% are in the top 10% for all indicators. Although there is a relationship between these variables, the variance is large enough for the individuals identified by each variable to diverge considerably. For instance, 50% of the top funded researchers are neither in the most productive groups nor in the most cited ones. That being said, one observes a greater stability of the elites identified using the different indicators in the NSE than in the SSH.
Acknowledgments
We wish to thank the Ministère du développement économique, de l’innovation et de l’exportation (MDEIE) and Quebec’s three research councils (FRSQ, FQRSC and FQRNT) for providing the lists of professors and the Canadian G13 data exchange for their work on the disciplinary classification of departments. We also acknowledge the helpful comments of Jean-Pierre Robitaille as well as those of two anonymous referees. This article is an extended version of a paper presented at the XIIth conference of the International Society for Scientometrics and Informetrics held in Rio de Janeiro, Brazil, 14-17 July 2009.
References
Adler, N and A W K Harzing 2009 When knowledge wins: Transcending the sense and nonsense of academic rankings. The Academy of Management Learning & Education, 8(1), 72-95.
Allison, P D 1980 Inequality and scientific productivity. Social Studies of Science, 10(2), 163-179. Allison, P D and J A Stewart 1974 Productivity differences among scientists: Evidence for
accumulative advantage, American Sociological Review, 39(4), 596-606.
Archambault, É, É Vignola-Gagné, G Côté, V Larivière and Y Gingras 2006 Benchmarking scientific output in the social sciences and humanities: The limits of existing databases.
Scientometrics, 68(3), 329-342.
Bradford, S C 1934 Sources of information on specific subjects. Engineering, 137(3550), 85-86. Burrell, Q L 1991 The Bradford distribution and the Gini index. Scientometrics, 21(2), 181-194.
12 Butler, L and M S Visser 2006 Extending citation analysis to non-source items. Scientometrics,
66(2), 327-343.
Carpenter, M P and F Narin 1980 Data user's guide to the National Science Foundation's science
literature indicators data base. Cherry Hill, NJ: Computer Horizons, Inc.
Cole, J R and S Cole 1972 The Ortega hypothesis. Science, 178(4059), 368-375.
Cole, S and J R Cole 1973 Social stratification in science. Chicago: University of Chicago Press. Cole, F J and N B Eales 1917 The history of comparative anatomy, Part I: A statistical analysis
of the literature. Science Progress in the Twentieth Century, 11, 578-596.
Egghe, L 1988 The relative concentration of a journal with respect to a subject and the use of online services in calculating it. Journal of the American Society for Information Science, 39(4), 281-284.
Evans, J A 2008 Electronic publication and the narrowing of science and scholarship. Science, 321(5887), 395-399.
Garfield, E 1990 How ISI selects journals for coverage: Quantitative and qualitative consideration. Essays of an Information Scientist, 13(22), 185-193.
Gingras, Y, V Larivière, B Macaluso and J P Robitaille 2008 The effects of aging on researchers' publication and citation patterns. PLoS ONE, 3, e4048.
Hicks, D 1999 The difficulty of achieving full coverage of international social science literature and the bibliometric consequences. Scientometrics, 44(2), 193-215.
Ioannidis J P A 2006 Concentration of the most-cited papers in the scientific literature: Analysis of journal ecosystems. PLoS ONE, 1, e5.
Larivière, V, É Archambault, Y Gingras and É Vignola-Gagné 2006 The place of serials in referencing practices: Comparing natural sciences and engineering with social sciences and humanities. Journal of the American Society for Information Science and Technology, 57(8), 997-1004.
Larivière, V, Y Gingras and É Archambault 2009 The decline in the concentration of citations.
Journal of the American Society for Information Science and Technology, 60(4), 858-862.
Lotka, A J 1926 The frequency distribution of scientific productivity. Journal of the Washington
Academy of Science, 16, 317-323.
Macroberts, M H and B R Macroberts 1987 Testing the Ortega hypothesis: Facts and artifacts.
Scientometrics, 12(5-6), 293-295.
Merton, R K 1968 The Matthew effect in science. Science, 159(3810), 56–63.
Merton, R K 1973 The Sociology of Science: Theoretical and Empirical Investigations. Chicago: Chicago University Press.
Moed, H F 1996 Differences in the construction of SCI based bibliometric indicators among various producers: a first overview. Scientometrics, 35(2), 177-191.
Morgan, K J 2004 The research assessment exercise in English universities, 2001, Higher
Education, 48(4), 461-482.
Nederhof, A J, R A Zwaan, R E Debruin and P J Dekker 1989 Assessing the usefulness of bibliometric indicators for the humanities and the social and behavioral sciences: A comparative study. Scientometrics, 15(5-6), 423-435.
Pratt, A D 1977 A measure of class concentration in bibliometrics. Journal of the American Society
for Information Science, 28(5), 285-292.
Price, D J D 1963 Little science, big science. New York: Columbia University Press.
Rousseau, R 1992 Concentration and diversity of availability and use in information systems: A positive reinforcement model. Journal of the American Society for Information Science, 43(5), 391-395.
13 von Tunzelmann, N, E Kraemer Mbula 2003 Changes in research assessment practices in other countries since 1999: Final report. Report to the Higher Education Funding Council for England. 46 p.
Williams, B 1993 Research management for selectivity and concentration - With what effect?
Higher Education Quarterly, 47(1), 4-16.
Zipf, G K 1949 Human behavior and the principle of least effort. An introduction to human ecology, Cambridge: Addison-Wesley Press.
14 Appendix 1. Composition of fields and subfields (based on CIP)
Basic Medical Sciences Non-Health Professions
Surgical Specialties Planning & Architecture
Medical Specialties Media & Communication Studies
Laboratory Medicine Social Work
General Medicine Library & Information Sciences
Business & Management Law & Legal Studies
Education Natural Sciences
Engineering Resource Management & Forestry
Mechanical & Industrial Engineering Agricultural & Food Sciences
Other Engineering Earth & Ocean Sciences
Electrical & Computer Engineering Computer & Information Science
Civil Engineering Biology & Botany
Chemical Engineering Mathematics
Health Sciences Physics & Astronomy
Public Health & Health Administration Chemistry Kinesiology / Physical Education Social Sciences
Rehabilitation Therapy Other Social Sciences & Humanities
Nursing Political Science
Dentistry Economics
Other Health Sciences Psychology
Humanities Geography
History Anthropology, Archaeology & Sociology
Fine & Performing Arts Philosophy
French/English
Religious Studies & Vocations