HAL Id: hal-02050967
https://hal-mines-albi.archives-ouvertes.fr/hal-02050967
Submitted on 27 Feb 2019
HAL is a multi-disciplinary open access
archive for the deposit and dissemination of
sci-entific research documents, whether they are
pub-lished or not. The documents may come from
teaching and research institutions in France or
abroad, or from public or private research centers.
L’archive ouverte pluridisciplinaire HAL, est
destinée au dépôt et à la diffusion de documents
scientifiques de niveau recherche, publiés ou non,
émanant des établissements d’enseignement et de
recherche français ou étrangers, des laboratoires
publics ou privés.
Analytical and numerical modeling of light scattering in
composite transmission laser welding process
Andre Chateau Akue Asseko, Benoit Cosson, Mylene Deleglise, Fabrice
Schmidt, Yannick Le Maoult, Eric Lafranche
To cite this version:
Andre Chateau Akue Asseko, Benoit Cosson, Mylene Deleglise, Fabrice Schmidt, Yannick Le Maoult,
et al.. Analytical and numerical modeling of light scattering in composite transmission laser
weld-ing process. International Journal of Material Formweld-ing, Sprweld-inger Verlag, 2015, 8 (1), pp.127-135.
�10.1007/s12289-013-1154-7�. �hal-02050967�
Analytical and numerical modeling of light scattering
in composite transmission laser welding process
André Chateau Akué Asséko&Benoît Cosson&Mylène Deleglise&
Fabrice Schmidt&Yannick Le Maoult&Eric Lafranche
Abstract Analytical and numerical models for laser beam scattering in the thermoplastics composites are presented. The numerical model is based on Ray Tracing, an optical method to compute the optical propagation of laser beams in inhomogeneous media with spatially varying dispersion of the refractive index. In this study, only the case of unidirectional thermoplastic composites (UD) is presented. During transmission laser welding process, a divergence of the laser beam is observed in the first part (transparent in the laser wavelength) due to the internal refraction at the microscopic scale of the beam at each matrix-fiber interface. At the macroscopic scale, this phenomenon leads to the light scattering of the laser beam in this heterogeneous media. Under these conditions, a modeling of the propagation of a laser beam appears essential. An analytical model compared to numerical model is proposed, that enables to simulate and to optimize the laser source at the welding interface. This model provides a good estimation of the laser beam intensity profile at the welding interface (radiative heat well defined) and the beam widening. Those steps are necessary to describe the heat source in the laser welding process thermal simulations. The distribution of the heat source at the interface is one of the most important parameter in the description of the laser welding process. Keywords Laser welding . Ray tracing . Light scattering . Thermoplastics composites . Continuous fiber composites
Introduction
Transmission Laser Welding technique [1] (TLW) presents specific advantages for industrial applications over other conventional technologies: the method is accurate, flexible, small heat affected zone, easy to automate and control and non-contaminant, heat transfer with the ability to optimize the welding temperature (at the interface of the welding zone), absence of vibration during the welding process (contrary to the ultrasonic welding, friction welding), fast welding speed for welding plastic parts with an acceptable welding time. Transmission Laser Welding of composites involves two joining parts. One transparent in the laser wavelength and the other part is absorbent in the same wavelength. The two parts are positioned together before the welding. The laser beam energy is transmitted through the transparent material and is absorbed within the surface of the two materials (Fig.1). The contact between the parts causes heating of the substrate placed at the interface (through heat transfer via conduction); thus, melting and fusion of the both materials interface occurs (the bonding between the two parts occurs when T>Tmeltin this area). The extent of the melted material volume depends on the quantity of the energy delivered to the components through the laser beam. The energy is deposited at the interface in a localized volume causing the formation of a weld zone. Comparing with welding traditional techniques, laser welding efficiency strongly depends on the optical properties of the material [2]: absorption, transmission, refraction, reflection, scattering and thermal properties: heat capacity, thermal conductivity and density.
TLW depends on several parameters which are related to the laser beam: laser focusing distance (irradiated laser section area); laser power, velocity and wavelength. Low energy values can lead to a weak joint with low strength, while high energy values may cause degradation and vaporization phenomena; in both cases, a bad joint quality is obtained. Consequently, the energy delivered on the surfaces needs to be optimized for every process application [3]. A growing
A. C. Akué Asséko (*)
:
B. Cosson:
M. Deleglise:
E. Lafranche Mines Douai, Department of Polymers and Composites Technology & Mechanical Engineering, 941 Rue Charles Bourseul, CS 10838, 59508 Douai Cedex, Francee-mail: andre.akue.asseko@mines-douai.fr B. Cosson
e-mail: benoit.cosson@mines-douai.fr A. C. Akué Asséko
:
F. Schmidt:
Y. Le MaoultMines Albi, ICA-ALBI, Campus Jarlard, 81013 Albi, France A. C. Akué Asséko
numbers of applications of composite thermoplastics have lead to an increasing interest in research in the field of laser welding. This is due to the increased need for the structural composite thermoplastic involving oriented continuous fibers tissue. However, some difficulties are experienced during this process: heterogeneous and anisotropic materials; problems of the laser beam transfer caused by the multiplication of fiber-matrix interfaces in materials. This heterogeneity on light scattering should be studied. The literature contains many investigations on the process modeling for the calculation of the temperature field at the interface. The energy input due to the laser is often imposed on the surface. The shape of the laser beam is assumed and is not computed. The absorption phenomenon at the surface of the absorbing material is calculated using the Beer-Lambert law. Labeas et al. [3] assume a heat flux density with Gaussian distribution in order to compute the temperature field. Shanmugam et al. [4] also consider the same assumptions. Grewell and Benatar [5] modeled the amount of scattering intensity diffused in the material using Lambert-Bouger’s law. Authors in [6–8] consider that the laser beam is absorbed in the second material according to the Beer Lambert Law. In [9] a technic called the direct-scattering model (mathematical function) is developed to describe laser beam transmission and absorption in light-scattering polymers. A modified Bouguer-Lambert law is used to describe light intensity distribution in these multi-scattering polymers. Rosenthal [10] develops an analytical solution of heat flow during welding based on conduction heat transfer for predicting the shape and the temperature field for three-dimensional welds. Hou [11] proposed analytical general solutions (both transient and steady state) for the temperature field rise at any point due to stationary or moving plane heat sources of different shapes (elliptical, circular, rectangular, and square) and heat intensity distributions
(uniform, parabolic, and normal). The authors [12] also proposed an analytical model the temperature field at a three-dimensional by numerically solving the model using commercially available mathematic software Matlab.
In this study, the purpose is to determine the energy reaching at the interface of the two parts. A macroscopic analytical model is developed and compared to a microscopic numerical model, which is able to simulate and to optimize the laser scattering during the process. This analytical model describes laser beam transmission in light-scattering thermoplastics composites. The radiative energy is estimated at the welding interface of the two materials in order to describe the heat source. This analytical model can be used for FEM computations of the temperature. A correlation between the refraction indexes of fiber and matrix, the fiber volume fraction and the macroscopic light scattering is done. An identification of the main parameters of the analytical model will also be carried using Ray Tracing method.
Analytical model
In thermoplastic composite parts made of polymers and continuous fibers, a scattering occurred during the laser welding. It will therefore be problematic to apply Bouguer-Lambert law to describe light intensity distribution in these multi-scattering thermoplastic composites. It is well-known that fiber increases the scatter of the laser light, which in turn increases the effective beam diameter [13]. In the study, an analytical model is developed to describe laser light path in scattering composites by introducing light scattering ratio and scattering standard deviation. The Fig. 2 sketches the mechanism of light transmission in the transparent composite part. In this study, the absorption is neglected versus the scattering effect.
Due to the light scattering, a collimated beam is requested instead of a focused beam. Awell-suited modelling of the laser heat source for the gaussian and rectangular distribution is presented as in [11]. A general solution for various surface heat sources of different heat intensity for different shapes (elliptical, circular, rectangular, and square) is presented. The heat input is distributed on the surface and the surface flux is represented by [14]:
Q x; yð Þ ¼ Io$ Inðx; yÞ ð1Þ
Iois the laser power (W), In(x, y) the surface distribution function, which is maximum and centered in (x=0, y=0). This function represents a normalized [14, 15] power flux distribution defined as power per unit area so that its integral over the beam area is equal to unity :
Z
S
Inðx; yÞ dxdy ¼ 1 ð2Þ
S is the beam section zone. During the laser welding, the heat flux reaches the higher intensity in the central welding zone. When we keep away from this central zone, the heat flux decreases. It can be assumed that the laser light follows the Gaussian distribution law in the medium (phenomenological approach) [4,16]. The laser beam can be considered as a sum of beam with an infinitesimal cross section. We call it micro beam. The energy of a micro beam at location (xo, yo) is equal to Io×In(xo,yo), so the sum of the micro beam is equal to Io. Without regarding the shape of the laser beam (Gaussian, Rectangular…), all the micro beams are assumed to be Gaussian. At the incoming surface, the standard deviation of the Gaussian law of the micro beam is equal to zero. The standard deviation is increased with the sample thickness. Each micro beam in the transparent component changes the direction (due to the change of refractive indices between the matrix and the fiber) randomly due to the refraction phenomenon in each matrix-fiber interface. This leads a portion of the laser beam which goes the incoming surface (Backward beam) and a portion of the beam which goes to the welding interface (Inward beam) (Fig.3).
In each location in the laser beam (xo, yo), we assume that the local energy of the inward beam follow a Gaussian distribution centered in xo, yoand the scattering standard deviation is a function of the thickness. This law is expressed below: G x½ð − x0Þ; y − yð 0Þ& ¼ G x − xð 0Þ $ G y − yð 0Þ ð3Þ G xð − xoÞ ¼ 1 ffiffiffiffiffiffi 2π p σx e−ðx2σx2− xoÞ2 ð4Þ G yð − yoÞ ¼ 1 ffiffiffiffiffiffi 2π p σy e− y− yo ð Þ2 2σy2 ð5Þ
x and y are space variables,σ is the spatial distribution parameter of the Gaussian function (scattering standard deviation), xoand yoare centers of each Gaussian micro beam.
We assume that the distribution law, which represents the refraction phenomena at the microscopic scale, and the light scattering phenomenon at the macroscopic scale in the composite is a dependent function of the medium thickness (z). It is also depends of the microstructure and physical properties of the composite. The distribution of the total power of the laser beam in the media is expressed by :
I x; y; zð Þ ¼ Io$ δ zð Þ
Z
S
Inðxo; yoÞ $ G x − x½ð oÞ; y − yð oÞ& dxodyoð6Þ
δ (z) is the light scattering ratio : it is defined as the value of the scattered laser power divided by the total laser power Io. It is a material dependent property, and also a function of the light penetration depth in the composite. In the literature, some studies [5, 17] show that δ decreases exponentially. The attenuation of the radiation power through a media is due to an extinction phenomenon, wherein the absorption and scattering may also coexist or dominate one another, depending on the optical properties of the media. In this model, only the optical scattering of the laser beam in the transparent part is taking into account (absorption is negligible). δ might also be expressed by the following relation:
δ zð Þ ¼I x; y; zð I Þ
o ¼ e
−Dz ð7Þ
The power of the backward micro beam is 1−δ (z). D is the optical scattering coefficient (m−1). In the case of the laser beam with a Gaussian distribution, the function In(x,y) is given by the following expression:
Inðx; yÞ ¼ 1
2πσ02e −ðx þ yÞ2
2σ02 ð8Þ
Withσothe spatial shape parameter of the initial laser beam (proportional to the beam diameter). In order to highlight the importance of the knowledge of the composite microstructure on the weldability of two parts, we choose to apply the model for UD composite due to the strong anisotropic microstructure
Fig. 2 Light transmission in composite part
Inward beam
Backward beam
A micro beam
of the composite. The light scattering occurs in the orthogonal plan of the fiber direction (Fig.4). We note I(x) the intensity distribution. In this case, we can express I(x,y) as the decoupled product of I(x) and I(y) :
I xð Þ ¼ Z
−∞ ∞
G xð − xo; 0Þ p xð Þdxo o ð9Þ
Where the expression of p at xois :
p xð Þ ¼0 1 ffiffiffiffiffiffi 2π p σ0 e−2σ02x02 ð10Þ
We notice that the Eq. (9) represents the convolution product of the two functions (p and G). However, the convolution of two gaussian functions is also a gaussian function. So Eq. (9) can be express using (4) by :
I xð Þ ¼ Z −∞ ∞ 1 ffiffiffiffiffiffi 2π p σx e− x− x0 ð Þ2 2σx2 ffiffiffiffiffiffi1 2π p σo e−2σo2x02 ! dxo ð11Þ
Which leads to:
I xð Þ ¼ ffiffiffiffiffiffiffiffiffiffiffiffiffiffiffiffiffiffiffiffiffiffiffiffiffiffiffiffi1 2π σð x2þ σo2Þ
p e−2 σx2 þ σo2ð x2 Þ ð12Þ
Finally, the expression of I(y) is also the same form withσy → 0 ∀ z ≠ 0 (scattering is anisotropic due to the UD composites) :
I yð Þ ¼ ffiffiffiffiffiffiffiffiffiffiffiffi1 2πσo2
p e−2σo2y2 ð13Þ
Therefore, for a gaussian laser beam, the distribution of the total power of the laser inward beam in the UD composite is:
I x; y; zð Þ ¼ Io$ e −Dz 2πσo ffiffiffiffiffiffiffiffiffiffiffiffiffiffiffiffiffiffiffiffiffiffiffiffiffiffiffiffiffiffiffi σxð Þz 2þ σo2 " # r $ e− x2 2 σx zð ð Þ2þσo2Þþ y2 2σo2 " # ð14Þ
Withσxis a function of z, refraction index of matrix and fiber and microstructure.
In the case of the laser beam with a rectangular distribution, the function In(x,y) is given by the following expression Inðx; yÞ ¼ Inð Þ ¼ H r − rr ð oÞ ð15Þ
r ¼pffiffiffiffiffiffiffiffiffiffiffiffiffiffiffix2þ y2 ð16Þ
Where r the polar coordinate, H is the Heaviside function and rothe radius of the spot of the laser beam. Eq. (6) becomes:
I x; y; zð Þ ¼ Io$ δ zð Þ Z S G x½ð − xoÞ; y − yð oÞ& $ H r − rð oÞdxodyo ð17Þ I x; y; zð Þ ¼ Io$ δ zð Þ Z −∞ ∞ Z −∞ ∞ 1 ffiffiffiffiffiffi 2π p σx e−ðx2σx2− xoÞ2 $ ffiffiffiffiffiffi1 2π p σy e− y− yo ð Þ2 2σy2 $ H r − rð oÞ dxody o ð18Þ Sample I(x)
Fig. 4 Model description
Fig. 5 Ray Tracing method
Φ = 18 µm
(Gaussian shape)
(Rectangular shape)
Fig. 7 Intensity distribution of the laser beam at the welding interface (thickness = 1 mm, 40 % fiber)
Control settings
standard deviation of the initial Gaussian (σ0), the radius of the spot of the laser beam (r0), laser power
(I0), ….etc. Numerical model (Ray Tracing)
In: Numerical laser intensity (W/m²) (Gaussian shape (G) et Rectangular shape
(C))
Analytical model Ia: Analytical laser intensity (W/m²) (Gaussian shape (G) et Rectangular shape
(C)) Adjustment criterion
(Double objective error) Miminisation of the criterion
Identified parameters Fig. 8 Algorithm of the
procedure for parametric identification
In the UD case withσy→ 0 ∀ z ≠ 0, G(0, y−yo) → ∞, then G (y−yo) represents the Dirac pulse ω(y−yo) and Eq. (18) becomes: I x; y; zð Þ ¼ Io$ δ zð Þ Z −∞ ∞ Z −∞ ∞ H r−rð oÞ $ ω y−yð oÞ $ G x−xð o; 0Þdxodyo ð19Þ
Therefore, for a rectangular laser beam, the distribution of the total power of the laser inward beam in the UD composite is : I x; y; zð Þ ¼Io$ e −Dz 2πr2 −erf ffiffiffi 2 p x− ffiffiffiffiffiffiffiffiffiffiffiro2−y p " # 2σxð Þz 0 @ 1 A þ erf ffiffiffi 2 p x þ ffiffiffiffiffiffiffiffiffiffiffiffiffiffiro2þ y p " # 2σxð Þz 0 @ 1 A 2 4 3 5 ð20Þ Numerical model
Ray Tracing is an optical method used to simulate the radiative transfer in infrared heating problems. This method is very close to the physics of light propagation [18]. It is used to calculate the optical propagation of laser beams in inhomogeneous media with spatially varying dispersion of the refractive index. A ray can be represented by the path of a photon. Ray Tracing allows the simulation of a wide variety of optical effects, such as reflection, refraction and absorption.
Table 1 The initial parameters for the ray tracing simulation Io (W) 1 ro(mm) 0,6 Qo(mm) 0,2 n1 1,49 1,48 1,47 n2 1,53 1,54 1,55 E (mm) 1 2 3 ϕ (μm) 18
Fig. 9 Path followed by the rays in the composite
Table 2 Optical scattering coefficient for different parameters Refractive indices Fiber volume fraction D (m−1)
n1 n2 40 % 99,77 1.49 1.53 50 % 166,1 Ratio1 0.9739 60 % 227,6 n1 n2 40 % 119,9 1.48 1.54 50 % 196,2 Ratio2 0.9610 60 % 267,2 n1 n2 40 % 137,1 1.47 1.55 50 % 209,5 Ratio3 0.9484 60 % 287,1
Table 3 σxvalues for different parameters
n1 1,49 Ratio1 n2 1,53 0,9739 Sigma (σ) z (m) 0 0,001 0,002 0,003 Vf 40 % 0 0,000244 0,000644 0,001136 50 % 0 0,000283 0,000818 0,001437 60 % 0 0,000355 0,000987 0,001623 n1 1,48 Ratio2 n2 1,54 0,9610 Sigma (σ) z (m) 0 0,001 0,002 0,003 Vf 40 % 0 0,000269 0,000750 0,001297 50 % 0 0,000324 0,000866 0,001577 60 % 0 0,000412 0,001003 0,001721 n1 1,47 Ratio3 n2 1,55 0,9484 Sigma (σ) z (m) 0 0,001 0,002 0,003 Vf 40 % 0 0,000309 0,000771 0,001414 50 % 0 0,000357 0,000864 0,001642 60 % 0 0,000429 0,001050 0,001799
Snell-Descartes law is applied at each fiber-matrix interface with n1, n2 the refractive indices of the media (Fig. 5).
The Ray Tracing can be compared to other numerical methods such as Monte Carlo method for modelling light transport with the Mie theory [19, 20]. Elie et al. [21] use Monte Carlo simulations in order to quantify scattering effects in polymer media with no absorption, and they obtained good agreement with measured profiles of laser beam transmitted through the media. Monte Carlo method can also, as Ray Tracing, predict the quantity and the distribution of the light reaching the interface, as well as the distribution of the light
within the transparent part. The Fig.6 represents a cross section of the type of mesh used for the computation.
Data retrieved from the simulation can be used to determine transmission, reflection and the associated distributions of the outgoing light. The propagation of radiation in a scattering medium can be described from the Mie theory, which provides the parameters for single particle scattering and making the switch to a set of particles by a statistical method such as the Monte Carlo method.
Simulations using Ray Tracing allow us to calculate as output the profile of the intensity distribution (Fig. 7) of the laser beam for different shapes (Gaussian and rectangular) at the welding interface (outlet surface).
Fig. 10 Evolution of the σxlaw
versus thickness
Fig. 11 Intensity distribution of the laser beam for different values of y: 0 mm, 0.2 mm and 0.5 mm (Gaussian shape)
Identification of the macroscopic model parameters (σxand D)
The identification consists to determine the optimal values of the distribution parameters that able analytical models (Gaussian and rectangular shapes) to describe as well as possible Ray Tracing model. The numerical simulation Ray Tracing are accurate as in [18]. The author has developed this method in order to compute the radiative source term in IR heating problem. This method was compared to basic experiments in order to validate some physical assumptions. The final comparison showed the capability of the ray tracing method to predict temperature distribution in the transparent material.
An algorithm (Fig. 8) illustrates the main steps of the procedure for parametric identification. Notice that the refraction of the laser beam in the media is independent of the initial shape.σ and D parameters are identified considering both models (gaussian and rectangular distributions).
The overall error generated by these two models (double objective error) is obtained by the following expression:
Error σð Þ ¼ ffiffiffiffiffiffiffiffiffiffiffiffiffiffiffiffiffiffiffiffiffiffiffiffiffiffiffiffiffiffiffiffiffiffiffiffiffiffiffiffiffiffiffiffiffiffiffiffiffiffiffiffiffiffiffiffiZ R2ðINGðx; yÞ−IAGðx; y; σÞÞ 2 Z R2IAG 2 x; y; σ ð Þ v u u u u u t þ ffiffiffiffiffiffiffiffiffiffiffiffiffiffiffiffiffiffiffiffiffiffiffiffiffiffiffiffiffiffiffiffiffiffiffiffiffiffiffiffiffiffiffiffiffiffiffiffiffiffiffiffiffiffiffiffiZ R2ðINCðx; yÞ−IACðx; y; σÞÞ 2 Z R2IAC 2 x; y; σ ð Þ v u u u u u t ð21Þ
IN(x,y) is the total power of the laser beam of the ray tracing model, IA(x,y) is the analytical total power of the laser beam. G and C are respectively the Gaussian and the rectangular shapes of the laser beam.
The computing time for the Ray Tracing varies between (5 h–10 h) depending on the thickness, CPU Intel Xeon E5450 (8×3 GHz). With 200.000 rays and thousands of fibers.
The Table 1 shows the initial values for ray tracing simulation.
Result and analysis
The results of the parametric study are presented depending of the fiber volume fraction (Vf), the thickness (z) and the ratio of refractive indices n1=n
2
ð Þ .
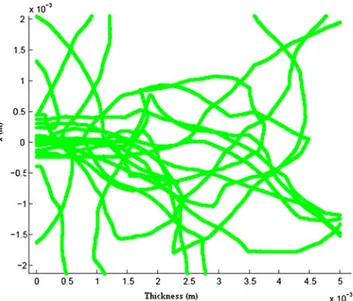
The Fig.9highlights the path of each ray of the laser beam in the composite (light scattering). For this the path of 20 rays are launched on the material surface and are followed in the material (depending on thickness). Firstly, it can be noticed, that each ray takes a different path randomly. Then, it can be noticed that in a second time, all rays don’t reach at the welding interface (thickness = 5 mm). Some of the rays rise the incoming surface, a part goes to the side and another arrives at the welding interface. This simulation allows us to show the light scattering phenomenon at the macroscopic scale by introducing light scattering ratio (Table 2) and standard deviation (Table3).
The light scattering phenomena of the laser beam on a macroscopic scale increases with the thickness of the material (Fig.10). Figure10shows the evolution ofσxversus thickness. The nine curves are obtained for different fiber volume fraction
Fig. 12 Intensity distribution of the laser beam for different values of y: 0 mm, 0.2 mm and 0.5 mm (Rectangular shape)
(40 % 50 % and 60 %) with each ratio of refractive indices
n1=n2$
%
(ratio1, ratio2, and ratio3, cf. Table3).
When the laser beam passes through the composite, a portion of the intensity of the beam rise to the incoming surface, another portion passes through the composite (scattering standard deviationσx) and transmitted to the welding interface. This is indeed the amount of energy which is transmitted to the welding interface that is required for weld of the two parts. If the fiber volume fraction is increased, that is to say increasing the number of matrix-fiber interfaces, in the composite then the light scattering increases. Greater is the thickness, higher is the optical scattering coefficient D. The laser beams transmitted to the interface (less energy for welding) will decrease with the thickness, fiber volume fraction and refractive indices ratio.
The values of the error at convergence are less than 10 %. These different parameters affect the light scattering phenomenon of the laser beam at the macroscopic scale and about the refraction phenomenon at the microscopic scale in the composite material.
Figures11and12show the intensity distribution of the laser beam between the analytical model (Gaussian and rectangular shapes) and the numerical model. These results are obtained for a thickness of 1 mm and 50 % of the fiber volume fraction.
Conclusion
The aim of this study is to present an analytical model, able to represent, described and optimize the laser intensity at the welding interface for good weldability. The absorption is neglected in regard of the scattering effect. Light scattering phenomenons are highlighted at the macroscopic scale using the refraction phenomenon at the microscopic scale in an heterogeneous medium. In another future study, we will consider the absorption phenomenon in the model in order to determine the heat source generated at the welding interface and in the volume (first part) and finally to perform a three-dimensional temperature calculation. In the literature, there are several publications dealing with the determination of the temperature field knowing the source of heat at the interface. Moreover, in the proposed model, the distribution of laser beam in the transparent medium and at the welding interface is independent of the shape of the initial laser beam. In addition, temperature measurements will be performed using infrared camera in order to validate both numerical and analytical models.
References
1. Troughton M (1997) Chapter 13 - laser welding. In: Handbook of plastics joining. William Andrew Publishing, Norwich, pp 101–104
2. Churchill SW, Clark GC, Sliepcevich CM (1960) Light-scattering by very dense monodispersions of latex particles. Discuss Faraday Soc 30:192–199
3. Labeas GN, Moraitis GA, Katsiropoulos CV (2010) Optimization of laser transmission welding process for thermoplastic composite parts using thermo-mechanical simulation. J Compos Mater 44(1):113– 130
4. Shanmugam NS, Buvanashekaran G, Sankaranarayanasamy K, Ramesh Kumar S (2010) A transient finite element simulation of the temperature and bead profiles of T-joint laser welds. Mater Des 31(9):4528–4542
5. Grewell DA, Benatar A (2003) Plastics and composites: Welding handbook. Hanser Verlag, Munchen
6. Coelho JMP, Abreu MA, Carvalho Rodrigues F (2008) Modelling the spot shape influence on high-speed transmission lap welding of thermoplastics films. Opt Lasers Eng 46(1):55–61
7. Ilie M, Kneip J-C, Matteï S, Nichici A, Roze C, Girasole T (2007) Through-transmission laser welding of polymers—temperature field modeling and infrared investigation. Infrared Phys Technol 51(1): 73–79
8. Ilie M, Grevey D, Mattei S, Cicala E, Stoica V (2010) Diode laser welding of ABS: experiments and process modeling. arXiv: 1002.1241
9. Mingliang C (2009) Gap Bridging in laser transmission welding of thermoplastics. Queen’s University, Kingston, Ontario, Canada, 2009
10. Rosenthal D (1946) The theory of moving sources of heat and its application to metal treatments. ASME, Cambridge
11. Hou ZB, Komanduri R (2000) General solutions for stationary/ moving plane heat source problems in manufacturing and tribology. Int J Heat Mass Transfer 43(10):1679–1698
12. Suthar KJ, Patten J, Dong L, Abdel-Aal H (2008) Estimation of temperature distribution in silicon during micro laser assisted machining. pp 301–309
13. Mayboudi LS (2008) Heat transfer modelling and thermal imaging experiments in laser transmission welding of thermoplastics. Queen’s University (Canada), 2008
14. Russek UA (2004) Laser beam welding of thermoplastics parameter influence on weld seam quality—experiments and modeling. In ICALEO 2004, 23th International Congress on Applications of Lasers and Electro Optics. CD-ROM, 2004, pp 501–509
15. Zak G, Mayboudi L, Chen M, Bates PJ, Birk M (2010) Weld line transverse energy density distribution measurement in laser transmission welding of thermoplastics. J Mater Process Technol 210(1):24–31
16. Kuang J-H, Hung T-P, Chen C-K (2012) A keyhole volumetric model for weld pool analysis in Nd:YAG pulsed laser welding. Opt Laser Technol 44(5):1521–1528
17. Kim K, Guo Z (2004) Ultrafast radiation heat transfer in laser tissue welding and soldering. Numer Heat Tran A Appl 46(1): 23–40
18. Cosson B, Schmidt F, Le Maoult Y, Bordival M (2011) Infrared heating stage simulation of semi-transparent media (PET) using ray tracing method. Int J Mater Form 4(1):1–10
19. Flock ST, Wilson BC, Patterson MS (1989) Monte Carlo modeling of light propagation in highly scattering tissues. II. Comparison with measurements in phantoms. IEEE Trans Biomed Eng 36(12):1169– 1173
20. Ren N, Liang J, Qu X, Li J, Lu B, Tian J (2010) GPU-based Monte Carlo simulation for light propagation in complex heterogeneous tissues. Opt Express 18(7):6811–6823
21. Ilie M, Kneip J-C, Matteï S, Nichici A, Roze C, Girasole T (2007) Laser beam scattering effects in non-absorbent inhomogenous polymers. Opt Lasers Eng 45(3):405–412
![Fig. 1 Laser welding system [1]](https://thumb-eu.123doks.com/thumbv2/123doknet/12433974.334776/3.892.78.436.121.391/fig-laser-welding-system.webp)