Université de Montréal
Sensorimotor skills in autism spectrum disorders: a meta-analysis
Par Sarah-Maude Coll Département de psychologie Faculté des arts et sciences
Mémoire présenté à la Faculté des études supérieures et postdoctorales en vue de l’obtention du grade de Maître ès Sciences (M.Sc.)
En psychologie
Avril 2019
Université de Montréal
Faculté des études supérieures et postdoctorales
Ce mémoire intitulé:
Sensorimotor skills in autism spectrum disorders: a meta-analysis
Présenté par: Sarah-Maude Coll
A été évalué par un jury composé des personnes suivantes: Anne Gallagher, présidente rapporteur
Simone Dalla Bella, membre du jury
Simona Maria Brambati, co-directrice de recherche Krista Hyde, directrice de recherche
Résumé
Les habiletés sensori-motrices sont souvent rapportées comme déficitaires chez les
personnes atteintes d’un trouble du spectre de l’autisme (TSA), mais peu de consensus règne sur la façon dont ces habiletés varient en fonction du développement. L'objectif de ce
mémoire est de mener une méta-analyse visant à montrer une différence sur le plan des habiletés motrices fines et globales chez les TSA en comparaison avec un groupe
neurotypique. Au total, 139 études ont été incluses. Les résultats montrent la présence de déficits importants des habiletés sensori-motrices chez une population TSA (k=127, g=1,25, SE=0,08; p<0,001), à la fois pour la motricité fine (k=81, g=1.11, SE = 0.09; p < 0.001) et globale (k=65, g=1.27, SE= 0.10; p< 0.001). Le but ultime est d’établir les bases théoriques pour de futures interventions cliniques, telles qu’avec la musique et la danse, chez une population autiste.
Mots-clés: autisme, sensori-moteur, coordination motrice, déficits moteurs, habiletés motrices
Abstract
Sensorimotor skills are often reported as atypical in people with autism spectrum disorder (ASD), but little is known about how these skills vary with development. The main objective of this thesis was to conduct a comprehensive quantitative meta-analysis of sensorimotor skills in ASD. The specific aim was to assess the consistency of atypical gross and fine sensorimotor behaviours in ASD. A total of 139 studies were included. Results strongly support the presence of deficits in overall sensorimotor abilities in ASD (k=127, g=1.25, SE=0.08, p <0.001), extended to both fine (k=81 , g=1.11, SE = 0.09, p <0.001) and gross sensorimotor skills (k=65, g=1.27, SE=0.10, p <0.001). The ultimate mission of this research is to support a theoretical groundwork for future sensorimotor-based interventions (e.g., music and dance) in ASD.
Keywords: autism spectrum disorder, sensorimotor, motor coordination, motor impairments, motor skills
List of tables
Table 1. List of all the studies included in this current meta-analysis Table 2. Summary of studies included in the sensorimotor motor analysis
Table 3. Summary of studies included in the fine and gross sensorimotor skills analysis Table 4. Summary of studies included in the gross categories analysis
Table 5. Summary of studies included in the gait analysis Table 6. Summary of studies included in the age analysis
List of figures
Figure 1. PRISMA flow chart explaining article inclusion/exclusion process
Figure 2. Forest plot of the studies included in the sensorimotor skills analysis
Figure 3. Forest plot of the studies included in the gait analysis
Figure 4. Forest plot of the studies included in the age analysis
Figure 5. Forest plot of the studies included in the clinical severity analysis
Figure 6a. Funnel plot of the sensorimotor differences between ASD and TD
Figure 6b. Funnel plot of the age analysis
Figure 6c. Funnel plot of the severity analysis
List of abbreviations
ADOS-G Autism Diagnostic Observation Schedule – Generic
ADOS Autism Diagnostic Observation Schedule
ADOS-2 Autism Diagnostic Observation Scale, Second version
ADI-R Autism Diagnostic Interview – Revised
ASD Autism spectrum disorder
ATEC Autism Treatment Evaluation Checklist
Beery-VMI Beery-Buktenica Developmental Test of Visual-Motor Integration
BOTMP/BOT Bruininks-Oseretsky Test of Motor Proficiency
CARS Childhood Autism Rating Scale
HFASD High functioning Autism Spectrum Disorder
MABC-2 Movement Assessment Battery for Children-2
PDMS Peabody Developmental Motor Scale
PANESS Physical and Neurological Examination for Soft Signs
SCQ Social and Communication Questionnaire
TD Typical development
TGMD-3 Test of Gross Motor Development-Third Edition
VABS Vineland adaptive Behavior Scales
ZNA Zurich neuromotor assessment
Acknowledgments
I would like to thank my supervisor Krista Hyde for providing an excellent project, and my co-supervisor Simona Brambati for providing excellent guidance in completing this thesis, not only through her pertinent comments, but also the insightful, critical and tactful manner. I would also like to show gratitude to Nick Foster for his careful mentoring and all his investment during my master’s degree. I also acknowledge the contribution of my colleague Alexa Meilleur for her sharp and scientific mind and also her great support. I would also like to thank my colleagues Emeline Wyckaert, Nathalie Roth and Kevin Jamey at the ABCD lab for their kindness and the respect they have shown me throughout my time in the laboratory. Finally, I would like to thank all my friends and family for all the support they gave me during my studies.
Table of contents
Résumé ... I Abstract ... II List of tables ... III List of figures ... IV List of abbreviations ... V Acknowledgments ... VII
Introduction ... 1
Overview of autism spectrum disorder ... 1
Sensorimotor differences in ASD vs typical development (TD) ... 3
Effect of age on sensorimotor skills in ASD versus TD ... 5
Clinical symptom severity and sensorimotor skills in ASD ... 7
Clinical interventions to improve sensorimotor skills ... 8
Study objectives ... 9
Aims and hypotheses ... 10
Abstract ... 12
Sensorimotor skills in autism spectrum disorder: a meta-analysis ... 13
Introduction ... 13
Sensorimotor differences in ASD vs typical development (TD) ... 13
Effect of age on sensorimotor skills in ASD versus TD ... 14
Previous meta-analysis of sensorimotor skills in ASD ... 16
Aims and hypotheses ... 17
Keywords ... 18
Study inclusion and exclusion criteria ... 20
Study selection and data collection process ... 21
Selection of data for each aim ... 22
Data analyses ... 32
Heterogeneity measure ... 33
Publication bias ... 33
Results ... 34
Aim 1: Sensorimotor differences between ASD and TD ... 34
Gait differences in ASD vs TD ... 36
Aim 2: Effect of age on sensorimotor skills in ASD ... 37
Aim 3: Effect of clinical severity on sensorimotor skills in ASD ... 39
Measuring between-study heterogeneity ... 40
Publication bias ... 40
Discussion ... 42
Fine and gross sensorimotor skills ... 42
Age effect in sensorimotor skills ... 43
Clinical severity ... 45
Strength and Limitations of this meta-analysis ... 46
Future directions ... 47
General discussion ... 50
Contributions of this master’s thesis to research in sensorimotor skills in ASD ... 50
Implications ... 53
Novelty of this master’s thesis ... 54
Future directions ... 55
Conclusion ... 57
References ... 58 APPENDIX 1. Tables included for the sensorimotor differences analyses ... VII APPENDIX 2. Summary of studies included in the age analysis ... XXXVIII APPENDIX 3. Summary of studies included in the clinical severity analysis ... XXXIX
Introduction
Autism spectrum disorder (ASD) is a complex neurodevelopmental condition that is characterized by difficulties in social and communication skills, restricted patterns of behaviour, and often atypical sensory and motor skills. Daily sensorimotor behaviours such as buttoning up a coat require the integration of sensory information and motor output. Intact sensorimotor integration is crucial to accomplish routine tasks, but it is not yet clear how consistently sensorimotor abilities are impaired in ASD. Additionally, very little is known about how atypical sensorimotor skills in ASD may vary across development and in relation to clinical symptom severity. The main objective of this thesis was to expand our
understanding of sensorimotor skills in ASD by conducting several complementary meta-analyses on data from the current literature. In order to guide understanding and reading, the introduction of this thesis is divided into several sections. The first part gives an overview of ASD, while the second part provides a synthesis of the literature on sensorimotor differences in ASD in comparison with the neurotypical population. This section also provides further background on the effect of age on sensorimotor skills and relationship between
sensorimotor skills and ASD symptom severity. The third part focuses on current clinical interventions and the potential to improve sensorimotor skills in ASD. The final part details the objectives and hypotheses of this study.
Overview of autism spectrum disorder
The earliest description of symptoms of autism emerged in 1943, in a report
describing several children that shared common characteristics. These descriptions included withdrawal from the outside world, sensitivity to sounds, motions, and direct physical
contact, as well as delayed or lack of acquired language (Kanner, 1943). Although there is marked variability in the symptomatology and presentation of this disorder, these
characteristics remain components of the modern clinical definition of autism spectrum disorder. The current DSM-V defines ASD as a heterogeneous neurodevelopmental disorder characterized by social and communication impairments, and restricted and repetitive
patterns of behaviour (American Psychiatric Association, 2013). For example, an infant with ASD might not respond to his name by 12 months of age, has delayed speech and language skills, repeats words or phrases over and over (echolalia), lines up toys or other objects, and plays with toys the same way every time (Johnson, 2004).
ASD prevalence is one in 59 children as of 2014 (U.S. Centers for Disease Control and Prevention, 2014), with a 3:1 incidence in males compared to females (Loomes, Hull & Mandy, 2017). This represents a 15 percent increase in ASD diagnosis rate compared to 2012. Evidence suggests that prevalence changes in ASD are mostly attributable to a combination of greater public awareness, lower age at diagnosis, and changes in the diagnostic constructs and corresponding diagnostic criteria (Smith, Reichow & Volkmar, 2015). In the Diagnostic and Statistical Manual for Mental Disorders, 5th Edition (DSM-V) released in May 2013, changes include major alterations in criteria for developmental disorders, in particular, for ASD. Under the DSM-V, previous diagnostic subcategories of ASD were eliminated, unifying the three previously distinct diagnoses of autistic disorder, Asperger’s disorder, and pervasive developmental disorder, not otherwise specified. The diagnosis of ASD puts particular emphasis on atypical behaviours that emerge very early in development (American Psychiatric Association, 2013). However, while behavioural symptoms of ASD are generally distinct in the second year of age, conventional markers of
ASD such as atypical social behaviour are less reliable during the first year of age
(Zwaigenbaum, Bryson & Garon, 2013). For example, infants below the age of one show the same amount of shared smiles (Ozonoff et al., 2010) and affective responsivity in face-to-face interaction with their parent (Young, Merin, Rogers, & Ozonoff, 2009). However, some sensorimotor behaviours have shown clear atypicalities in ASD during infancy (Brisson, Warreyn, Serres, Foussier & Adrien-Louis, 2012), as well as underlying sensory and motor abilities (Thomas et al., 2016; Elsabbagh & Johnson, 2016). These findings led to the idea that ASD may first emerge not in the social and communicative domains but potentially in sensory, motor, and sensorimotor integrative processes (Wozniak, Leezenbaum, Northrup, West & Iverson, 2017). Thus, outside the core atypicalities that are used to diagnose ASD, motor skills and especially sensorimotor skills also appear to be affected and could be considered as a symptom in ASD (Sutera et al., 2007).
Sensorimotor differences in ASD vs typical development (TD)
Sensorimotor integration is defined as the ability of the central nervous system to integrate different sources of stimuli, and in parallel, to transform such inputs into motor actions (Machado et al., 2010). For example, postural control requires the integration of information from visual, somatosensory and vestibular systems to control motor output. Likewise, motor behaviours as diverse as grasping an object or regulating walking gait requires the integration of sensory information (Jasmin et al., 2009). Intact sensorimotor integration is crucial to accomplish routine tasks, but it is not yet clear how broadly or consistently sensorimotor skills are impaired in ASD. Interest in sensorimotor abilities in ASD has also grown due to evidence that sensorimotor impairments could play a causal role in the development and maintenance of core communication and social symptoms (Bhat,
Landa & Galloway 2011; Page & Boucher 1998). If this hypothesis is confirmed, it provides an empirical foundation to optimize therapeutic interventions. A first necessary step to address this issue is to better characterize sensorimotor symptoms in ASD as well as their relationship with development and core measures of symptom severity. A global and
exhaustive portrait of sensorimotor deficits in ASD cannot be based on the results of a single study, but rather needs a quantitative synthesis of the available results across studies. In fact, although sensorimotor skills are recognized to be impaired in ASD versus TD, this domain is vastly understudied and our knowledge is based on sporadic findings on studies with small samples. Due to considerable individual differences and the large spectrum of this condition, the extent and circumstances of sensorimotor impairments are not clear. For example, some research has shown decreased motor skills in ASD particularly in terms of clumsiness, motor coordination, postural instability, and motor functioning (Bauman, 1992; Ghaziuddin & Butler, 1998; Jones & Prior, 1985; Kohen-Raz et al., 1992; Molloy et al., 2003; Rapin, 1997 ; Rogers et al., 1996; Vilensky et al., 1981). However, other work has shown no or minimal differences in motor skills in ASD relative to TD (Provost et al. 2007). In a recent literature review, Hannant, Tavassoli & Cassidy (2016) reported that children with ASD have difficulties coordinating sensory input into planning and executing movement
effectively. Still, this review is limited in that it did not provide a quantitative meta-analysis of these studies (Hannant et al., 2016). To date only one previous meta-analysis has
investigated sensorimotor skills in ASD versus TD (Fournier et al., 2010). Fournier and colleagues (2010) found important deficits in motor coordination, arm movement, gait, and postural stability in ASD overall. The meta-analysis by Fournier is important but presents some important limitations. Firstly, it was published 10 years ago. Consequently, it omits
more recent studies, and the field of research will benefit from an updated quantitative meta-analysis of empirical results. Secondly, the Fournier meta-analysis did not address how the severity of impairment may depend on the type of sensorimotor behaviour (e.g., gross and fine sensorimotor skills) in individuals with ASD. This is crucial, because it has an impact on different behaviors. For instance, gross sensorimotor skills are the fundamental skills that children learn and use to explore and navigate their environment like walking up stairs, running, kicking a ball, etc. Fine sensorimotor skills consist of movements of small muscles (eg, those of the hands, feet, tongue, lips, and face) and are the basis of coordination (Lloyd, MacDonald & Lord, 2013). To these aims, the present thesis provides up-to-date quantitative meta-analyses to determine whether sensorimotor differences are impaired in ASD, and if so, which sensorimotor systems or behaviours, such as fine and gross sensorimotor skills, are the most relevant.
Effect of age on sensorimotor skills in ASD versus TD
Sensorimotor impairments in ASD can impact daily life across different stages of development. For example, as children with neurotypical development arrive at school, they are usually able to dress and undress themselves. On the other hand, some adolescents and adults with ASD cannot perform these tasks without constant assistance (Wozniak et al., 2017). Adults with ASD may also have difficulty in reaching and grasping objects, as well as controlling their strength relative to the object while it is held (Hardan, Kilpatrick, Keshavan & Minshew, 2003). As a neurodevelopmental disorder, differences in both genetic and environmental factors may lead to variations in the timing of development in behaviour for individuals with ASD (Wozniak et al., 2017), and an early critical period for sensorimotor deficits may exist below the age of two (Hannant et al., 2016). Accordingly, a number of
studies suggest that between infancy and adulthood, sensorimotor skills undergo a different developmental trajectory in ASD than TD. In a retrospective study of case records of 21 children with ASD during the first two years of life, Malhi & Singhi (2014) reported that two thirds of the children presented lack of speech, inability to follow verbal commands, lack of pretend play, no index finger pointing, difficulty in playing with toys in a constructive manner, lack of joint attention, and motor stereotypies. Cheng, Chan, Hsu & Liu (2017) reported that children and adolescents with ASD, but not adults, exhibit reduced
sensorimotor gating function compared to TD controls. In addition, a review by Mosconi & Sweeney (2015) notes that individuals with autism show limited improvement in a range of sensorimotor abilities during childhood and early adolescence while no improvement is observed from adolescence to adulthood. Finally, Weiss, Moran, Parker & Foley (2013) found that older teens and young adults with ASD differ widely in their gait compared to TD and that these differences found are far more pronounced compared with younger
individuals diagnosed with ASD vs TD.
However, there are other examples where sensorimotor abilities were found to undergo equivalent developmental changes in ASD as compared to TD, despite overall impairment. Siaperas and colleagues (2011) reported that children with ASD showed significant impairment of movement performance as well as proprioceptive and vestibular processing, but without presenting any interaction effects of age and clinical group on the level of performance deficit. Moreover, Young and colleagues (2011) found that 12-24 months old children who were diagnosed with ASD by 3 years old exhibited delayed imitation development compared to a low-risk typical outcome group, but were
to ASD. Fournier and colleagues (2010) have reported that motor impairments in ASD are consistent regardless of age groupings and seem to be pervasive in time.
Overall, due to the heterogeneity of the results in the literature and in order to better understand these developmental differences, there is a considerable need to study the effect of age on individuals with a diagnosis of ASD compared to TD controls.
Clinical symptom severity and sensorimotor skills in ASD
The core symptoms in ASD are social and communication impairments, and restricted, repetitive patterns of behaviour (American Psychiatric Association, 2013). Severity in ASD is typically assessed with diagnostic instruments such as the Autism Diagnostic Observation Schedule (ADOS) and Autism Diagnostic Interview-Revised (ADI-R), as well as social and communication focused measures like the Social Responsiveness Scale (SRS). Evidence for a link between motor impairments and severity in ASD was first documented by Hilton and colleagues (2007). However there is a need for greater insight and study into the role that sensorimotor impairments play in overall ASD severity.
Some recent studies have suggested that sensorimotor difficulties in ASD can account for reduced social attention early in development, with a subsequent effect on later social, communicative and emotional development (Hannant et al., 2016; MacDonald, Lord & Ulrich, 2013; Matsushima & Kato, 2013). Dziuk and colleagues (2007) found that the level of dyspraxia in children with ASD was associated with their overall level of
impairment in social, communication and repetitive behaviour domains. More specifically, Hannant and colleagues (2016) propose that sensorimotor difficulties not only contribute to non-social difficulties, but also affect the development of social behaviours such as
responding appropriately. For example, the significant impairments shown by children with ASD include skilled motor gestures, imitations (Mostofsky et al., 2006) and development of speech sound production (Page & Boucher, 1998). Children with ASD are also less
competent at recognizing emotions in others (Cummins, Piek & Dick, 2005) and are more likely to have increased anxiety on the playground due reduced social interaction (Bhat, Land & Galloway, 2011).
Although the current DSM-5 criteria (American Psychiatric Association, 2013) evaluate ASD severity based on social communication impairments and restricted/repetitive behaviours, these studies demonstrate that sensorimotor impairments may also have a considerable importance in the development of ASD. Thus, it is important to study the relationship between clinical symptom severity and sensorimotor skills in ASD in order to define this link quantitatively and facilitate future targeted interventions with this population. As Hannant and colleagues (2016) have pointed out, no studies have explored the impact of sensorimotor difficulties on the development or the maintenance of core ASD symptoms in any detailed way. However, there are a number of studies that have examined this question in a more basic manner, by calculating correlations between symptom severity measures and sensorimotor ability, and these studies are analyzed in the current meta-analyses.
Clinical interventions to improve sensorimotor skills
As awareness for ASD has increased in recent years, there are still few interventions targeting sensorimotor skills (Hannant et al., 2016). A review by Baranek (2002) notes that sensory or motor treatments are commonly used as a complement to a more holistic
addressing an individual’s sensorimotor impairments. Some interventions directed at sensorimotor deficits also require the child to tolerate various sensory or physical
manipulations by a therapist (Baranek, 2002). In contrast, interventions based on creative movement and dance offer a practical and feasible option for children with ASD, regardless of physical capabilities (Behrends, Müller & Dziobek, 2012). A recent review showed benefits of dance-movement therapy (DMT) on sensorimotor integration in ASD (Srinivasan & Bhat, 2013). DMT is a holistic form of therapy aimed at providing physical, social, and cognitive benefits to participants. More specifically, the physical benefits of dance include increased balance, flexibility, muscular tone and strength, endurance and spatial awareness (Scharoun, Reinders, Bryden & Fletcher, 2014). While children with ASD typically have poor sensorimotor integration, DMT contributes to increase their movement repertoire (Erfer, 1995). From another perspective, movement and dancing are innate means of
communication (Boris, 2001; Koff, 2000), thus provide a nonverbal means of expression for children who have difficulties communicating (Freundlich, Pike, & Schwartz, 1989), such as individuals with ASD. While the study reports are promising, the existing literature in the area of DMT and ASD is largely qualitative with few empirically based studies (Devereaux, 2012). Thus, there is a considerable need to study quantitatively individual differences in the extent and dimensions of sensorimotor deficits in ASD in order to optimize possible clinical interventions in DMT.
Study objectives
A deeper understanding of sensorimotor abilities in ASD is key to better refine the ASD phenotype and to guide sensorimotor-based interventions such as dance-movement
therapy. To these aims, the present research undertook a quantitative behavioural meta-analysis of systematically reviewed work on sensorimotor skills in ASD versus TD.
Unlike literature reviews, meta-analyses offer the advantage of providing both a systematic and quantitative (statistical) analysis of previous data (Lipsey & Wilson, 2001). Systematic reviews involve a detailed research strategy decided a priori to reduce bias by identifying and synthesizing all relevant studies on a particular topic. In addition, meta-analyzes use statistical techniques to synthesize data from multiple studies into a single quantitative estimate or summary effect size. It is capable of finding effects that are obscured in other approaches and provides an organized way of handling information from a large number of study findings (Uman, 2011; Lipsey & Wilson, 2001).
Aims and hypotheses
The main objective of this thesis was to provide a quantitative and exhaustive synthesis of the available literature on sensorimotor skills in ASD through several complementary meta-analyses. The specific aims were as follows:
Aim 1 was to determine whether sensorimotor differences are a major feature in ASD, and if so which ones (gross vs fine sensorimotor skills). Significant sensorimotor differences were expected in ASD compared to TD group and in particular for motor coordination, arm movement, gait and postural stability (Fournier et al., 2010).
Aim 2 was to examine the effect of age on sensorimotor skills in ASD. Performance improvements were expected with age in ASD (Hannant et al., 2016).
Aim 3 was to examine the relationship between sensorimotor skills and the clinical symptom severity of ASD, particularly with social and communication skills. Sensorimotor
skills were expected to be more impaired as a function of greater clinical severity of ASD symptoms (Hannant et al., 2016).
Abstract
Background : Sensorimotor skills are often reported as atypical in individuals with autism spectrum disorder (ASD). Little is known about how sensorimotor skills in ASD may vary across development and with symptom severity. The main objective of this study was to conduct a comprehensive quantitative meta-analysis of sensorimotor skills in ASD. The specific aims were: to assess the consistency of atypical gross and fine sensorimotor skills in ASD, to examine the effect of age on sensorimotor skills in ASD and to examine the
relationship between sensorimotor skills and ASD symptom severity.
Method : An exhaustive search was conducted in Psycnet, PubMed, Web of Science and Cochrane Database to identify studies in ASD from 1980 to 2018 that involved quantitative evaluations of motor coordination, motor impairments, arm movement, gait, postural
stability, visuomotor or auditory motor integration. A total of 139 studies were included and this represent 3436 individuals with ASD.
Results : Results strongly support the presence of deficits in overall sensorimotor abilities in ASD (Hedges’ g = 1.22, p < 0.001) and these atypicalities extended to fine and gross
sensorimotor abilities. Sensorimotor abilities increased with age, but did not appear to covary with symptom severity.
Conclusions : These results highlight the importance to target these deficits in future
interventions and consider the impact of sensorimotor impairments across research, therapy, and educational settings.
Keywords: autism spectrum disorder, sensorimotor skills, motor coordination, motor impairments
Sensorimotor skills in autism spectrum disorder: a meta-analysis
Introduction
Autism spectrum disorder (ASD) is a complex and heterogeneous
neurodevelopmental disorder characterized by social and communication impairments and restricted, repetitive patterns of behaviour (American Psychiatric Association, 2013). In addition to these core features, sensory and motor skills are often affected in ASD.
Sensorimotor integration is defined as the ability of the central nervous system to integrate different sources of stimuli, and in parallel, to transform such inputs into motor actions (Machado et al., 2010). For example, postural control requires the integration of information from visual, somatosensory and vestibular systems to control motor output. Likewise, motor behaviours as diverse as grasping an object or regulating walking gait require the integration of sensory information. While intact sensorimotor integration is essential to navigate our everyday world, little is known about sensorimotor skills in ASD and in particular how these abilities change across development and with clinical symptom severity. A better
understanding of these dimensions will provide a foundation to optimize therapeutic interventions.
Sensorimotor differences in ASD vs typical development (TD)
A number of studies have reported impaired sensorimotor skills in ASD versus TD. However, due to considerable individual differences within ASD, the extent and
circumstances of these differences are not clear. For example, some research has shown impaired motor skills in ASD particularly in terms of clumsiness, motor coordination, postural instability, and motor functioning (Bauman, 1992; Ghaziuddin & Butler, 1998;
Jones & Prior, 1985; Kohen-Raz et al., 1992; Molloy et al., 2003; Rapin, 1997 ; Rogers et al., 1996; Vilensky et al., 1981). However, other work has shown no or minimal differences in motor skills in ASD relative to TD (Provost et al., 2007). In a recent literature review, Hannant, Tavassoli & Cassidy (2016) reported that children with ASD have difficulties coordinating sensory input into planning and executing movement. Still, the Hannant and colleagues (2016) review is limited in that it did not provide a quantitative meta-analysis of these previous results.
Effect of age on sensorimotor skills in ASD versus TD
There is some evidence to suggest that sensorimotor skills develop differently in ASD than TD. In a retrospective study of case records of 21 children with ASD during the first two years of life, Malhi & Singhi (2014) reported that two thirds of the children
presented lack of speech, inability to follow verbal commands, lack of pretend play, no index finger pointing, difficulty in playing with toys in a constructive manner, lack of joint
attention, and motor stereotypies. Hannant and colleagues (2016) have proposed a critical period for the impact of sensorimotor deficits on cognitive and social development below the age of two, so these early atypicalities may have prolonged consequences. Later in
development, Cheng, Chan, Hsu & Liu (2017) reported that children and adolescents with ASD, but not adults, exhibit reduced sensorimotor gating function compared to TD controls. In addition, a review by Mosconi & Sweeney (2015) notes that individuals with autism show limited improvement in a range of sensorimotor abilities during childhood and early
adolescence while no improvement is observed from adolescence to adulthood. Finally, Weiss, Moran, Parker & Foley (2013) found that older teens and young adults with ASD
differed widely in their gait compared to TD and that differences at this stage of development were far more pronounced compared with younger individuals.
In contrast, Siaperas and colleagues (2011) reported that children with ASD showed significant impairment of movement performance as well as proprioceptive and vestibular processing, but no interaction effect between age and clinical group was found. Moreover, Young and colleagues (2011) found that 12-24 months old children who were diagnosed with ASD by 3 years old exhibited delayed imitation development compared to a low-risk typical outcome group, but were indistinguishable from other high-risk infants who showed other cognitive delays not related to ASD. Overall, the heterogeneity of these results
highlights the considerable need to study the effect of age on sensorimotor abilities in individuals with ASD.
Clinical symptom severity and sensorimotor skills in ASD
In addition to examining the effect of age on sensorimotor skills, there is also a critical need to examine how these skills are related to clinical symptom severity. Some recent studies have shown that the degree of sensorimotor impairment can account for reduced social attention early in development in ASD, with a subsequent effect on later social, communicative and emotional development (Hannant et al., 2016; MacDonald, Lord & Ulrich, 2013; Matsushima & Kato, 2013). Dziuk and colleagues (2007) found that the level of dyspraxia in children with ASD was associated with their overall level of
impairment in social, communication, and repetitive behaviour domains. More specifically, Hannant and colleagues (2016) suggest that sensorimotor difficulties not only contribute to non-social difficulties, but also affect the development of social behaviours such as
responding appropriately. For example, the significant impairments shown by children with ASD have included skilled motor gestures, imitations (Mostofsky et al., 2006), and
development of speech sounds production (Page & Boucher, 1998). Children with ASD are also less competent at recognizing emotions in others (Cummins, Piek & Dick, 2005) and are more likely to have increased anxiety on the playground due reduced social interaction (Bhat, Land & Galloway, 2011).
Although the current DSM-5 criteria (American Psychiatric Association, 2013) evaluate ASD severity based on social communication impairments and restricted/repetitive behaviours, these studies demonstrate that sensorimotor impairments may also have a considerable importance in the development of ASD.
Previous meta-analysis of sensorimotor skills in ASD
To date only one previous meta-analysis has investigated sensorimotor skills in ASD compared with TD (Fournier et al., 2010). Fournier and colleagues found important deficits in motor coordination, arm movement, gait, and postural stability in ASD overall. They also reported that sensorimotor impairments in ASD were consistent regardless of age groupings and appeared to remain present across the lifetime. However, as the Fournier analysis was conducted almost 10 years ago it does not include more recent studies, and the field of research will benefit from an updated quantitative meta-analysis of empirical results. Although the Fournier analysis did consider age and type of diagnosis as potential
moderators of sensorimotor differences between ASD and TD, they adopted a categorical approach that did not directly evaluate whether ability measures are correlated with age or with variation in clinical severity within ASD. In addition, that meta-analysis did not address
in individuals with ASD. Gross sensorimotor skills are the fundamental skills that children learn and use to explore and navigate their environment like walking up stairs, running, kicking a ball, etc. In contrast, fine sensorimotor skills consist of movements of small muscles (e.g., those of the hands, feet, tongue, lips, and face) and are the basis of coordination (Lloyd, MacDonald & Lord, 2013). By better understanding individual
differences in the extent and dimensions of sensorimotor deficits in ASD, it is expected that interventions can be better designed to target these deficits. Thus, it is important to
determine which types of sensorimotor skills are the most impaired and also to define which movements are the most difficult for individuals with ASD.
In summary, the present research will provide an up-to-date quantitative
meta-analysis to determine whether sensorimotor impairment is a major feature in ASD, and if so, which sensorimotor systems or behaviours are most relevant. As reflected in the current literature, there is a considerable need to study quantitatively the effect of age on individuals with ASD and to study the relationship between clinical symptom severity and sensorimotor skills in ASD. The ultimate mission of this research is to set a theoretical groundwork for future sensorimotor-based interventions (such as music and dance) in ASD.
Aims and hypotheses
The main objective of this study was to conduct a quantitative meta-analysis of sensorimotor skills in ASD. The first aim was to determine whether sensorimotor differences are a major deficit in ASD, and if so which types of abilities are impaired (e.g., gross, fine sensorimotor skills). Significant sensorimotor differences were expected in ASD and in particular for motor coordination, arm movement, gait and postural stability (Fournier et al., 2010). The second aim was to examine the effect of age on sensorimotor skills in ASD.
Performance improvements were expected with age in ASD (Hannant et al., 2016). The third aim was to examine the relationship between sensorimotor skills and the clinical symptom severity of ASD, particularly with social and communication skills. Sensorimotor skills were expected to be more impaired as a function of greater clinical severity of ASD symptoms (Hannant et al., 2016).
Methods Keywords
An exhaustive search for ASD studies published between 1980 and November 2018 was conducted in four online databases: (a) Psycnet (b) PubMed (c) Web of Science and (d) Cochrane Database of Systematic Reviews. Twelve keywords and phrases dictated the search: autism, asperger, autistic, motor coordination, motor impairment, gait, arm
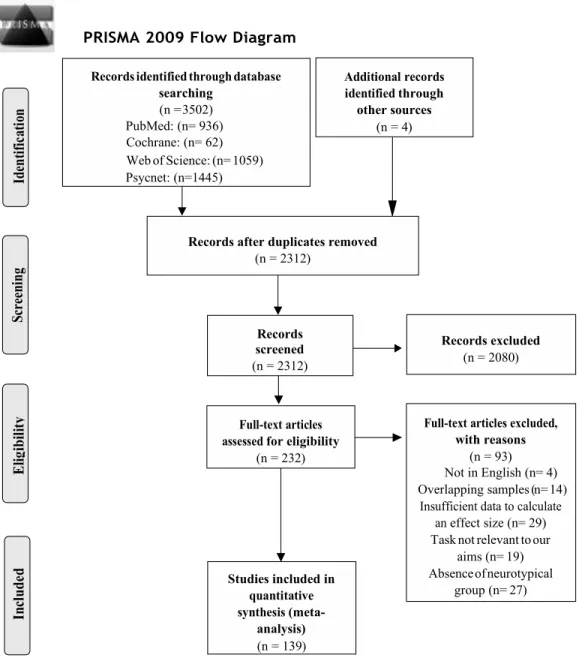
movement, postural stability, motor skill, motor control, visu* motor, or auditor* motor. The use of broad selection criteria without excluding any quantitative study at this point of the literature search was consistent with recommendations (Rosenthal, 1995). Additional searches included works cited by relevant articles, as well as unpublished theses indexed in databases including ProQuest and Papyrus. In total, these searches identified 3236 database records that matched the keywords. After removing 928 duplicates, a total of 2308 studies were then evaluated for the following inclusion/exclusion criteria. A Preferred Reporting Items for Systematic Reviews and Meta-Analyses (PRISMA; Liberati et al., 2009) diagram summarizing the number of studies meeting the search criteria is shown in Figure 1.
Figure 1. PRISMA flow chart explaining article inclusion/exclusion process.
PRISMA 2009 Flow Diagram
through other sources (n = 4) searching (n = 3502) PubMed: (n= 936) Cochrane: (n= 62) Web of Science: (n= 1059) Psycnet: (n=1445) Studies included in (meta-analysis) (n = 139) with reasons (n = 93) Not in English (n= 4) Overlapping samples (n= 14) effect size (n= 29) Task not relevant to our
aims (n= 19) Absence of neurotypical
group (n= 27) Records excluded
(n = 2080) Records after duplicates removed
(n = 2312) Records screened (n = 2312) for eligibility (n = 232)
Study inclusion and exclusion criteria
For inclusion, studies were required to present quantitative experimental results and be written in English or in French. If work presented in a thesis was also published as a peer-reviewed scientific article, the scientific article took precedence for inclusion because of the peer-review. Adding to the above criteria, six global pre-determined inclusion criteria were used in this meta-analysis:
• The first criterion required studies to report data from a sample of individuals with a diagnosis of ASD. 1402 studies were discarded based on this criterion.
• A second criterion required that studies report data from tasks within the scope of this meta-analysis’ aims, i.e. evaluations of motor coordination, motor impairments, arm movement, gait, postural stability, visuomotor or auditory motor integration. 654 studies were excluded based on this criterion.
• A third inclusion criteria required the studies to have a cross-sectional, longitudinal or retrospective study design. This criterion resulted in the exclusion of one
qualitative study, 2 commentary studies, 16 literature reviews, 4 meta-analyses and one book section.
• A fourth criterion was that studies must involve a human sample. One study was discarded because it only presented empirical results from animals.
• A fifth criterion was the presence of a comparison group of TD controls. ASD studies without a TD control group, and without any data relevant to our within-ASD aims on age or clinical severity, were not analyzed further. A total of 27 studies did not report TD control data and were excluded.
• The sixth criterion concerned data extraction problems. Studies that did not report values required to calculate effect size statistics for the present analyses were excluded. Based on this criterion, 70 studies were discarded.
Study selection and data collection process
After the first screening based on titles and abstracts, 232 studies remained and were coded. Each of the included studies was coded by the first author (SMC) and quantitative data for the meta-analysis was extracted. In addition, a second researcher (AM) completed coding of a randomly selected subset comprising 45 studies, which represented 32% of the total studies. Inter-rater agreement on this subset was 91%. The coding system compiled information from each article across seven categories: (a) quantitative data for calculation of effect sizes from measures relevant for the present meta-analyses (motor coordination, motor impairment, arm movement, gait, postural stability, motor skill, motor control, visuomotor and auditory motor integration) (b) experimental design, (c) group diagnostic definitions (e.g. ASD, Asperger syndrome) (d) group demographic characteristics (age, gender, country) (e) sample sizes for each included group (f) ASD severity scores, and (g) research quality. Research quality was evaluated with an adaptation of the Cochrane’s quality assessment tool for quantitative studies (National Collaborating Centre for Methods and Tools 2008). Four sections were evaluated: selection of participants, differences between groups (age and gender), data collection methods (validity and reliability) and withdrawals or drop-outs. A score of one was given if no weak rating was present in the section, a two was given if there was one weak rating and a three was given if two or more weak ratings were present. Since the judgement was based on objective evaluation criteria, no inter-rater agreement was
applied for this tool.Authors were contacted to request any missing data as necessary. Once the coding was completed, 86 studies were discarded based on the following criteria:
overlapping samples with another study (n=14), insufficient data to calculate effect size (n=29), no comparable TD group (n=27), studies in a language other than English or French (n=4), and studies without a motor component task (n=12) or a gait velocity measure (n=7). Characteristics of the 139 studies that proceeded to further analyses are listed in Table 1.
Selection of data for each aim
Within the range of sensorimotor abilities listed in the previous section, several types of outcome measure were identified: (a) standard motor scales (e.g. BOTMP, MABC-2, PDMS, PANESS, Vineland Motor Standard Score, Beery-VMI, Grooved Pegboard test, Zurich neuromotor assessment, TGMD-3) (b) stability of balance (e.g. center of pressure, sway area) (c) movement/reaction time (d) handwriting size of letters (e) rhythmic tapping to an external stimulus (e.g. phase, latency) and (f) gait velocity. Outcomes were categorized as a fine or gross sensorimotor measure based on the definition of Lloyd, MacDonald & Lord (2013). Two authors (SMC & NF) confirmed the final list of studies to be included in the current meta-analyses, and these authors (SMC & NF) were involved in interpreting the meta-analytic results. Consistent with conventional meta-analysis techniques and in order to maintain independence of values entered into the analyses (Borenstein et al., 2009), only one outcome measure per study was selected for each analysis. In the overall comparison
between ASD and TD, comprehensive measures and batteries (e.g., Movement Assessment Battery for Children) were favoured when available. In the analyses of fine and gross sensorimotor categories in ASD and TD, measures that best fit the category of interest were
selected, and comprehensive measures were excluded unless an appropriately specific fine or gross subscore was available. In addition, 11 studies reported data from multiple ASD
groups that were collectively of interest for the present analyses (e.g., groups labelled as “high” and “low-functioning”). In these cases, data were aggregated across the groups so that a single effect size was entered into analyses from each study (Lipsey & Wilson, 2001). A total of 139 studies was included for the first aim. Detailed summaries of studies included in the comparisons of sensorimotor ability between ASD and TD are presented in
Appendix 1.
Comparison of gait measures was performed in a separate analysis. Kindregan, Gallagher & Gormley (2015) report in a meta-analysis that preferred walking velocity is a commonly used general measure to evaluate gait, but it is not clear that either a faster pace or slower pace in ASD would be considered an advantage. Rather than impose an
assumption about the direction of the effect (e.g., that a greater preferred walking velocity is better, compared to TD, and a slower velocity represent impairment), the meta-analysis of gait was performed separately to determine whether individuals with ASD exhibit a faster or slower walking velocity compared to TD. A total of 10 studies was included. These outcome measures are presented in Table 1 and further details are presented in Appendix 1.
For the aim regarding effects of age on sensorimotor skills in ASD, only studies reporting a Pearson correlation between age (as a continuous variable) and a sensorimotor measure within an ASD group were included. A TD group was not required for this aim. A total of 5 studies was included. A summary of studies included for this aim is presented in Table 1 and more details are presented in Appendix 2.
For the aim concerning the influence of clinical severity on sensorimotor skills in ASD, only studies reporting a Pearson correlation between a measure of ASD severity and a sensorimotor measure within an ASD group were selected. Included severity measures were the Autism Diagnostic Observation Schedule (ADOS; Lord et al., 1989), Social
Responsiveness Scale (SRS ; Constantino & Gruber, 2005), Autism Diagnostic Interview - Revised (ADI-R; Lord, 1994), Childhood Autism Rating Scale (CARS; Schopler et al., 1980), Social and Communication Questionnaire (SCQ; Rutter et al., 2003), and the Autism Treatment Evaluation Checklist (ATEC; Edelson & Rimland, 2000). A TD group was not required for this aim. A total of 18 studies was included. A summary of studies included for this aim is presented in Table 1 and more details are presented in Appendix 3.
Table 1
List of all the studies included in this current meta-analysis
Author, Year Diagnostic groups
ASD group TD group Usage in
analyses Mean age (years) SD N Mean age (years) SD N 1 2 3 4 5 6 Abu-Dahab, 2013 HFASD; TD 11.99 0.20 73 12.11 0.17 75 X X Ament, 2015 HFASD; TD 10.27 1.28 48 10.31 1.18 69 X X X Beversdorf, 2001 HFASD; TD 30.80 9.30 10 30.60 12.8 0 13 X Biscaldi, 2014 ASD; TD 13.58 0.53 36 14.28 0.50 34 X X X Brandes-Aitkens, 2018 ASD; TD 10.30 1.70 14 10.40 1.30 28 X Brisson, 2012 ASD; TD 0.25- 0.50 - 13 0.33-0.50 - 14 X Calhoun, 2011 Asperger; TD 6.30 - 12 6.20 - 22 X Campione, 2016 ASD ; TD 5.10 0.60 9 4.70 0.60 11 X X Chang, 2010 ASD ; TD 8.75 1.34 16 8.93 1.39 22 X X Chen, 2016 ASD ; TD 11.04 1.28 16 10.97 1.17 16 X X Classen, 2013 ASD ; TD 15.14 1.22 7 14.32 0.72 22 X X X Cook, 2013 ASD ; TD 3.80 0.32 14 3.13 0.32 15 X X Cox, 2016 ASD ; TD 18.28 2.29 13 16.59 0.55 26 X X X Craig, 2018 ASD ; TD 4.60 1.10 46 4.60 1.50 43 X X X X Crippa, 2013 HFASD ; TD 6.20 2.10 14 6.30 2.30 14 X X David, 2009 HFASD ; TD 11.20 3.40 13 10.80 3.10 13 X X David, 2013 ASD ; TD 4.50 1.08 24 3.94 1.57 30 X X Dewey, 2007 ASD ; TD 10.20 3.40 49 11.30 2.40 78 X Dowd, 2012 HFASD ; TD 6.20 1.40 11 6.60 1.50 12 X X Dowell, 2009 ASD ; TD 10.26 1.70 87 10.55 1.30 50 X X X Duffield,2013 ASD ; TD 15.61 7.48 59 15.29 6.48 30 X X
Author, Year Diagnostic groups
ASD group TD group Usage in
analyses Mean age (years) SD N Mean age (years) SD N 1 2 3 4 5 6 Dyck, 2010 ASD ; TD 8.47 2.63 30 8.72 2.30 449 X X Dziuk,2007 HFASD ; TD 10.70 1.10 47 10.60 1.50 47 X X Fitzpatrick, 2017 ASD ; TD 8.65 1.34 45 8.31 1.44 53 X X X Forti, 2011 ASD ; TD 3.50 0.75 12 - - 12 X X Fournier, 2010 ASD ; TD 11.10 2.30 13 13.10 2.20 12 X X X Fournier, 2011 ASD ; TD 5.50 1.10 13 6.20 1.20 13 X X X Fournier, 2014 ASD ; TD 11.10 2.30 16 12.90 2.10 17 X X X Freitag, 2007 ASD ; TD 17.50 3.50 16 18.60 1.20 16 X X X Freitag, 2008 HFASD ; TD 16.40 2.40 12 17.90 1.60 12 X X Fuentes, 2009 ASD ; TD 10.20 1.90 14 11.10 1.30 14 X X Fuentes, 2010 ASD ; TD 14.40 1.40 12 13.80 1.20 12 X X Fukui, 2018 ASD ; TD 18.30 2.10 12 19.10 2.20 12 X X Fulceri, 2015 ASD 4.04 0.73 35 - - - X Fulceri, 2018 ASD ; TD 7.82 1.32 11 7.57 0.71 11 X X Fulkerson, 1980 ASD ; TD 10.10 - 15 7.50 - 15 X X Funahashi, 2014 ASD ; TD 8.10 0.80 16 8.20 0.70 16 X X Gepner, 2002 ASD ; TD 6.00 1.20 6 5.60 0.80 9 X X X Gepner,1995 ASD ; TD 8.50 0.84 6 8.20 2.90 12 X X X Gernsbacher, 2008 ASD ; TD 7.92 3.74 17 2 8.17 3.81 44 X X Gidley, 2008 HFASD ; TD 11.10 1.60 15 11.70 1.50 10 X X Gidley, 2008a HFASD ; TD 10.60 1.70 38 10.50 1.50 37 X X Glazebrook, 2006 ASD ; TD 26.90 6.80 9 25.10 5.10 9 X X Glazebrook, 2008 ASD ; TD 23.70 7.90 18 20.60 4.50 18 X X
Author, Year Diagnostic groups
ASD group TD group Usage in
analyses Mean age (years) SD N Mean age (years) SD N 1 2 3 4 5 6 Godde, 2018 ASD ; TD 26.30 4.60 21 26.60 4.60 21 X X X Goh, 2018 ASD ; TD 24.60 2.78 13 25.50 2.50 13 X X X Goulème, 2017 HFASD ; TD 12.10 2.90 30 11.05 0.80 30 X X X Gowen, 2005 Asperger ; TD 27.42 11.08 12 28.17 11.70 12 X X X Gowen, 2008 ASD ; TD 33.90 13.2 0 12 32.00 11.8 0 12 X X X Grace, 2017 ASD ; TD 10.58 1.37 22 10.85 1.01 20 X X Graham, 2014 ASD ; TD 13.00 3.20 26 13.40 1.90 18 X X X Green, 2016 ASD ; TD 10.57 4.76 56 11.90 5.10 36 X X X Hallett, 1993 ASD ; TD 25-38 - 5 25-36 - 5 X Hanaie, 2013 ASD ; TD 9.82 2.80 13 10.67 1.91 11 X X X Hanaie, 2014 ASD ; TD 9.50 2.60 18 10.80 2.10 12 X X X Hannant, 2016 HFASD ; TD 9.93 2.71 18 9.16 1.89 18 X X X X Hardan, 2003 ASD ; TD 19.30 9.90 40 18.60 8.60 41 X X Holloway, 2018 ASD 4.67 0.54 21 - - - X Hughes, 1996 ASD ; TD 13.42 0.57 36 3.65 0.25 28 X X Isenhower, 2012 ASD ; TD 3.94 1.50 7 3.55 11.7 0 7 X X X Jansiewicz, 2006 ASD ; TD 11.35 2.47 40 11.60 2.72 55 X X X Johnson, 2013 ASD ; TD 12.35 0.64 23 11.60 1.58 12 X X X Johnson, 2015 ASD ; TD 11.40 1.64 26 10.48 1.52 17 X X X Kaur, 2018 ASD ; TD 8.09 0.58 24 7.75 0.55 12 X X X Kohen-Raz, 1992 ASD ; TD 6-20 - 92 5-11 - 16 6 X X X Kostrubiec, 2018 HFASD ; TD 10.47 1.78 20 11.14 1.82 21 X X X Lee, 2018 ASD ; TD 10.60 1.40 18 10.00 2.00 18 X X X X
Author, Year Diagnostic groups
ASD group TD group Usage in
analyses Mean age (years) SD N Mean age (years) SD N 1 2 3 4 5 6 Lim, 2016 ASD ; TD 11.20 2.80 15 11.10 2.90 15 X Liu, 2013 ASD ; TD 7.96 - 30 7.44 - 30 X X X Mache, 2016 ASD ; TD 9.46 2.50 11 9.35 2.41 11 X X MacNeil, 2012 ASD ; TD 9.69 1.59 24 10.33 1.40 24 X X X Mandelbaum, 2006 ASD ; TD 9.00 1.92 74 8.80 0.91 37 X X X Mari, 2003 ASD ; TD 10.52 1.51 20 10.44 1.38 20 X X Markoulakis, 2012 HFASD ; TD 7.00 - 12 7.00 - 12 X X McDonald, 2018 ASD ; TD 9.48 2.13 33 9.45 2.05 33 X X McPhillips, 2014 ASD ; TD 9.91 0.65 28 10.03 0.68 28 X Memari, 2013 ASD ; TD 11.50 1.60 21 11.60 1.90 30 X X X x Memari, 2014 ASD ; TD 11.90 1.60 19 11.80 1.70 28 X X X Miller, 2014 ASD ; TD 12.60 2.20 20 11.53 2.50 20 X X Minshew, 2004 HFASD ; TD 17.00 10.4 0 79 16.70 10.5 0 61 X X X Morris, 2015 ASD ; TD 23.60 7.90 12 23.40 5.10 20 X X X Morrison, 2018 ASD ; TD 21.20 4.40 20 24.30 2.80 20 X Mosconi, 2015 ASD ; TD 15.00 8.00 28 15.00 7.00 29 X X X Mostofsky, 2006 HFASD ; TD 10.30 1.70 20 10.50 1.30 36 X X X X Mostofsky, 2007 HFASD ; TD 10.60 1.98 21 10.68 1.61 24 X Mostofsky, 2009 HFASD ; TD 10.90 1.50 12 10.50 1.40 13 X X Nazarali, 2009 ASD ; TD 26.20 4.80 12 22.80 3.30 12 X X Nobile, 2011 ASD ; TD 10.56 2.50 16 9.99 2.28 16 X Noterdaeme, 2002 ASD ; TD 9.83 2.33 11 8.08 0.58 11 X X X Nyden, 2004 ASD ; TD 12.42 0.45 30 12.51 0.58 32 X
Author, Year Diagnostic groups
ASD group TD group Usage in
analyses Mean age (years) SD N Mean age (years) SD N 1 2 3 4 5 6 Oliver, 2014 ASD ; TD 10.33 1.75 23 11.42 0.48 22 X X Ozonoff, 2008 ASD ; TD 1.00 0.08 54 0.83 2.00 24 X X Pan, 2014 HFASD ; TD 14.58 1.55 31 14.70 0.59 31 X X X Papadopoulos, 2012 ASD ; TD 9.35 0.32 53 9.10 1.63 20 X X X Pasini, 2012 ASD ; TD 10.00 0.40 12 9.60 1.60 12 X X X Pauk, 2017 ASD ; TD 7.69 2.01 28 8.30 2.10 30 X Pierno, 2008 HFASD ; TD 11.10 1.22 12 11.20 1.22 12 X X X Price, 2012 Asperger ; TD 14.14 4.80 14 14.08 4.61 16 X X Provost, 2007 ASD ; TD 2.53 0.38 19 2.52 0.45 18 X X Pusponegoro, 2016 ASD ; TD 2.80 - 24 2.90 - 24 X X Radonovich, 2013 ASD ; TD 8.18 3.40 18 8.31 4.00 28 X X X Ravizza, 2013 ASD ; TD 14.38 - 22 14.55 - 17 X X X Reinert, 2015 ASD ; TD 9.20 0.45 4 7.40 2.06 5 X Rinehart, 2006a ASD ; TD 10.05 3.20 24 10.05 - 12 X X Rinehart, 2006b ASD ; TD 12.93 4.15 30 13.10 3.11 21 X X Rinehart, 2006c ASD ; TD 10.67 0.90 20 10.73 3.37 10 X Rinehart, 2006d ASD ; TD 5.10 3.23 11 5.90 3.60 11 X Riquelme, 2016 HFASD ; TD 6.30 3.23 27 6.50 - 30 X X Sachse, 2013 ASD ; TD 19.20 5.10 30 19.90 1.00 28 X X Sahlander, 2008 Asperger ; TD 28.50 5.20 14 19.00 - 28 X X X Schmitz, 2003 ASD ; TD 7.90 1.30 8 6.00 2.21 16 X X X Sharer, 2016 ASD ; TD 38.72 18.3 6 18 36.36 0.08 11 X X Siaperas, 2012 Asperger ; TD 10.72 2.55 50 10.84 - 50 X X X
Author, Year Diagnostic groups
ASD group TD group Usage in
analyses Mean age (years) SD N Mean age (years) SD N 1 2 3 4 5 6 Sigman, 1981 ASD ; TD 51.70 0.89 16 24.40 2.91 16 X X X Somogyi, 2016 ASD ; TD 7.83 - 18 8.08 - 12 X X X Soorya, 2004 ASD ; TD 6.48 2.67 12 6.30 1.20 12 X X X Stevenson, 2017 ASD ; TD 7.98 4.11 13 7.97 2.21 13 X X Stins, 2015 ASD ; TD 10.80 1.20 9 10.80 0.95 9 X X X Stoit, 2013 ASD ; TD 11.55 2.88 31 10.52 5.98 29 X X Sumner, 2016 ASD ; TD 8.65 1.18 30 9.11 0.95 35 X X Takarae, 2008 HFASD ; TD 15.25 5.42 36 16.54 5.98 46 X X Thompson, 2017 ASD ; TD 26.00 7.00 60 29.00 7.00 60 X X Travers, 2010 ASD ; TD 15.10 6.96 67 15.99 2.10 42 X X X Travers, 2013 ASD ; TD 19.00 2.11 15 19.00 3.80 14 X X Travers, 2015 HFASD ; TD 9.63 2.09 21 9.64 6.46 16 X X X Travers, 2018 ASD ; TD 21.80 3.20 25 21.30 2.78 26 X X X X Turner, 2006 ASD ; TD 28.10 8.30 8 28.60 0.19 8 X X Vanvuchelen, 2007 HFASD ; TD 8.75 0.92 17 8.74 0.97 17 X Vernazza-Martin, 2005 ASD ; TD 4-6 - 9 4-6 - 6 X Vlachos, 2007 ASD ; TD 10.35 0.23 14 10.42 0.19 14 X X X Wadsworth, 2017 HFASD ; TD 12.00 2.94 14 12.00 1.63 15 X X Wang, 2015 ASD ; TD 12.72 3.64 22 11.67 4.53 21 X X X X Wang, 2016 ASD ; TD 8.77 2.64 34 8.76 3.11 25 X X X X Weimer, 2001 Asperger ; TD 15.70 3.60 10 15.90 3.80 10 X X X Weiss, 2013 ASD ; TD 19.00 16-22 9 19.50 0.50 10 X Whyatt, 2012 ASD ; TD 10.03 1.20 18 10.99 3.30 19 X X X
Author, Year Diagnostic groups
ASD group TD group Usage in
analyses Mean age (years) SD N Mean age (years) SD N 1 2 3 4 5 6 Yang, 2014 ASD ; TD 7.80 1.40 20 7.90 1.50 20 X X Zachor, 2010 ASD 3.33 0.48 25 - - - X
Notes. Studies are listed in alphabetical order. HFASD = high functioning Autism Spectrum Disorder. Age range is indicated for studies that did not report mean age or standard
deviation. SD = Standard deviation of age
X indicates that a study was included in this specific analysis. 1= Sensorimotor differences between ASD and TD; 2= Fine and Gross sensorimotor skills in ASD vs TD; 3= Gross sensorimotor categories in ASD vs TD; 4= Gait in ASD vs TD; 5= Effect of age in ASD; 6= Clinical severity
Data analyses
Following meta-analytic guidelines (Lipsey & Wilson, 2001), a rigorous synthesis and analysis of the set of ASD studies were performed. This procedure involved the following steps: describing relevant characteristics of the ASD and TD groups, calculating standardized mean difference effect sizes (as Hedges’ g; Hedges, 1981) for each study, and estimating overall effect sizes and their confidence intervals using random effects meta-analyses (Rosenthal 1995; Rosenthal & DiMatteo, 2001). Individual effect sizes were calculated using the Comprehensive Meta-Analysis (CMA) software, version 2.0 (Borenstein, Hedges, Higgins & Rothstein, 2005).
To ensure consistency of effect size direction across different measures, the following approaches were followed. For effect sizes representing comparisons between ASD and TD, a greater ability (or lesser impairment) in the ASD group was given a negative sign, and lesser ability (or greater impairment) in the ASD group was given a positive sign. For the analysis of gait measures, effects representing slower walking velocity in the ASD group were given a positive sign, and faster walking velocity was given a negative sign. For the effect of age in ASD, a positive correlation represented a greater ability (or decreased impairment) with increased age, and the expected effect direction was positive. Finally, for the effect of clinical severity in ASD, a positive correlation represented greater ability (or decreased impairment) with increased clinical severity, and the expected effect direction was negative.
Random-effects meta-analyses were then performed in R version 3.5.0 using the metafor package version 2.0 (Viechtbauer, 2017). The random-effects approach accounts for
variation across studies and is recommended when studies vary in their samples or
methodology (Borenstein et al., 2009). Moreover, random effects provide for greater control for differences in sample size when estimating effect sizes (Borenstein et al., 2009).
Following the recommendations of Veroniki and colleagues, (2015), between-study
heterogeneity was estimated using the restricted maximum likelihood (REML) method, and confidence intervals were estimated using the Q-profile method. For ease of description, effect sizes are labelled in the text as “small” (g ~ 0.2; r ~ 0.1), “medium/moderate” (g ~ 0.5; r ~ 0.3) or “large” (g ~ 0.8; r ~ 0.5) following Cohen (1988); it is understood that these labels are approximate and their values may vary by research domain. Statistical significance is reported at the p < 0.05 level.
Heterogeneity measure
Heterogeneity across studies was assessed using the I2 measure (Higgins &
Green, 2006). This measure is sensitive to whether differences in results across studies are due to measuring different effects or attributable to chance, and is recommended by Cochrane Reviews (Higgins et al., 2003). I2 values of 25% indicate a low percentage of
heterogeneity, 50% indicates moderate heterogeneity and 75% indicates a high percentage of heterogeneity. Forest plots were created to display all the effect estimates and confidence intervals for both individual studies and meta-analyses (Lewis, 2001). These plots also provide an indication of heterogeneity between studies (Phan et al., 2015).
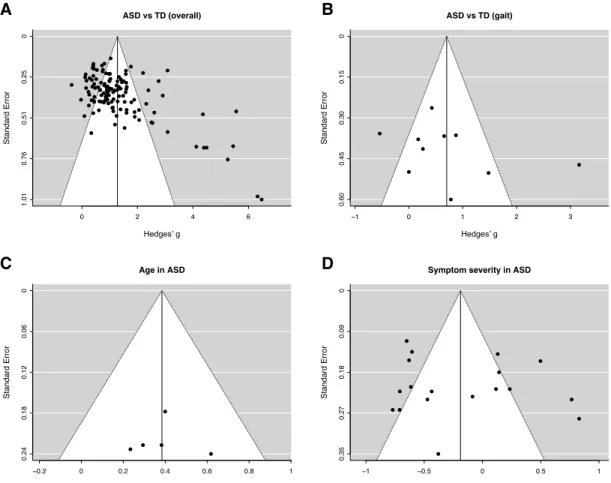
Publication bias
Publication bias refers to the increasing probability of a study being published as the effect size of its findings increases. Two techniques were used to assess the presence of
publication bias. First, as a visual diagnostic, funnel plots were generated to present the effect size of individual studies against the standard error associated with each study. Asymmetry around the triangular funnel may indicate the presence publication bias
(Rothstein et al., 2005). Second, as a quantitative diagnostic, Duval and Tweedie’s L0 trim and fill procedure was used to impute additional effect values as necessary to correct asymmetry (Duval & Tweedie, 2000), closely approximating an unbiased distribution (Borenstein et al., 2009).
Results
Aim 1: Sensorimotor differences between ASD and TD
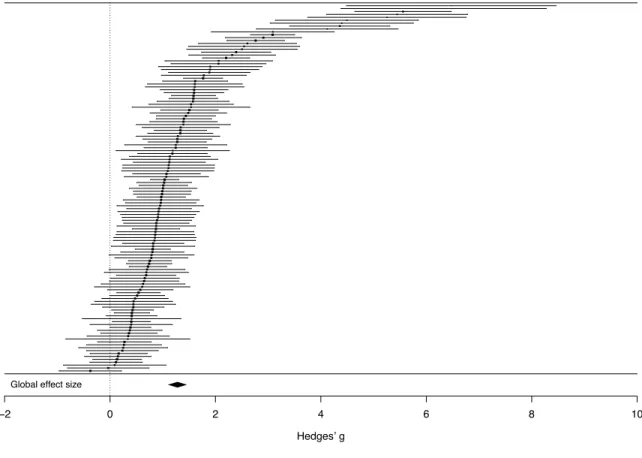
A random effects meta-analysis of 127 studies indicated a significant overall effect size of g = 1.22 (SE = 0.08; CI = 1.08-1.37; p < 0.001). This large effect indicates substantial overall deficits across motor skills, motor coordination, motor control, postural stability and visuomotor integration in ASD compared to TD. Individual effect sizes for studies in this analysis are shown in Figure 2 and Appendix 1.
Figure 2. Forest plot of effect sizes (Hedges’ g) in the comparison of overall sensorimotor abilities between ASD and TD. Positive values, to the right of the dotted line, indicate lower sensorimotor ability in the ASD group.
In order to examine these deficits in more detail, separate meta-analyses were
performed for fine (k = 81) and gross sensorimotor abilities (k = 65), confirming large effect sizes for both fine sensorimotor abilities (g = 1.11, SE = 0.09; CI = 0.93 - 1.30; p < 0.001) and gross sensorimotor abilities (g = 1.27, SE = 0.10; CI = 1.07 - 1.48; p < 0.001). These effects show that individuals with ASD present major impairments in both fine and gross sensorimotor skills (see Appendix 1 for more details). An additional analysis tested whether effect size differed between these categories of fine and gross sensorimotor skills, and found
Global effect size
−2 0 2 4 6 8 10
no difference (p = 0.472), further underlining the strong effect magnitude across both categories.
Given that gross sensorimotor skills represent a more heterogeneous category, the gross sensorimotor measures were subsequently grouped into three subcategories for further analysis: arm movements, balance and coordination. Separate meta-analyses for each of these subcategories confirmed large effect sizes representing impairments in arm movements (k = 11) (g = 1.54, SE = 0.38; p < 0.001, CI = 0.81-2.28), balance (k = 43) (g = 1.31, SE = 0.27; p < 0.001, CI = 0.78-1.84) and coordination (k = 2) (g = 1.32, SE = 0.31, p < 0.001; CI = 0.72-1.91). More details are included in Appendix 1. An additional analysis tested whether effect size differed between these subcategories, and found no difference (p = 0.875),
underlining the strong effect magnitude across all subcategories.
Gait differences in ASD vs TD
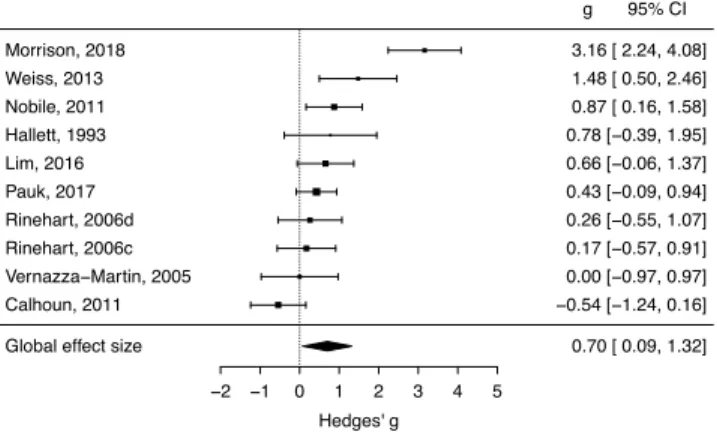
As mentioned in the methods, gait measures were analyzed separately. A random effects meta-analysis of 10 studies revealed a medium to large effect size indicating slower walking velocity in ASD compared to TD (g = 0.70, SE = 0.31; p < 0.05, CI = 0.09 - 1.32) . Individual effect sizes for studies in this analysis are shown in Figure 3 and Appendix 1.
Figure 3. Forest plot of effect sizes (Hedges’ g) in the gait analysis of ASD compared to TD. Positive values, to the right of the dotted line, indicate slower walking velocity in the ASD group.
Aim 2: Effect of age on sensorimotor skills in ASD
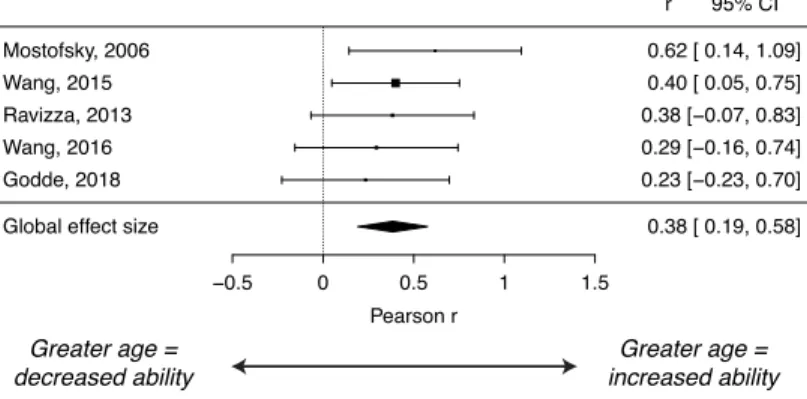
A meta-analysis of 5 studies revealed a positive overall age correlation effect of r = 0.38 (p < 0.001; CI = 0.19 - 0.58). This moderate effect indicates that greater age in
individuals with ASD was associated with improved sensorimotor abilities. The 5 studies included in this analysis used sensorimotor measures related to motor skills, motor and postural control, and the Pearson correlation values between age and sensorimotor ability ranged from 0.19 to 0.58. Individual effect sizes for studies in this analysis are shown in Figure 4 and Appendix 2.
−2 −1 0 1 2 3 4 5
Hedges' g
Global effect size 0.70 [ 0.09, 1.32]
Calhoun, 2011 −0.54 [−1.24, 0.16] Vernazza−Martin, 2005 0.00 [−0.97, 0.97] Rinehart, 2006c 0.17 [−0.57, 0.91] Rinehart, 2006d 0.26 [−0.55, 1.07] Pauk, 2017 0.43 [−0.09, 0.94] Lim, 2016 0.66 [−0.06, 1.37] Hallett, 1993 0.78 [−0.39, 1.95] Nobile, 2011 0.87 [ 0.16, 1.58] Weiss, 2013 1.48 [ 0.50, 2.46] Morrison, 2018 3.16 [ 2.24, 4.08] g 95% CI
Figure 4. Forest plot of effect sizes (Pearson r) in the age analysis in ASD. Positive values, to the right of the dotted line, indicate increased sensorimotor ability with greater age.
−0.5 0 0.5 1 1.5
Pearson r
Global effect size 0.38 [ 0.19, 0.58]
Godde, 2018 0.23 [−0.23, 0.70] Wang, 2016 0.29 [−0.16, 0.74] Ravizza, 2013 0.38 [−0.07, 0.83] Wang, 2015 0.40 [ 0.05, 0.75] Mostofsky, 2006 0.62 [ 0.14, 1.09] r 95% CI Greater age = increased ability Greater age = decreased ability
Aim 3: Effect of clinical severity on sensorimotor skills in ASD
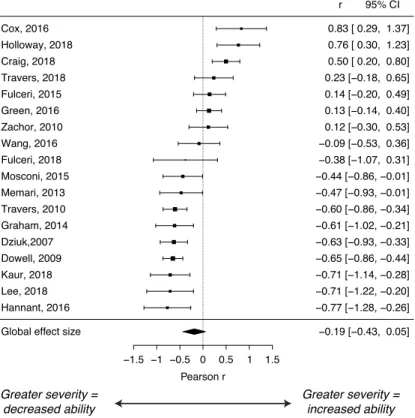
A meta-analysis of 18 studies indicated a small, non-significant correlation with clinical severity measures of r = -0.19 (p = 0.12; CI = -0.43 - 0.05). This result does not support the hypothesis that greater clinical severity in individuals with ASD correlates with decreased sensorimotor ability. Individual effect sizes for studies in this analysis are shown in Figure 5 and Appendix 3.
Figure 5. Forest plot of effect sizes (Pearson r) in the clinical severity analysis in ASD. Negative values, to the left of the dotted line, indicate lower sensorimotor ability in association with higher symptom severity measures.
−1.5 −1 −0.5 0 0.5 1 1.5
Pearson r
Global effect size −0.19 [−0.43, 0.05]
Hannant, 2016 −0.77 [−1.28, −0.26] Lee, 2018 −0.71 [−1.22, −0.20] Kaur, 2018 −0.71 [−1.14, −0.28] Dowell, 2009 −0.65 [−0.86, −0.44] Dziuk,2007 −0.63 [−0.93, −0.33] Graham, 2014 −0.61 [−1.02, −0.21] Travers, 2010 −0.60 [−0.86, −0.34] Memari, 2013 −0.47 [−0.93, −0.01] Mosconi, 2015 −0.44 [−0.86, −0.01] Fulceri, 2018 −0.38 [−1.07, 0.31] Wang, 2016 −0.09 [−0.53, 0.36] Zachor, 2010 0.12 [−0.30, 0.53] Green, 2016 0.13 [−0.14, 0.40] Fulceri, 2015 0.14 [−0.20, 0.49] Travers, 2018 0.23 [−0.18, 0.65] Craig, 2018 0.50 [ 0.20, 0.80] Holloway, 2018 0.76 [ 0.30, 1.23] Cox, 2016 0.83 [ 0.29, 1.37] r 95% CI Greater severity = increased ability Greater severity = decreased ability