Université de Montréal
Mesurer les habiletés de la population générale
à percevoir et à se synchroniser à la pulsation musicale
avec le Montreal – Beat Alignment Test (M-BAT)
par
Antoine Bellemare Pepin
Département de Psychologie Faculté des Arts et des Sciences
Mémoire présenté à la Faculté des Études Supérieures
en vue de l‟obtention du grade de Maître ès Sciences (M.Sc.) en psychologie
Août 2016
Université de Montréal
Faculté des Études Supérieures et Postdoctorales
Ce mémoire intitulé :
Mesurer les habiletés de la population générale à percevoir et à se synchroniser à la pulsation musicale avec le Montreal – Beat Alignment Test (M-BAT)
Présenté par : Antoine Bellemare Pepin
a été évalué par un jury composé des personnes suivantes :
Isabelle Peretz, directeur de recherche Frédéric Gosselin, membre du jury Nathalie Gosselin, membre du jury
I
Résumé
Il existe actuellement de nombreux tests visant à mesurer la capacité à percevoir la pulsation rythmique dans la musique ainsi que l‟habileté à synchroniser ses mouvements avec celle-ci. Ces tests présentent toutefois certaines lacunes méthodologiques (longue durée d‟administration, différence de stimuli entre les sous-tests, mauvais appariement des conditions). Le Montreal-Beat Alignment Test (M-BAT) a été élaboré afin de palier à ces lacunes et d‟offrir une mesure simple et sensible de ces habiletés. Une étude de sensibilité a été menée auprès de 90 participants. Pour la tâche de perception, nous observons une distribution avec une légère asymétrie négative et sans présence d‟effet plancher ou plafond. Les performances aux tâches de perception et de synchronisation sont modérément corrélées, suggérant qu‟une bonne perception de la pulsation s‟accompagne généralement d‟une bonne capacité à se synchroniser avec celle-ci. Également, des cas de déficits dans l‟une et/ou l‟autre de ces habiletés sont rapportés, indiquant la présence de dissociations entre perception et synchronisation à la pulsation musicale.
II
Abstract
There are currently many tests to measure the abilities to perceive the beat in music and to synchronize its movements with it. These tests, however, have certain methodological shortcomings (long duration of administration, different stimuli between sub-tests, mismatch conditions). The Montreal-Beat Alignment Test (M-BAT) has been developed to overcome these deficiencies and provide a simple and sensitive measurement of these skills. A sensitivity study was conducted with 90 participants. For the task of perception, we see a distribution with a slight negative asymmetry and without the presence of floor or ceiling effect. The performances for the perception and synchronization tasks are moderately correlated, suggesting that a good perception of the pulse is usually accompanied by a good ability to synchronize with it. Also, case deficits in one and/or the other of these skills are reported, indicating the presence of dissociations between perception and synchronization with the musical beat.
III
Table des matières
Résumé ... i
Abstract ... ii
Table des matières ... iii
Liste des tableaux ... v
Liste des figures ... vi
Liste des abréviations ... vii
Remerciements ... viii
Introduction ... 1
La perception de la pulsation ………... 1
Liens entre perception de la pulsation et synchronisation ……….3
Différences individuelles de la perception et de la synchronisation ………. 5
à la pulsation La notion du groove ……….. 5
Tests mesurant la perception de la pulsation et la synchronisation avec cette-dernière ………. 6
Objectifs et hypothèses ………. 8
Article……... 9
Apports des différents (co)auteurs) ………..……….. 11
Abstract ……….. 12
Introduction ………...…….… 13
Theoretical models of beat perception ……… 13
Linking beat perception to synchronization ……… 14
Individual variability in beat finding ……….……….. 17
Tests measuring beat perception and synchronization ……….... 19
Method ……….…………..………. 23
Participants ... 23
Tasks and stimuli ... 23
IV
Equipment ... 28
Results ……….…. 29
Groove, familiarity and BPM ... 29
Synchronization task ... 30
Beat perception task ... 32
Relationships between perception and synchronization: impairments and possible dissociations ………... 35
Discussion ……… 36
Groove, familiarity, and BPM ……….………. 37
Synchronization task ……….……….……….…. 38
Beat perception task ………. 39
Linking perception to synchronization: impairments and possible dissociations ……….……….. 43
Conclusion ... 58
V
Liste des tableaux
Tableau I. Description des stimuli ………. 46
Tableau II. Jugement du groove et de la familiarité ……….. 47
Tableau III. Matrice de correlation entre groove, familiarité et BPM ……….. 48
Tableau IV. Spécifications du modèle pour la tâche de synchronisation ……….. 49
Tableau V. Spécifications du modèle pour la tâche de perception ……… 50
VI
Liste des figures
Figure 1. Illustration des conditions .……….………..…… 52 Figure 2. Distribution des performances à la tâche de perception ………... 53 Figure 3. Distribution des performances à la tâche de synchronisation ……. ……...…. 54 Figure 4. Distribution des performances à la tâche de synchronisation après
transformation ……….. 55 Figure 5. Nuage de points de la consistance de la synchronisation (RV) par la
VII
Liste des abréviations
M-BAT Montreal – Beat Alignment Test
ASAP Action simulation for auditory prediction
PMC Premotor cortex
SMA Supplementary motor area BAT Beat Alignment Test
H-BAT Harvard – Beat Alignment Test
BAASTA Battery for the Assessment of Auditory Sensorimotor and Timing Abilities BIT Beat interval test
BFIT Beat finding interval test
PD Parkinson disease
BPM Beat per minute
RV Resultant vector
SRSD Self-report synchronization deficit nSRSD Non self-report synchronization deficit FAR False-alarm rate
HR Hit rate
VIII
Remerciements
Je tiens tout d‟abord à remercier Isabelle Peretz, pour la foi qu‟elle a su porter en moi malgré mes tendances rêveuses et le support professionnel dont elle a fait preuve.
Un merci tout particulier à Benjamin Glenn Schultz pour l‟encadrement rigoureux et compréhensif dont il a fait part, et sans qui je n‟aurais pu accomplir un travail de cette qualité.
Merci à l‟ensemble du Laboratoire international de recherche sur le Cerveau, la Musique et le Son (BRAMS) pour l‟environnement de travail dynamique et aidant dans lequel il m‟a fait baigné.
1
Introduction
La perception de la pulsation
La pulsation, ou battement, réfère à une périodicité subjective et endogène extraite à partir des rythmes de la musique (Large, 2008). Comme les rythmes contenus dans une pièce musicale ne sont pas nécessairement périodiques, la pulsation qui en est extraire ne peut dès lors pas être considérée comme étant une propriété intrinsèque du stimulus (Epstein, 1995; Lerdahl & Jackendoff, 1983). La pulsation musicale est primordiale à la synchronisation d‟un ensemble d‟individus entre eux, permettant à ces derniers de s‟appuyer sur une stimulation endogène commune (Goebl & Palmer, 2009). Une étude menée par Grahn et Rowe (2009) rapporte une forte perception de la pulsation malgré l‟absence d‟accents rythmiques dans la stimulation, ce qui vient corroborer la définition de cette dernière proposant qu‟il s‟agisse d‟une représentation interne. Allant dans le même sens, Meyer et Cooper (1960) ont démontré que la sensation de pulsation persiste et demeure robuste même après que le stimulus l‟ayant généré soit terminé. Également, malgré le fait qu‟une pièce de musique puisse comporter de petites altérations au niveau de la pulsation, liées à l‟expressivité de l‟interprète (expressive timing), les individus sont tout de même capables de percevoir la pulsation correctement (Large & Palmer, 2002) ainsi que de se synchroniser avec celle-ci (Drake, Penel, & Bigand, 2000). De nombreuses théories ont été proposées pour expliquer le processus du traitement de l‟information lié à la perception de la pulsation dans un contexte musical.
La théorie du traitement dynamique de l‟attention (dynamic attending theory), amenée par Jones et Boltz (1989) propose deux types de traitements dynamiques et évoque la capacité à prédire le moment où une séquence va se terminer. Cette capacité de
2
prédiction serait rendue possible grâce aux régularités d‟occurrences physiques contenues dans certains types de stimulation tels la musique ou le langage. Le principe de cohérence est fondamental à la théorie introduite par Jones et Boltz (1989). Plus une séquence de stimulations est cohérente, plus il devient possible d‟extraire certaines régularités pouvant se situer à différents niveaux de la structure rythmique. Ces régularités peuvent être imbriquées les unes dans les autres à différents niveaux de complexité. La perception de ces régularités, qu‟elles proviennent d‟un ratio de nombre entier ou fractionnel, proviendrait d‟une attitude anticipatoire à l‟égard des événements à venir. Ainsi, le niveau de cohérence temporelle des stimulations déterminera le mode attentionnel qui sera utilisé en vue de pouvoir évaluer l‟écoulement du temps. Pour des stimulations avec un très faible niveau de cohérence, auxquelles nous pouvons nous référer en parlant de stimulations ayant une faible prédictibilité temporelle, le mode attentionnel utilisé sera analytique. Dans un mode de traitement analytique, chaque intervalle est comparé de manière absolue aux autres. Il devient alors plus difficile de faire une estimation temporelle adéquate. Dans un contexte musical, le mode attentionnel ou mode de traitement orienté vers le futur est celui qui sera priorisé. Pour ce mode de traitement, la forte cohérence temporelle des stimulations et donc la prédictibilité qui en découle permettrait une synchronisation des oscillateurs internes. Il se créerait alors une dynamique entre ces oscillateurs internes et ce que Large et Jones (1999) appellent une pulsation d‟énergie attentionnelle. Cette dynamique produira un rythme attentionnel permettant au cerveau de se synchroniser avec la stimulation en fonction de sa capacité d‟ajustement et de son pouvoir de prédiction.
3
Cette théorie du traitement dynamique du rythme est particulièrement utile dans le contexte musical et langagier. La notion de périodicité extraite à partir de la cohérence de la stimulation renvoi à la notion de pulsation sous-jacente à la perception du rythme. Ainsi, ce modèle semble pouvoir expliquer non seulement la nature de l‟appréciation temporelle liée au rythme, mais également l‟utilisation d‟une pulsation intrinsèque au rythme comme outil facilitant cette appréciation.
La théorie de la synchronisation neuronale amenée par Large et Snyder (2009) est en accord avec celle du traitement dynamique de l‟attention. Effectivement, selon ce modèle, les oscillateurs internes évoqués par Jones et Boltz (1989) seraient en fait les oscillations de populations de neurones. Les oscillations neuronales sont le produit de l‟interaction entre l‟excitation et l‟inhibition de populations de neurones et sont des indicateurs du traitement de l‟information. Il semble intuitif dans ce contexte que le rythme attentionnel suggéré par le précédent modèle et résultant du traitement de l‟information rythmique soit reflété par une oscillation neuronale correspondante.
Liens entre perception de la pulsation et synchronisation
Les deux modèles décrits ci-haut offrent une explication au phénomène de perception de la pulsation par un mode attentionnel orienté vers le futur et donc de nature prédictive (Large & Jones, 1999), ainsi que par la synchronisation des rythmes cérébraux avec ceux de la stimulation (Large & Snyder, 2009). Toutefois, il est nécessairement de pousser davantage l‟investigation afin d‟avoir les outils théoriques nécessaires à l‟explication des mécanismes en jeu dans la capacité que l‟être humain à a se synchroniser avec des stimulations rythmiques et plus particulièrement, avec la musique.
4
En effet, cette capacité à se synchroniser semble se faire naturellement et spontanément pour la plupart des individus (Drake, Jones & Baruch, 2000; Kirschner & Tomasello, 2009). Hannon et Trainor (2007) ont montré que les stimulations rythmiques peuvent induire le mouvement spontanément chez de très jeunes enfants. Également, il a été démontré qu‟une structure rythmique cohérente (basée sur la pulsation) améliore les capacités à se synchroniser avec la stimulation (Grahn & Watson, 2013).
Des théories comme celle des neurones miroirs, qui suggère un lien fondamental entre la perception et la représentation motrice liée à cette perception (Van Overwalle & Baetens, 2009), ou bien celle de l‟incarnation (embodiment theory), qui suggère une approche liée au corps et à la sensation comme moteur cognitif (Iyer, 2002), peuvent suggérer l‟existence d‟une lien profond entre la perception de la pulsation et la capacité de synchroniser ses mouvements avec cette dernière. Effectivement, pour de nombreuses cultures, la musique et le rituel ou la danse sont des concepts indissociables (Cross, 2001). Il serait possible de considérer la perception du rythme comme une représentation motrice des mouvements nécessaires à sa production.
Pour mieux comprendre le lien unissant la perception de la pulsation et la synchronisation avec cette-dernière, Patel et Iversen (2014) proposent la théorie de la simulation de l‟action pour la prédiction auditive (ASAP). Cette théorie intègre les récents travaux en neuroimagerie ayant montré une activation du cortex prémoteur (PMC) et des aires motrices supplémentaires (SMA) lors d‟une tâche de perception de la pulsation pendant laquelle le participant ne bougeait pas (Grahn & Brett, 2007). Il devient alors évident que le système moteur joue un rôle dans l‟induction d‟une sensation de pulsation dans un contexte musical. De plus, il a été démontré que l‟expérience musicale
5
module la connectivité entre le système auditif et certaines parties du système moteur comme le PMC et les SMA (Grahn & Rowe, 2009). ASAP propose que le système de planification motrice soit utilisé pour prédire l‟occurrence des pulsations via une simulation de mouvements périodiques.
Différences individuelles de la perception et de la synchronisation à la pulsation Différents portraits comportementaux émergent de la récente littérature ayant mesuré la perception et la synchronisation à la pulsation. Il est important de mentionner que les tâches utilisées dans ces études n‟étaient pas toujours les mêmes, rendant leur comparaison plus délicate. Phillips-Silver et al. (2011) ont rapporté le premier cas de « beat deafness », caractérisé par un déficit de la synchronisation à la pulsation associé à un trouble de la perception. Toutefois, la tâche de perception était de nature audio-visuelle, rendant impossiblement l‟identification du trouble perceptif comme étant purement lié à la sphère auditive. Sowinski et Dalla Bella (2013) rapportent un cas de déficit de la synchronisation à la pulsation accompagné d‟une perception de cette dernière préservée. Les auteurs expliquent ce déficit comme résultant d‟un mauvais « mapping » sensorimoteur, ou plus spécifiquement, audio-moteur. Cette dernière étude suggère une dissociation entre perception et production. Ce même modèle de dissociation est rapportée dans la littérature sur la perception de la hauteur, ou pitch (Bradshaw & McHenry, 2005; Dalla Bella, Giguère, & Peretz, 2007; Pfordresher & Brown, 2007; Hutchins & Peretz, 2011). Loui, Guenther, Mathys et Schlaug (2008) rapportent un cas où la capacité à produire certains intervalles de hauteur est préservée tandis que la perception de ces mêmes intervalles est déficiente. La présente étude cherche à étudier les
6
possibles dissociations entre perception et synchronisation à la pulsation dans un contexte musical.
La notion du groove
Avant de parler des différents tests comportementaux mesurant la perception de la pulsation et la synchronisation avec cette-dernière, il convient d‟introduire un autre concept permettant de lier la perception au mouvement. Le groove se définit comme étant un aspect plaisant de la musique engendrant un envie de bouger en synchronie avec celle-ci (Janata, Tomic, & Aberman, 2012). Ces mêmes auteurs ont démontré que plus un extrait de musique est jugé comme étant „‟groovy‟‟, plus le participant rapportera de la facilité à se synchroniser avec la structure métrique de l‟extrait présenté. Ces auteurs ont également démontré que des mesures quantifiables de la qualité de la synchronisation sensorimotrice sont positivement corrélées avec l‟expérience de groove rapportée. Ainsi, le concept de groove permet de différencier les stimulations auditives en ce qui a trait à la qualité du couplage sensorimoteur qu‟elles engendrent. La musique jugée plus „‟groovy‟‟ semble donc déclencher une plus grande activation du système moteur.
Tests mesurant la perception de la pulsation et la synchronisation avec cette dernière
Plusieurs tests ont été conçus afin de mesurer les différences individuelles quant aux habiletés à percevoir et à se synchroniser à la pulsation musicale. Un de ces tests est le Beat Alignment Test (BAT; Iversen & Patel, 2008). Le BAT est divisé en deux tâches: perception de la pulsation et synchronisation à la pulsation. Dans la première, le participant doit indiquer si un clic superposé à l‟extrait musical est aligné ou non avec la pulsation. Pour la tâche de synchronisation, le participant doit synchroniser les
7
mouvement de son doigt avec la pulsation de la musique. D‟autres tests ont été élaborés subséquemment au BAT, dont le Harvard Beat Alignment test (H-BAT; Fujii & Schlaug, 2013), le Battery for the Assessment of Auditory Sensorimotor and Timing Abilities (BAASTA; Farrugia et al., 2012) ainsi que le Goldsmiths Musical Sophistication Index (Müllensiefen et al., 2014).
Ces différents tests présentent diverses lacunes affectant leur validité ou rendant difficile la comparaison entre la perception et la synchronisation. Par exemple, le nombre de conditions où le clic est aligné avec la pulsation et celui où il est désaligné n‟est pas égal (Farrugia et al., 2012; Müllensiefen et al., 2014). Cette situation laisse place à un biais de réponse dans un contexte où le participant cherche à balancer ses réponses entre les conditions aligné et désaligné de la pulsation. Également, les stimuli utilisés pour les tâches de perception et de synchronisation ne sont pas les mêmes (Fujii & Schlaug, 2013) ou bien ne se rapportent qu‟à un genre musical précis (Müllensiefen et al., 2014). Ce projet de recherche vise ainsi à utiliser l‟ensemble des informations pertinentes relevées ci-haut afin de construire un test psychométrique, le Montreal - Beat Alignment Test (M-BAT), permettant de mesurer de manière sensible les capacités de la population générale à percevoir et à se synchroniser à la pulsation musicale. Également, cette étude cherche à mieux comprendre le lien existant entre le groove ressentit lors de l‟écoute musicale, la familiarité avec les extraits entendus et les capacités de perception et de synchronisation à la pulsation.
Objectifs et hypothèses
Le premier objectif de cette recherche est d‟utiliser le M-BAT afin de recueillir des données normatives chez la population générale quant aux capacité à percevoir et à se
8
synchroniser à la pulsation musicale. Ce faisant, il deviendra possible d‟établir la force du lien présent entre ces deux habiletés. Les données normatives dont nous disposerons permettront l‟identification d‟individus présentant un trouble avec l‟une ou l‟autre des habiletés mesurées. Par l‟élaboration de différents portraits diagnostics, nous pourrons en apprendre davantage sur d‟éventuelles dissociations entre perception et synchronisation.
Le deuxième objectif de cette étude consiste à mieux comprendre de quelle manière les concepts de groove et de familiarité permettent de prédire les performances aux tâches de la M-BAT.
Nous posons l‟hypothèse que les performances à la tâche de perception (d’) seront positivement corrélés à ceux de la tâche de synchronisation (mesure de consistance), comme rapporté par Iversen et Patel (2008). Également, nous posons l‟hypothèse que l‟expérience musicale sera positivement corrélée avec les performances à chacune des deux tâches, étant donné la meilleure capacité chez les experts à détecter un clic désaligné de la pulsation (Van der Steen, van Vugt, Keller, Altenmüller, 2014) ainsi qu‟à se synchroniser avec cette même pulsation (Repp, 2005)
Comme il a été démontré que le groove perçu influence positivement les capacités à se synchroniser à la pulsation musicale (Janata et al., 2012), et que la perception de la pulsation nécessite un engagement des aires prémotrices (Grahn et Rowe, 2008), nous prédisons une corrélation positive entre le groove et les performances aux deux tâches. La corrélation positive rapportée entre le groove et la familiarité (Janata et al. 2012) nous amène à faire les mêmes prédiction quant à la familiarité avec les extraits.
9
Article
10
Apports des différents co-auteur(e)s de l’article
Antoine Bellemare a contribué à la réflexion sur le cadre théorique, à la formulation des hypothèses, à la collecte des données, à l‟analyse et à l‟interprétation des résultats ainsi qu‟à la rédaction de l‟article scientifique et du mémoire de maîtrise.
Dr. Isabelle Peretz a contribué à la réflexion sur la cadre théorique, à la formulation des hypothèses, ainsi qu‟à la révision et l‟encadrement de l‟article scientifique.
Dr. Benjamin G. Schultz a programmé l‟ensemble de l‟expérimentation, à participer à l‟élaboration de la méthodologie, aux analyses statistiques ainsi qu‟à la révision de l‟article scientifique.
Pauline Tranchant (Msc), à participé en tant que consultante au niveau des analyses statistiques.
11
Measuring the abilities to perceive and synchronize to a musical beat with the Montreal – Beat Alignment Test (M-BAT)
Antoine Bellemare Pepin, B.Sc.1,2, Benjamin G. Schultz, Ph.D.1,3, Pauline Tranchant, M.Sc.1,2, Isabelle Peretz, Ph.D.1,2
1. International Laboratory for Brain, Music and Sound Research (BRAMS) 2. Department of Psychology, University of Montreal
3. Faculty of Psychology, Department of Neurocognition, Maastricht University
Corresponding author:
Antoine Bellemare Pepin, B.Sc Department of Psychology University of Montreal 2900 Blvd Édouard-Montpetit Montreal, Quebec Canada, H3T 1J4 Tel: 514-651-3200 Email: antoine.bellemare.pepin@umontreal.ca
12
Abstract
There are currently many tests to measure the abilities to perceive the beat in music and to synchronize its movements with it. These tests, however, have certain methodological shortcomings (long duration of administration, different stimuli between sub-tests, mismatch conditions). The Montreal-Beat Alignment Test (M-BAT) has been developed to overcome these deficiencies and provide a simple and sensitive measurement of these skills. A sensitivity study was conducted with 90 participants. For the task of perception, we see a distribution with a slight negative asymmetry and without the presence of floor or ceiling effect. The performances for the perception and synchronization tasks are moderately correlated, suggesting that a good perception of the pulse is usually accompanied by a good ability to synchronize with it. Also, case deficits in one and/or the other of these skills are reported, indicating the presence of dissociations between perception and synchronization with the musical beat.
13
Introduction
The ability to synchronize one‟s movements with music seems to be one of the universals of music (Drake & Bertrand, 2001), as it is found across different cultures (Nettl, 2000) and appears spontaneously at an early age (Drake, Jones & Baruch, 2000; Kirschner & Tomasello, 2009). Synchronization to music is reflected by the ability to entrain movements with simple regular beats, such as the ones produced by a metronome (Wing & Kristofferson, 1973; ten Hoopen et al., 1995; Friberg & Sundberg, 1995; Ehrle & Samson, 2005) and to extract the underlying beat from more complex rhythmic structures (Mirka & London, 2004).
Theoretical models of beat perception
The beat refers to a subjective and endogenous periodic pulse extracted from the rhythm of music (Large, 2008). Beats can be organized so that some of them are perceived as strong and others as weak (Lerdahl & Jackendoff, 1983). The hierarchical organization of beats that are assembled as a series of strong and weak beats is referred to as the metrical structure (Palmer & Krumhansl, 1990).
One theoretical account of the mechanism underlying beat perception is the dynamic
attending theory (Jones & Boltz, 1989; Large & Jones, 1999). According to the degree of
temporal coherence in a given stimulation, which refers to the structural predictability and the display of characteristic rhythmic patterns in a given stimulation, two modes of dynamic attending can be triggered. When the degree of coherence is low, meaning a low recurrence of predictable temporal patterns, the analytic dynamic attending mode is used. In this mode, temporal regularities are harder to perceive and each pattern is compared to the others to estimate their duration. Conversely, when a high level of temporal
14
coherence is found, meaning a high recurrence of predictable temporal patterns, regularities can be extracted and, therefore, permit the recruitment of a future-oriented attentional mode. In the context of a musical stimulation, temporal regularities inform beat locations and therefore facilitate beat perception. In the future-oriented mode, the predictable nature of the stimulation will lead to the synchronization of the perceiver‟s internal oscillators. These internal oscillators are conceptualized as variations of the intensity of the attentional resources, which lead to an attentional pulse (Large & Jones, 1999). In line with this theory, Large and Snyder (2009) proposed the neural resonance theory which suggests that the internal oscillators described in the dynamic attending theory are in fact populations of neurons that fire at certain rates. Accordingly, beat perception arises when those oscillatory rhythms synchronize to the external rhythmic stimulation. Empirical evidences support this theory by showing neural responses at the frequency of the beat when listening to pure tones isochronous rhythms (Nozaradan et al. 2011; 2012) and musical excerpts (Tierney & Kraus, 2014). The models described above offer a framework of how the brain perceives regularities in music but do not specify the processes involved in the ability to synchronize movements with it.
Linking beat perception to synchronization
Beat perception often leads to spontaneous synchronized movements such as tapping our feet or nodding our heads rhythmically (Hurley, Martens, & Janata, 2014). The activation of the supplementary motor area (SMA) and the premotor cortex (PMC) during beat perception (Grahn & Brett, 2007; Kung, Chen, Zatorre & Penhume, 2013) reflect this beat perception‟s property to trigger movement. In the same line of thought, Manning and Schutz (2013) showed that moving in synchrony with the beat makes it easier to
15
detect beat violations. Moreover, it has been demonstrated that moving at a particular metrical rate when listening to a rhythmic structure significantly enhance brain responses at the frequency of that metrical rate afterwards (Chemin, Mouraux, & Nozaradan., 2014). These findings suggest an intimate relation between beat perception and the motor system.
The Action Simulation for Auditory Prediction (ASAP) is an hypothesis brought by Patel and Iversen (2014) to account for this tight relation between beat perception and the motor system. These authors suggest that:
„‟ the motor planning system uses a simulation of body movement (specifically, of periodic movement patterns) to entrain its neural activity patterns to the beat period, and that these patterns are communicated from motor planning regions to auditory regions where they serve as a predictive signal for the timing of upcoming beats and shape the perceptual interpretation of rhythms „‟.
The authors suggest that neural periodicities involved in the motor planning system serve as a resource, or a template, for the auditory system to make accurate predictions of upcoming beats in music. To explain the assumed connection between beat perception and the motor system, the ASAP hypothesis provides one account that puts the motor system as the driving system of beat perception. Even if the dynamic attending theory (Jones & Boltz, 1989) is based on dynamical systems and the ASAP theory on forward and inverse models, both consider beat perception as a predictive process and integrate to their model the entrainment of neural activity with the beat period or (sub)harmonics of that period. In the present study, the relation between pure beat perception and
16
synchronization to the beat, which obviously engages the motor system, will be investigated by comparing performances on two tasks measuring these abilities.
A related concept that emphasizes the relation between beat perception and rhythmic movements is groove, as it has been demonstrated that high groove music elicits spontaneous rhythmic movements (Hurley et al., 2014) and facilitates finger tapping synchronization to music (Janata, Tomic, & Haberman , 2012). Groove has been referred to as a musical quality that makes one want to move with the rhythm or the beat (Iyer, 2002; Janata et al., 2012; Madison, 2006; Pressing, 2002; Waadeland, 2001). Groove ratings tend to be highly consistent between individuals and can be associated to many different musical styles (Janata et al., 2012). Beat saliency and event density are strong predictors of groove ratings (Madison, Gouyon, Ullén, & Hörnström., 2011). Beat saliency here refers to the degree of repetitive rhythmical patterning around comfortable movement rates. In other words, it represents the degree of self-similarity in the patterns of the magnitude of the signal. The other predictor of groove, event density, is defined as the local energy variability (Madison et al., 2011). In the same line of thought, Burger et al. (2012) found that clear pulses, or beats, and energy in low frequency bands are musical features that tend to encourage temporal regularity in movements. Thus, the level of groove of a song may influence the quality of the sensorimotor synchronization with the beat. In this study, we seek to better understand the relationship between the groove and the abilities to perceive and synchronize to the beat of music.
17 Individual variability in beat finding
Even though the large majority of individuals can extract the underlying beat from complex rhythmic structures (London, 2004), different cerebral activations of strong- versus weak-beat-perceivers (Grahn & McAuley, 2009) lead us to suspect fundamental individual differences. A growing body of studies (Phillips-Silver et al., 2011; Sowinski & Dalla Bella, 2013; Launey, Grube, & Stuart., 2014; ) report cases of individuals with significantly impaired beat perception and synchronization abilities. Mathieu is the first documented case of „‟beat deafness‟‟ in the literature (Phillips-Silver et al., 2011). Beat deafness refers to a beat perception disorder associated with poor synchronization with music in absence of a pitch processing deficit (Phillips-Silver et al., 2011). Launay et al. (2014) showed that the impairment in synchronizing to the beat was only present with a musical stimuli whereas it was absent with isochronous sequences of pure tones of a metronome. These results confirm that the deficit is not purely motor and is associated with a musical context. Another study reported different profiles of impairment, such as impaired synchronization with the beat of music without beat perception or motor deficits (Sowinski & Dalla Bella, 2013), interpreted as a sensorimotor coupling problem. This latter study suggests that dissociations between beat perception and production could occur. However, such dissociations have not yet been tested for. The present study investigates dissociations between the abilities to perceive the beat and to synchronize with it in a context of musical stimulation.
Interestingly, the literature on pitch processing (Bradshaw & McHenry, 2005; Dalla Bella, Giguère & Peretz, 2007; Pfordresher & Brown, 2007; Hutchins & Peretz, 2012) also reveals patterns of dissociations between perception and production.
Tone-18
deafness is a lifelong impairment in musical ability resulting from a deficit in fine-grain pitch perception (Hyde & Peretz, 2004). Loui, Guenther, Matthys & Schlaug (2008) reported cases of tone-deaf individuals that were able to reproduce pitch intervals in correct directions without being able to perceive those pitch directions consciously. The results support an auditory « dual-stream » hypothesis (Hickok & Poeppel, 2004; Griffiths, 2008) that suggests auditory information is processed in two distinct channels; one ventral stream that processes sound in a conscious fashion and one dorsal stream that connects the motor system with the auditory stimuli in an automatic fashion. In the case of pitch processing, the ventral stream may be involved in conscious identification of changes in pitch directions, and the dorsal stream in their production, as it is linked to the motor system.
When applying the dual stream hypothesis to the case of beat processing, one can conceive that beat perception must rely mostly on the dorsal pathway because it is intrinsically linked with the motor planning system (Grahn & Brett, 2007). However, tasks that implicate an explicit judgment of the beat locations may recruit the ventral pathway in order to bring the information to the explicit conscious level. Therefore, the ventral pathway may be implicated in explicit beat perception whereas the dorsal pathway in implicit beat perception and synchronization with the beat. Studies aiming at understanding impaired processes of beat perception and synchronization may provide insights for further studies on the neural correlates of these abilities. By finding cases of dissociations, it became possible to isolate brain processes related to implicit versus explicit beat perception. By finding a case of impaired beat perception with preserved
19
synchronization ability, it indicates that explicit beat perception is not a necessary condition for demonstrating synchronization ability.
Tests measuring beat perception and synchronization
Several tests have been designed to measure individual differences in beat perception and synchronization. One measure is the Beat Alignment Test (BAT; Iversen & Patel, 2008). The aim of the BAT was to acquire large-sample normative data, which has not been achieved yet; their sample was made of 30 individuals. It has been used and/or adapted in many studies (e.g., Grahn & Schuit, 2012; Fujii & Schlaug, 2013; Benoît et al., 2014; Van der Steen, van Vugt & Keller, 2014; Dalla Bella et al., 2015; Einarson & Trainor, 2015).
The BAT is divided in two tasks: beat perception and synchronization with the beat. In the former, one has to indicate if a click sequence superimposed on musical excerpts is either on or off of the beat. In the synchronization task, the participant has to synchronize finger taps with the beat of the same musical stimuli. In their pilot study, Iversen and Patel (2008) reported a significant but moderate correlation (r = .38, p < .05) between beat perception accuracy scores and correlations of tapping tempo with music tempo extracted from the synchronization task. These results does not support, neither show evidence against the dissociations described above.
One limitation of the traditional BAT is the unequal number of on-beat versus off-beat conditions in the perceptual task. The number of off-off-beat trials is generally higher than the number of on-beat trials (ratio of 2/1) and this could lead to a response bias. Some participants would possibly tend to balance their responses so that on-beat and
off-20
beat responses are equal. Moreover, the musical background of the participants was not included in the analyses of the original BAT test study. Musical experts tend to perform better at detecting clicks that are misaligned with the beat (van der Steen et al., 2014). Another aspect that could be improved is the way tapping data were acquired. The Arduino is a microcontroller that contains a processor that can receive analog inputs. Using Python scripts and C code, Arduino can be converted into a sensorimotor synchronization measurement tool. Arduino can record response latencies with less than 1ms variability (e.g., D‟Ausilio, 2012; Schubert, D‟Ausilio, & Canto, 2013). This technology is much more accurate in reducing the number of the miss or superfluous responses that could occur when tapping data is recorded using midi pads (Schultz & Van Vugt, 2015).The present study will use this technology in order to measure sensorimotor synchronization with more sensibility.
The Harvard Beat Assessment Test has also been developed to assess the capacity to perceive and synchronize with the beat (Fujii & Schlaug, 2013). However, this test does not measure perception and synchronization with the same musical stimuli. Musical excerpts were only used for the synchronization task. This makes it difficult to compare the task of perception with that of synchronization. Perception and production were compared in their Beat Interval Test (BIT) and Beat Finding and Interval Test (BFIT). The BIT aims at measuring the thresholds to perceive/produce a gradual tempo change whereas the BFIT is constructed similarly except that the beat had to be extract by the participant. Fujii and Schlaug (2013) found that the production thresholds were significantly lower than the perception threshold, suggesting that „‟the participants were able to adapt to the direction of temporal change by their tapping even at the level in
21
which they could not discriminate in the perception tasks‟‟. These findings are in line with the dual stream hypothesis (Hickok & Poeppel, 2004) and suggest that beat processing could be more efficient when recruiting the motor system then when only tapping on perceptual abilities. Therefore, it suggests a possible dissociation between processes involved in beat perception and synchronization to the beat. The present study aims at finding cases of dissociation between those abilities.
The Battery for the Assessment of Auditory Sensorimotor and Timing Abilities (BAASTA; Dalla Bella et al., 2016) is another measurement tool that includes a version of the BAT combined with other perception and synchronization tasks. This version of the BAT has a ratio of on-beat / off-beat conditions of 1: 2 and may be affected by same response bias as the original BAT. Another limitation is that the stimuli belong to the same musical genre, namely, classical music (i.e., Bach and Rossini). This may reduce the generalizability of the findings as not everyone is familiar with the classical genre. Moreover, musicians (98.1%) performed so high that 10 out of 15 obtained a score of 100%, indicating that the tasks were too easy. As Dalla Bella and colleagues were mostly interested in Parkinson Disease (PD) patients, the relationship between beat perception and synchronization was not examined.
Finally, the Goldsmiths Musical Sophistication Index (Müllensiefen et al., 2014) uses the same formula as the original BAT but keeps only the perceptual task. This version of the BAT has a ratio of on-beat / off-beat conditions of about 1: 3 and could be affected by the same bias as the original BAT. Also, this test has been used in our laboratory and the results showed performance at chance levels in two out of four off-beat conditions, suggesting that the task was too difficult for most participants.
22
We propose a new version of the BAT, the Montreal Beat Alignment Test (M-BAT). This test is intended to be simple, as it is constituted of only 2 subtests, which is less than other battery assessing beat perception and synchronization to the beat, such as the BAASTA (six subtests) and the H-BAT (four subtests). It is also designed to be naturalistic, as musical excerpts of different genres will constitute the stimuli. The mains objectives of that test are to (1) measure the ability to perceive the beat in music, (2) measure beat synchronization with precision, (3) properly discriminate individuals with possible impairments in one or both of these abilities, and (4) assess dissociation between perception and production deficits. Moreover, we will look at possible interactions between groove ratings and performances in both tasks.
We expect to find a positive correlation between performances in beat perception (d
prime scores) and synchronization (measure of consistency) tasks as it is known that beat
perception is associated with increased activation in the PMC and SMA (Grahn & Brett, 2007). We also hypothese that years of musical experience will predict performances on both tasks. To acquire normative values for the M-BAT, 90 participants will be tested. Building on previous studies on beat deafness (Phillips-Silver et al., 2011; Sowinski & Dalla Bella, 2013), we expect to find individuals that would be impaired in synchronization only, and others, in both beat perception and synchronization. The first type would correspond to a sensorimotor coupling deficit and the latter, to beat deafness. Furthermore, building on the dual-stream hypothesis, we find plausible the idea that individuals could be impaired in beat perception with preserved synchronization capacities, of which no case has yet been reported. Concerning Groove Ratings, we expect to find a positive correlation between groove ratings and synchronization
23
performance. Since the relation between groove and beat saliency has been demonstrated to be high (Stupacher, Hove & Janata, 2016), we hypothesize that beat perception will be correlated with groove ratings.
Method
ParticipantsNinety participants, mostly university students from University of Montreal (42 males, 48 females; age range, 18-55 years; M = 24.4, SD = 4.82) took part in the experiment and provided written informed consent (CERAS-2014-15-199-D). Their musical experience ranged from 0 to 15 years of formal training (M = 4.34 years, SD = 3.71). There were no professional musicians among the participants; the only participant with 15 years of musical training was 19 years old and just stopped practicing. The median years of musical training was two years. Sixty-five out of 90 participants had less than four years of formal training. Eighty-one out of 90 participants were French speakers. Fifty-six participants were French Canadian and 23 were from France.
Tasks and stimuli
Before testing with the M-BAT, participants had to judge the groove and familiarity of each musical selection. The M-BAT was divided into two tasks. The first one was a synchronization task in which the participant is asked to tap the perceived beat of the music. The second one is a beat perception task in which participants listen to a series of clicks superimposed onto musical excerpts and says whether the clicks on the beat or off the beat. The order of the synchronization and the perception task was not counterbalanced between participants because completing the perception task first could give some cues about where the beats are in the excerpts.
24
Ten musical excerpts from different genres (see Table 1) were used within the task. Five of them were used in a synchronization study used to identify poor synchronizers (Tranchant, Vuvan and Peretz, 2016), two others come from a study by Einarson & Trainor (2015), on beat perception of complex metrical structures, and three were chosen among the stimuli used by Janata, Tomic and Aberman (2012) in their experiment on groove. Unusual metrical structures were used in order to increase the difficulty of the task without reducing the phase and period shifts, which could have made the task too difficult for non-musicians (see van der Steen et al., 2014).
Eight out of ten stimuli had a simple metrical structure in 4/4 and the two others had a complex metrical structure in 5/4 and in 7/4. The number of beats per minute (BPM) was assessed via previous studies (Janata et al., 2012; Tranchant et al., 2016; Einarson & Trainor 2015) and varies from 82 to 170 for all the excerpts (Table 1).
Duration of the stimuli for the production task ranged from 23 to 31 seconds. The length of the stimuli was adjusted so that ten seconds at the beginning and five seconds at the end of each stimulus could be cut at the time of analyzing the data, leaving each excerpt 24 beats long. For the stimulus that was at a bpm of 170, the analyzed excerpt corresponds to a 36 beats period. Analyzed excerpts ranged from 9.5 seconds (BPM=152) to 17,6 seconds (BPM=82). Those extra seconds were provided to give the participant enough time to entrain and synchronize with the beat.
Duration of the stimuli used in the perception task ranged from 13 to 21 seconds in length and were identical to the excerpts in the tapping task with the final five seconds removed. Each excerpt was 24 beats long from the moment the first click is presented. A series of clicks (sinusoidal wave of 1000Hz with a Hanning envelope) were
25
superimposed on the musical excerpts. The click starts five seconds after the beginning of the stimulus to allow the participant to build a representation of the beat. A beat tracking algorithm implemented in Matlab (Ellis, 2007) was used to locate the beat times in the excerpts. Another Matlab script was used to superimpose the clicks on the excerpts. The clicks were superimposed according to different phase and period shifts (off-beat conditions) and with different levels of the metrical structure (on-beat conditions). For the on-beat conditions, clicks were added on each beat of the metrical structure (1, 2, 3, 4) or each two beats, either starting on the first (1, 3) or the second (2, 4) beat (Figure 1). The first beat was determined by the metrical structure of the stimuli in a 4/4 meter, a beat is perceived as accentuated every four beats. The strong beat was considered as the first one. In complex metrical structures, the same principle is applicable. In the present study, we had a stimulus with a 7/4 metrical structure (“Peter Gabriel –Solsbury Hill”) and another one with a 5/4 metrical structure (“Dave Brubeck - Take Five”). For the 7/4 metrical structure, we used the same pattern as for the on-beat conditions. We therefore added clicks on each beat (1, 2, 3, 4, 5, 6, 7) or each two beats, either starting on the first (1, 3, 5, 7) or the second (2, 4, 6). Considering that we use an odd number structure, it is worth noting that after one measure of seven beats, the click that started on the first beat now starts on the second one and vice versa. For the song with a 5/4 metrical structure, we proceeded differently because the tempo was faster (BPM=169). Therefore, we added a click on each beat (1, 2, 3, 4, 5) in one condition, on the first or the fourth beat of each measure in two other conditions. Creating more than one on-beat condition allowed us to equate the ratio of on-beat and off-beat conditions without presenting the same condition more than twice.
26
For the off-beat conditions, the click superimposed on the excerpts was either phase-shifted or period–shifted from the click-track of the recommended BPM. The phase shift was a constant shift of +/- 15% the inter-beat interval before or after the beat onset time. The period shift changed the inter-beat beat interval by +/- 5% (see Figure 1). These values were selected on the basis of van der Steen et al. (2014) that used a phase shift of +/- 15% to assess timing perception in musicians and several pilot studies that aimed for a mean accuracy score of 75%, midway between chance (50%) and perfect performance (100%).
2.3. Experimental Procedure
Testing sessions were divided into three tasks: a groove and familiarity rating task, the beat synchronization (production task), and the beat alignment test (beat perception task).
For the groove and familiarity judgment task, participants were told to continuously rate the “groove” of the excerpt. Groove was defined as the aspects of the music that you find pleasurable and make you want to move or dance (Janata et al., 2012). The judgment was made with an analog slider connected to an Arduino using the scripts from Schultz and van Vugt (2015). Participants were asked to use the full range of the scale over the course of the experiment. At the beginning of each trial, participants were asked to move the slider to the center and the experiment would not continue until this occurred. Participants were presented two repetitions of the 10 stimuli in two blocks with each stimulus occurring once in each block in a pseudo-random order. After each rating trial, participants rated the familiarity of the excerpt on a six-point Likert scale. The sentence « I am familiar with this song » was presented on the screen and the
27
indicators « Strongly disagree » and « Strongly agree » were respectively at the left and the right of the screen.
The groove and familiarity judgments were acquired at the beginning of the session, as it was important not to expose the participants to musical excerpts before they judge the familiarity. This task was followed by the synchronization task and by the beat perception task. Finally, the participant completed a questionnaire about musical background, sense of rhythm, socio-demographic characteristics and health condition.
In the beat synchronization task, participants were told to tap in synchrony with the music‟s beat with the index finger of the right hand. A clock analogy was used to describe the beat of music and how it differs from rhythm: “ Imagine the beat as represented by the tick-tock of a clock and tap both on the tick and on the tock ”. A familiarization period precedes the task and consisted of four excerpts different from those used in the experiment trials. After each familiarization trial, participants heard the same excerpt with a sequence of clicks added on the beat so that s/he understood the concept of beat. After the familiarization was completed, two repetitions of the 10 trials were completed in separate blocks, with each stimulus presented once in each block in a pseudo-randomized order, for a total of 20 trials.
In the beat perception task, participants were asked to determine if the clicks were aligned with the beat of the music. In a four-alternative forced-choice task participants could respond: always on the beat (1), mostly on the beat (2), sometimes on the beat (3) and rarely or never on the beat (4). For the analysis, we considered the two first choices as being an „‟on beat‟‟ response and the last two as being an „‟off beat‟‟ response. Participants were instructed not to move to the music to reduce the influence of
28
motor processes (e.g., body movements) on responses that should primarily reflect perception. A familiarization period preceded experiment trials in which participants received 2 on-beat trials, 2 phase shifts, and 2 period shifts. This period was composed of six trials of different stimuli than those in experimental trials. Accuracy feedback was given after each trial to ensure that the participant understood the task. Thereafter, each of the ten excerpts were presented eight times, four times with misaligned clicks (a +15% phase shift, a -15% phase shift, a +5% period shift, and a -5% period shift) and four times with aligned clicks (twice on each beat and once for each of the two alternating beat arrangements), for a total of 80 trials. The order of presentation of the stimuli was pseudo-random so that no song was presented twice consecutively. There were three breaks of at least five seconds during the task and participants were given the opportunity to take a longer break to reduce fatigue.
2.4. Equipment
Participants perform the tasks in a soundproof studio and stimuli were presented via Beyer Dynamic Headphones (Model DT 990 Professional). The experiment scripts were run on a PC computer (Intel core i7, running Windows 7), using a custom Matlab script (Mathworks, 2013b) and Python scripts from Schultz and van Vugt (2015). The sound card was an RME Fireface 800. Groove ratings were recorded using a slide potentiometer connected to an Arduino. The data from the synchronization task were collected with a force sensitive resistor pad connected to an Arduino. The sensor was placed at the right of the keyboard, at a comfortable height for the participant.
29
Results
All statistical analyses were performed with IBM SPSS 21 (IBM Corps, 2012).
Four participants were removed from the perceptual task analyses because their performances indicate that they did not understand the instructions properly; their scores fell significantly below the chance level. Six additional participants were removed from synchronization task analyses, due to technical problems during acquisition. Finally, 24 participants were removed from the analysis of groove and familiarity ratings due to technical problems during the acquisition. In those 24 participants, three were from the initial removed participants (2 in perception and 1 in synchronization) Therefore, we have 86 participants left for the perception task analysis (64 when groove and familiarity is included), 80 participants for the synchronization task (59 when groove and familiarity is included).
Groove, familiarity and BPM
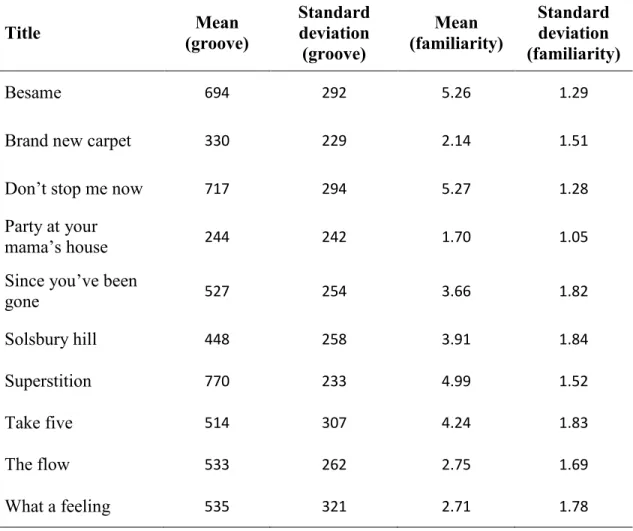
Each participant rated the groove and familiarity twice for each song before the administration of the M-BAT. The mean of these two measures was used for the analysis. Mean Groove Ratings for each song ranged from 244 to 770 on a scale from 0 to 1023 (i.e., 10-bit integers recorded by the Arduino‟s analog-digital converter). A One-way ANOVA was conducted to compare the effect of song on the Groove Ratings. An analyse of variance showed that the effect of song on Groove Ratings was significant, F (9, 639) = 27, 60, p < .001. A post-hoc Tukey test showed that each song‟s groove rating was significantly different from 4 to 8 other songs (p < .05). These results indicate that some stimuli were clearly rated as groovier than others (Table 2).
30
The mean Familiarity Ratings were also variable, ranging from 1.70 to 5.26 on a 6-point Likert scale A One-way ANOVA was conducted to compare the effect of song on the Familiarity Ratings. Results showed that the effect of song on Familiarity Ratings was significant, F (9, 639) = 48,34, p < .001. A post-hoc Tukey test showed that each song‟s familiarity rating was significantly different from 6 to 8 other songs (p < .05). These results indicate that some stimuli were clearly rated as more familiar than others (Table 2).
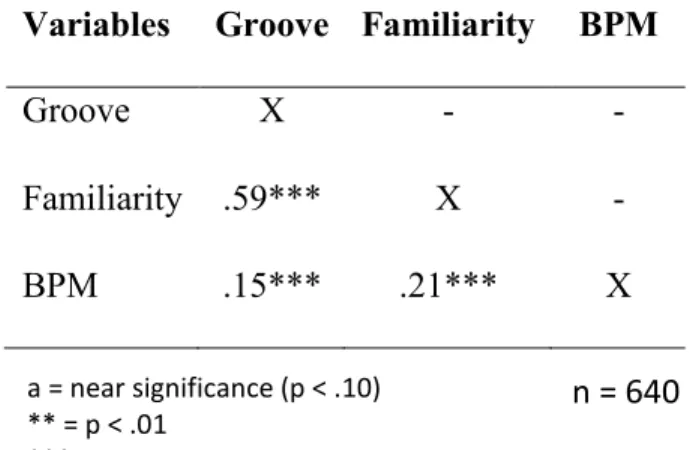
A strong significant positive correlation (r(638) = .59, p < .001) between groove and Familiarity Ratings was found, indicating that the more familiar a song is rated, the higher the groove rating. Positive significant correlations were also found between BPM and both familiarity (r(638) = .21, p < .001) and groove (r(638) = .15, p < .001) (see Table 3).
Synchronization task
Circular statistics analyses were conducted using the Circular Statistics Toolbox for MatLab to assess synchronization consistency (Fisher, 1995; Berens, 2009). The phase values of tap times relative to the beat onsets were converted to radians and represented by points on the unit circle (Formula 2).
(Formula 2) Radt
= ((Bt – Tt)/(Bt+1 – Bt)) x 2π t = time, B = beat onset, and T = tap onset
For each trial, the length of the resultant vector (RV) is the strength of the phase relationship between taps times and beat times within a trial. The values of RV ranged from 0 to 1 and represent the tapping consistency. Values close to 0 mean that the
31
distribution of the taps within a trial was uniformly distributed around the circle. Conversely, values close to 1 indicate that all the taps within a trial were represented at the same position in the circle.
For the synchronization task, we first looked at the distribution of RV for all participants and found it was negatively skewed (Skewness = -1.384) (see Figure 3). This indicates that a large part of our sample had a good matching between their tapping tempi and the songs‟ tempi. A Shapiro-Wilk test indicates that the variable was not normally distributed (p < .001). We performed a natural logarithm transformation on each RV to fulfill the assumption of normality (Skewness = -.77) (see Figure 4).
(Formula 3) ln(1-RV)
The relation between RVlog and musical experience was investigated. The distribution of the musical experience was positively skewed at 1.01 (SE = .26). This value was acceptable according to a recommended cut-off value of twice the standard error (SPSS, 2006). A simple linear regression was calculated to predict RVlog based on years of musical training. A significant regression equation was found (F(1,79) = 3.80, p = .05), with an R2 of .05.
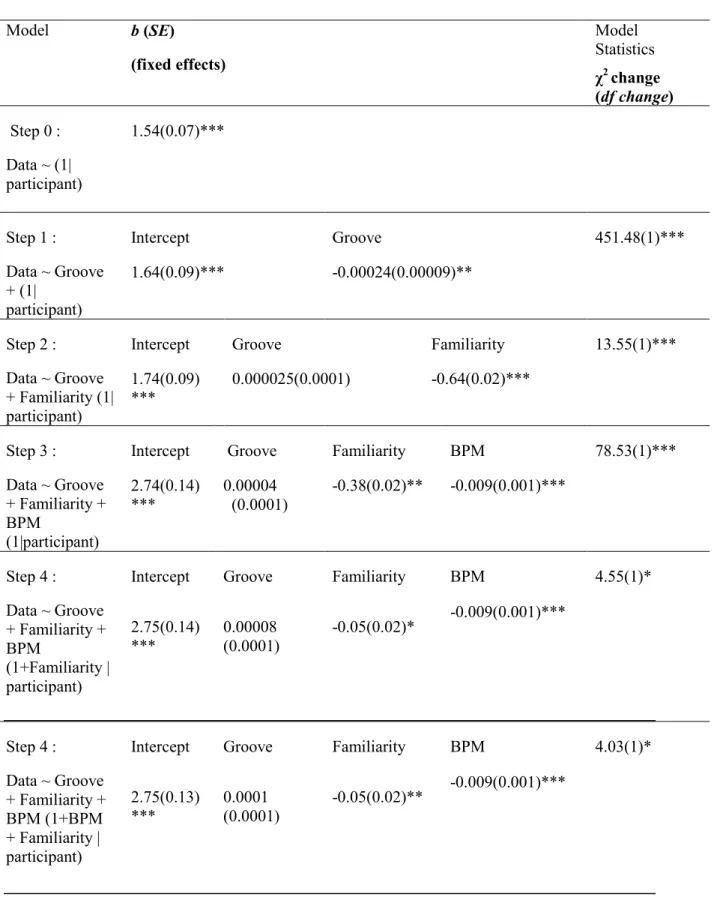
A two-level hierarchical linear regression was conducted to assess the impact of Groove Ratings and Familiarity Ratings on RVlog. These variables were modeled as predictors, and all data were nested within participant. The first level represented the variables measured at the song‟s level (i.e., Groove, Familiarity, BPM, d’, RV) whereas the second level represented the variables measures at the participant‟s level (Mean RV, Mean d’). We chose this type of mixed effect model instead of simple multiple regressions because if we did so, the variance caused by the participant would not have
32
been taken into account. Familiarity was added to the model since it is correlated with Groove Ratings. We tested a series of increasingly elaborated models (as recommended by Field, 2009), in which a random intercept was modelled for each participant. Both fixed and random slopes were tested for the main effects of Groove Ratings and Familiarity Ratings. The final, best-fitting model included a random intercept for participants and fixed effects of Groove Ratings and Familiarity Ratings. All analysis steps leading to the final model and its specifications are provided in Table 4. According to the fixed effects, RVlog was predicted significantly by the main effects of Groove Ratings (β = .0002, SE = .0001, p = 05) and Familiarity Ratings (β = -.04, SE = .02, p = .05)
Lastly, two groups were segregated from their response at the question: Do you
have some difficulties moving your feet or your hands in synchrony with the beat of the music? Twenty-one out of 86 participants reported synchronization problem. A One-way
ANCOVA was conducted to determine a statistically significant difference between
self-report synchronization deficit group (SRSD) and no self-self-report synchronization deficit
group (nSRSD) on their RV scores controlling for musical experience. The mean RV score for the SRSD group is 0.60 whereas it is 0.81 for the nSRSD group. There is a significant effect of self-report deficit type on RV scores after controlling for musical experience, F(1, 79) = 17,58, p < .001. Therefore, participants who reported a synchronization deficit showed poorer performances in the synchronization task.
Beat perception task
A measure of sensitivity, d’, was used as the dependent variable. The use of d’ permits to take into account the individual‟s response bias as well as their discrimination
33
ability (Corwin, 1994). This measure is calculated by subtracting the Z score of the False Alarm Rate (FAR) to the Z score of the Hit Rate (HR) (Formula 1).
(Formula 1): d’ = Z(HR) – Z(FAR)
A response was considered a hit when the participant judged correctly an off-beat trial as being off-beat. A response was considered a false alarm when a participant incorrectly judged an on-beat trial as being off-beat. A d’ that is a negative value means that FAR was higher than HR for a given participant.
One major aim of the present study was to assess whether the M-BAT provides a sensitive measure of beat perception. We first looked at the performance distribution of the 86 participants (Figure 2). The average d’ among participants was 2.38 with a standard deviation of 1.14 and a median at 2.55. The distribution was slightly negatively skewed at -.51 and its median is at 2.55. The skewness of the distribution indicates that a major part of the sample achieved a very good performance. The distribution showed a good range (min = -.14; max = 4.48) and a relatively normal distribution that does not reflect floor/ceiling effects. Even if performances were high, only one participant had a perfect score on the beat perception task.
The relationship between beat perception performances and musical experience was investigated. A simple linear regression was calculated to predict d’ based on years of musical training. A significant regression equation was found (F(1,85) = 7.73, p = .007), with an R2 of .08.
Another aim of this study was to investigate the relationship between groove and beat perception. To do so, Groove Ratings, Familiarity Ratings, and BPM were modeled as predictors of d’ in a two-level hierarchical linear regression with all data nested within
34
participants. We added familiarity to the model because of the strong correlation it presents with Groove Ratings (r(638) = .59, p < .001). BPM was also added to the model because part of the explained variance of d’ could be due to BPM differences between songs. Considering that clicks in the off-phase conditions were calculated in percentages, higher BPM leads to shorter dephasing time, which might, in turn, leads to greater difficulty in identifying the clicks as being off-beat. BPM looked like a normal distribution (Skewness = 0.41) with a mean of 121.8 and a standard deviation of 24.7. Both fixed and random slopes were tested for the main effects of Groove Ratings, Familiarity Ratings, and BPM. The final, best-fitting model included a random intercept for participants, fixed effects of Groove Ratings, Familiarity Ratings and BPM, as well as random slopes for Familiarity Ratings and BPM. All analysis steps leading to the final model and its specifications are provided in Table 5. According to the fixed effects, d’ was not significantly predicted by Groove Ratings (β= .0001, SE = .0001, p = .35) but was significantly predicted by the Familiarity Ratings (β = -.05, SE = .02, p = .01) and BPM (β = -.009, SE = .001, p < .001). The significant random slopes for Familiarity Ratings and BPM indicate that the predictive power of those variables on d’ scores varies among participants.
We afterwards used the same model but changed the predicted variable. Instead of using d’, on-beat conditions and off-beat conditions accuracy scores were used separately as the predicted variables. It was found that on-beat conditions accuracy was significantly predicted by Familiarity Ratings (β = -.02, SE = .005, p < .001), Groove Ratings (β = .00009, SE = .00003, p = .01), and BPM (β = -.003, SE = .0004, p < .001). The
35
subsequent model showed that off-beat conditions accuracy was only significantly predicted by BPM (β = -.001, SE = .0005, p = .02).
A One-way ANCOVA was conducted to assess statistical difference between
SRSD group and nSRSD group on d’, controlling for musical experience. Mean d’ for
SRSD group is 1.60 whereas it is 2.64 for nSRSD group. There is a significant effect of self-report deficit type on d’ after controlling for musical experience, F(1, 85) = 8,53, p = .005. Therefore, participants who reported a synchronization deficit showed poorer performances in the beat perception task.
Relationships between perception and synchronization: impairments and possible dissociations
Relationships between performance in the perceptual and synchronization tasks were compared to see if beat perception correlates with synchronization performance. Furthermore, cases of impairments in one or both of these abilities have been investigated, enabling the identification of possible dissociations.
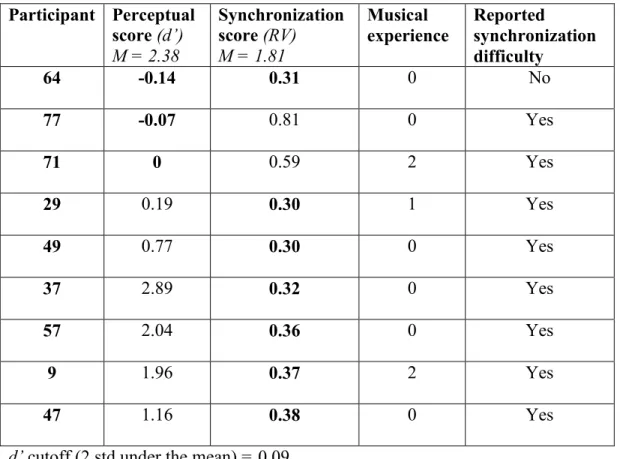
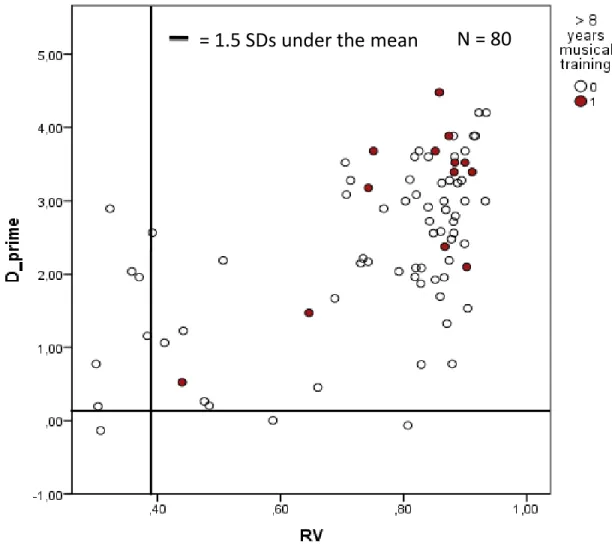
A significant positive correlation (r(78) = .58, p < 0.001) was found between d’ and RVlog (see Figure 5), confirming the hypothesis suggesting that beat perception correlates with the ability to synchronize with the beat. When looking at part correlations in order to control for musical experience, we found that the correlation stayed significant (r(78) = .53, p< .001).
Considering the distribution of the performances in the perceptual and synchronization tasks described earlier, we investigated poor performances to identify possible impairments regarding those abilities. We set a cutoff score at 2 standard