HAL Id: tel-01126965
https://pastel.archives-ouvertes.fr/tel-01126965
Submitted on 6 Mar 2015
HAL is a multi-disciplinary open access
archive for the deposit and dissemination of sci-entific research documents, whether they are pub-lished or not. The documents may come from
L’archive ouverte pluridisciplinaire HAL, est destinée au dépôt et à la diffusion de documents scientifiques de niveau recherche, publiés ou non, émanant des établissements d’enseignement et de
Essays in Empirical Corporate Finance
Adrien Matray
To cite this version:
Adrien Matray. Essays in Empirical Corporate Finance. Business administration. HEC, 2014. En-glish. �NNT : 2014EHEC0010�. �tel-01126965�
ECOLE DES HAUTES ETUDES COMMERCIALES DE PARIS
Ecole Doctorale « Sciences du Management/GODI » - ED 533
Gestion Organisation Décision Information
« Essays in Empirical Corporate Finance »
THESE
présentée et soutenue publiquement le 3 octobre 2014 en vue de l’obtention du
DOCTORAT EN SCIENCES DE GESTION
Par
Adrien MATRAY
JURY
Directeur de Recherche : Monsieur David THESMARProfesseur , HDR HEC Paris – France
Rapporteurs : Monsieur Daniel PARAVISINI Professeur Associé
London School of Economics and Political Science– Royaume-Uni Monsieur Amit SERU
Professeur
University of Chicago, Booth School of Business – Etats-Unis
Suffragant : Monsieur Ulrich HEGE Professeur
HEC Paris – France
Ecole des Hautes Etudes Commerciales
Le Groupe HEC Paris n’entend donner aucune approbation ni improbation aux opinions émises dans les thèses ; ces opinions doivent être considérées
Essays on Empirical Corporate
Finance
Ph.D. dissertation submitted by:
Adrien Matray
Committee Members:Advisors: Ulrich Hege,
David Thesmar, Research Director
External Members:
Daniel Paravisini (London School of Economics) Amit Seru (University of Chicago, Booth School of Business)
Acknowledgements
“You can’t just turn on creativity like a faucet. You have to be in the right mood. - What mood is that?
- Last-minute panic..” (Calvin and Hobbes, by Bill Watterson)
This thesis is the result of a long process. If doing a PhD is often perceived as a very lonely journey, I had the chance to have always been surrounded by incredible persons who all made this work possible. The first pages of this thesis are here to thank them all.
First I would like to thank the members of my committee. I’m forever indebted to David Thesmar, my supervisor at HEC for his guidance and advice. David has proved to be a wonderful supervisor during those five years. Especially at the beginning, starting his own research works can be overwhelming and it is invaluable to be able to quickly test his ideas with his supervisor and trust his judgment. David has always available to discuss ideas, provide feedbacks and kindly reorient my work when it was needed. Most importantly, his incredibly broad knowledge of the literature in economics and finance and his general curiosity always pushed me to explore very different topics, as long as they were interesting and about relevant questions. I will keep in mind his most dreaded question among PhD students “Why should we care? Why not working on unemployment in Europe?” as well as some more obscure comments “you don’t have enough moustache to run this regression” in my future career.
I’m indebted to Ulrich Hege, for his constant encouragements and attentive guidance and for having always very patiently listened to me when I had doubts. The completion of my PhD would have been much more painful without his extraordinary support. Ulrich always pushed me to think about the “big picture” and my discussions helped me raise the ambition of my papers every time we met.
I’m thankful to Daniel Paravisini, who provided me with a warm and challenging en-vironment at LSE. Thanks to him, my visiting in London has been extremely rewarding.
Daniel was always available to discuss about very various ideas and looked my work with a benevolent eye. He also confirmed me that you can aim for doing careful empirical works without sacrificing the importance and relevance of the question first.
Finally, I would also like to express my gratitude to the last member of my committee: Amit Seru, a researcher that I have followed with interest since the beginning of my PhD and who kindly accepted to fly across the Atlantic to attend my defense.
We know well in finance that time is money. And doing a PhD takes time. I thank the HEC Foundation for funding my scholarship and the LSE for providing me with an office during my visiting. Thanks also to all the persons behind those institutions who made sure I was properly covered by the social insurance, got pay on time, or helped me domesticating the Notilus system or planing the organisation of my PhD defense: Car-oline Meriaux, Melanie Romil, Francoise Dauvergne, Celine Rimbault. Frankie Clarke made sure I was not homeless and without computer when I visited the LSE. Thanks to all of you for allowing me to spend most time doing research and teaching while having everything around that works smoothly.
Next, I would like to warmly thank all my co-authors. I have been blessed to work with incredible persons, who always found the patience to support me and without whom the researches made during this PhD could not exist. In addition to being wonderful per-sons, Johan Hombert, Olivier Dessaint, Claire Celerier and Elizabeth Beasley are amazing researchers, both at the same time extremely creative and very careful and rigorous. I cannot stress enough how much I have learnt by working with them and I do hope to pursue this fruitful collaboration!
I have a special thought for Johan Hombert, who in addition of being the co-author any researcher can dream of, kindly drove me to HEC nearly every week (because yes, you can have a PhD and not a driving licence...). While it made me wake up at 5.30 in the morning, the discussions we had during the drives were largely worth it and will be deeply missed.
The need to find a car to go HEC is due to a small drawback of this institution, it is far away from Paris. But apart from that, the finance department provided me with the best environment possible to do a PhD. PhD students are immediately considered as researchers per se and encouraged to pursue their own ideas, while professors are very easily accessible. I am grateful to all for their generous feedbacks on my work with a
spe-cial thanks to Francois Derrien, Thierry Foucault and Phillip Valta, as well as Laurent Fresard who sadly for the department, decided to leave the American dream in Maryland two years ago but kept provided me with encouragement and feedback from across the Atlantic.
I have been lucky enough to meet outside HEC many professors who all took time to provide feedbacks, challenging discussions, or exposed me to new and motivating ideas. Thomas Piketty has been a wonderful supervisor while I was doing my master at Paris School of Economics, Elise Huilery, Jerome Pouyet, Eric Maurin, Milo Bianchi and Lau-rent Bach all provided very valuable feedbacks there and contributed in some way or another to my decision to do a PhD. Augustin Landier allowed me to visit Toulouse School of Economics where I could discuss with him, Bruno Biais, Sebastien Pouget and Thomas Chaney. Vicente Cunat, Juanita Gonzalez, Luis Guaricano at LSE (in addition to Daniel Paravisini) and Rui Silva at LBS made my visiting in London as friendly, useful and interesting as it could be. I would like to have a special thank for the well seasoned researchers who take the time to organize summer schools or workshops that provide such a great experience to PhD students. Thanks to Thomas Hellman who organised the NBER entrepreneurship summer camp, to Dimitri Vayanos (summer school on Dysfunc-tional Finance), to Nick Barberis (summer school on behavioral finance) and to Denis Gromb (the “Denis Gromb workshop” at INSEAD). Finally, I would like to thanks all the professors with whom I had the chance to interact with and discussed about my papers: Antoinette Schoar, Andrei Shleifer, Xavier Gabaix, Martin Brown, Robert Seamans, Ger-aldo Cerqueiro to name a few. Thanks to all of you for showing me that academia can be a fun, generous and stimulating place to be!
The finance department at HEC contained one additional treasure (in addition to its wonderful professors): the fellow PhD students with whom I spent four years: Jean Noel Barrot, Jerome Dugast, Hedi Benamar, Boris Vallee, Alina Rosu, Michael Spira, Charles Boissel. Your good mood, support, discussions will be missed. The atmosphere of collaboration, exchange, mutual assistance and (yes sometimes) friendly competition helped me grow as a researcher and I’m looking forward to seeing you again in various seminars and conferences around the world. I have a special thought for Michael Spira and Charles Boissel. Michael, I’m sorry we tried so many projects which unfortunately failed and I hope that your decision to go back to the private sector has nothing to do with that and that you will come back soon to academia! Charles, I’m sure that one project will eventually work and that we have many papers ahead of us.
In addition to my friends in the finance department at HEC, I had the chance to enjoy the companionship of other fellow PhD students, whose friendliness and support have been crucial and they deserve my deepest acknowledgment. In no particular order I thank: Thomas Roulet and Samuel Touboul, who showed me that strategy can be interesting. Thomas Bourveau, who did the same with accounting. Mattia Girotti for welcoming me during my visiting in Toulouse. Una Savic, Jesus Gorrin and Pat Akey who shared my aversion for noisy pubs and crappy beers and my taste for French red wine, making my year in London an extremely fun and pleasant experience. Giorgia Barboni who read carefully several times the paper on unbanked households and offered me to go work with her in Brussel on a promising dataset. I also thank Romain Lafarguette, Francois Geerolf, John Kuong, Alberto Teguia, Ryan Lewis, Patrick Kiefer for all the fun I had at Sciences Po and in conferences around the globe. Thank you all for the stimulating discussions, the less stimulating ones, the (way too) numerous drinks we got together and for all the fun we had during those years. There are sadly only 24 hours in a day, but I still hope to find the time to write papers with all of you!
Because there is also a life outside academia (contrary to what some people would like to make us believe), I thank all my friends who were wise enough to stay away from the academic path and without whom I would certainly not have been able to complete this journey. Thanks for being patient enough to keep asking questions about what exactly I’m doing research on (without asking when I will be graduating), and being (seem-ing?) genuinely interested about the answers. Thanks for the support during troubling times, the joy, the encouragements, the time shared around a good dinner. Thanks for all the stimulated discussions that always allowed me to make sure my work stays in touch with reality or gave me motivations or surprising questions. I sincerely thanks all of you. Those from schools, classe prepa or business school: Benjamin Candoti-Besson, Raphael Moran, Julien Pauchon, Amelie Vautravers, Aurelie Dossier, Nicolas Antraigue, Nicolas Debeuf, Bertrand Girard, Karen Leighton, Olivier Raimbault, Antoine Le-Fevre I can finally tell you that I’m officially done being a student! It took me a few extra years, but my collection of diploma (a priori) ends now. Those with whom I had the pleasure to share some amazing adventures such as creating a review (still edited!) and multiple think tanks that brought me so much and helped me growing: Axel Adida, Fran-cois Andelkovic, Sonia Baudry, Laurent Bach, Gaell Mainguy, Laure Marie Neuburger, Gregoire Postel-Vinay, Jean Marc Schlenker, Francois Taddei, Vincent Schachter, Anne Lise Sibony, Cosimo Winkler. And all the others I had the privilege to meet along the way: David Colle, Stephane Distinguin, Laurent Eymard, Marion Meissonnier, Lucas Pernollet, Pierre Yves Platini, Corentin Sannier, Constance Valdelievre. I will never
been able to express all my gratitude and how much this thesis owns you. Thanks to all of you and the other I’m necessarily forgetting but hopefully will recognize themselves.
Finally, I would like to thank my parents and little brother for their unconditional love along all these years. There is without any doubt a job harder than doing a PhD, it is to be the parents of a PhD student. Mum, dad, you have been incredible in the accomplishment of this (daunting) task. Thank you for all the help, support and assis-tance you gave me. Thanks for the discussions and questions about my work and why it could be important. Thanks for your patience when I was discoursing on “endogeneity issues” or “selection bias” during family lunch. Those conversations have been among the most important to clarify what I was doing and making sure I was not completely drifting off the tracks. You, who gave me the desire to explore and understand (a bit better) the world, and who transmitted me your curiosity, your love for knowledge and your care about the public good, this thesis is entirely dedicated to you and would not exist without you.
Introduction
Confidence is what you have before you understand the problem. (Woody Allen)
This thesis is structured around three different topics: banking market, innovation and behavioral finance.
Lending Relationships, innovative firms and the allocation of talents
One of the first questions I have been interested in understands the real effects of banking market structure and banking regulation. This leads me to investigate two dif-ferent issues. In the first one, I study with Johan Hombert in the first chapter entitled The Real Effects of Lending Relationships: Evidence from Innovative Firms and Inven-tor Mobility, what type of banking market structure is more likely to foster innovation and innovative entrepreneurship. Our intuition was that relationship lending, because it allows lenders and borrowers to acquire subjective and abstract (“soft”) information through ongoing personal interaction with borrowers, can foster innovation. By exploit-ing bankexploit-ing deregulation that happened in the 70s and 80s, we can generate a negative shock to relationships. We show that it reduces the number of innovative firms, especially those that depend more on relationship lending such as small, young, and opaque firms.
Because skilled labor is likely to be mobile, we then study how this negative shock on credit supply for innovative firms affects the allocation of talent within the economy. We find that this credit supply shock leads to reallocation of inventors whereby young and promising inventors leave small firms and move out of geographical areas where lending relationships are hurt.
We also believe that our results provide some policies implication. For instance, if one accepts that the lesson drawn from commercial banking extends to public funding, then governments willing to support innovation by allocating public funds should not
rely on a centralized and hierarchical structure, but on local agencies that more able to deal with soft information. It also suggests that governments should pay attention to financial markets in order to attract skilled human capital and to win the “global race for inventors’ brains” (Fink, Miguelez, and Raffo 2013). Having a well-functioning local credit market should therefore be in the tool-box of placed based policies design to attract talents (Moretti, 2011).
The reason we find this negative effect of banking deregulation on innovation is be-cause it affects lending relationships. I then became curious to see if another category of the population which is also strongly dependent on soft information could also be harmed by an increase in competition on the banking market: poor and minorities.
Why poor households are unbanked?
Between 35 to 45% of low income households in the US are unbanked, i.e. possess neither a checking nor a saving accounts. This extremely high figure motivated Claire Celerier and I to try to understand what could be the driver behind that and especially if bank practices, by creating hurdles for the poor (e.g. minimum account balances, overdraft fees, distance between branches or the proliferation of formal steps to open an account) could be an explanation, as it is often suggested. We addressed this question in the second chapter entitled Unbanked Households: Evidence on Supply-Side Factors.
We use interstate branching deregulation in the U.S. after 1994 as an exogenous shock on banking supply and find that an increase in bank competition is associated with a large drop in the share of unbanked households. In particular, we find that the effect is even stronger for populations that are more likely to be rationed by banks, such as black households living in “high racial biased” states.
The improved access to bank accounts leads to higher savings rate, while not translat-ing into higher level of indebtness, which suggests that havtranslat-ing access to formal banktranslat-ing sector plays a role in asset accumulation for this population and that banking regulation, by affecting the intensity of bank competition, could impact minorities access to financial services.
The paper with Johan Hombert leads me to study how firm behaviors can affect local productivity, knowledge spillovers and urban agglomeration. In the third chapter enti-tled The Local Innovation Spillovers of Listed Firms, I study the spillovers produced by inefficient listed firms on the cities where they operate. Using an instrument for listed firm efficiency uncorrelated with local markets, I find that when their efficiency declines, they innovate less, which conducts local private firms to innovate less in response and this effect declines sharply with distance. I provide evidence that it comes from knowledge spilling overs, especially when educated workers potentially interact more, when they can move from one firm to another and because they create new firms. Spillovers also happen because thriving cities attract capital and skilled labor potentially used by local private firms.
This last result suggests that finance could be an important factor to explain the huge disparities between cities in terms of economic specialization, entrepreneurship, growth, etc. If capital follows innovation and in return amplifies economic spillovers, initial small differences could increase rapidly. This also may explain why economic integration in Eu-rope (especially with the creation of the Euro) has translated in more divergence across the economies and not convergence as it was initially hoped.
When the Behavioralist Meets Corporate Managers
The last chapter of my thesis is made with Olivier Dessaint and is entitled Do Man-agers Overreact to Salient Risks? Evidence from Hurricane Strikes.
In this paper, we provide empirical evidence that managers exhibit biases when as-sessing risk. Specifically, we show that managers systematically respond to near-miss liquidity shocks by temporarily increasing the amount of corporate cash holdings. Over time, the perceived risk decreases, and the bias disappears. Such a reaction cannot be explained by the standard Bayesian theory of judgment under uncertainty because the liquidity shock stems from a hurricane landfall whose distribution is stationary. Instead, this reaction is consistent with salience theories of choice (Tversky and Kahneman, 1973, 1974; Bordalo, Gennaioli and Shleifer, 2012a, 2012b, 2013) that predict that the tempo-rary salience of a disaster leads managers to reevaluate their representation of risk and put excessive weight on its probability.
planations for our findings. In particular, we find only weak evidence that the possibility of risk learning or regional spillover effects may influence our results.
Contents
1 The Real Effects of Lending Relationships: Evidence from Innovative
Firms and Inventor Mobility 5
1.1 Introduction . . . 6
1.1.1 Banking deregulation . . . 12
1.1.2 Measure of innovation . . . 13
1.1.3 Identification strategy . . . 15
1.2 Data and Empirical Strategy . . . 17
1.3 Number of Innovating Firms . . . 17
1.3.1 Baseline results . . . 17
1.3.2 Relationship dependence . . . 18
1.3.3 Sensitivity to credit supply shocks . . . 20
1.3.4 Effect depending on lenders’ information set . . . 22
1.4 Labor Market Reallocation . . . 26
1.4.1 Static analysis . . . 27
1.4.2 Dynamic analysis . . . 28
1.5 Robustness . . . 31
1.5.1 Is the timing of deregulation random? . . . 31
1.5.2 Controlling for trends . . . 35
1.5.3 Alternative explanations . . . 37
1.5.4 Robustness checks . . . 39
1.6 Conclusion . . . 40
1.7 Figures and Tables . . . 46
1.8 Appendix: Construction of variables . . . 61
1.8.1 Relationship dependence . . . 61
1.8.2 External financial dependence and asset tangibility . . . 61
1.8.3 Innovative industries . . . 62
2 Unbanked Households: Evidence on Supply-Side Factors 64
2.1 Introduction . . . 65
2.2 Background . . . 69
2.2.1 Theoretical Discussion . . . 69
2.2.2 Banking Deregulation . . . 71
2.3 Data and Empirical Strategy . . . 73
2.3.1 Household Data . . . 73
2.3.2 Identification Strategy . . . 75
2.4 Results . . . 77
2.4.1 Basic Model . . . 77
2.4.2 Heterogeneous Treatment Effect . . . 79
2.4.3 Banking Deregulation, Asset Accumulation and Debt . . . 83
2.5 Robustness . . . 85
2.5.1 The Timing of Bank Deregulation . . . 85
2.5.2 Ruling out Demand Factors . . . 88
2.5.3 Evidence of Racial Discrimination across Income Groups . . . 89
2.5.4 The Effect of Deregulation across Periods and States . . . 90
2.6 Conclusion . . . 92
2.7 Figures and Tables . . . 97
2.8 Appendix . . . 108
2.8.1 Tables . . . 108
2.8.2 Variables Definitions . . . 115
3 The Local Innovation Spillovers of Listed Firms 116 3.1 Literature Review and Hypothesis Development . . . 123
3.1.1 Literature Review . . . 123
3.1.2 Hypothesis Development . . . 125
3.2 Data . . . 129
3.2.1 Innovation . . . 129
3.2.2 Geographic Area: Commuting Zones . . . 131
3.2.3 Local Labor Markets Characteristics . . . 133
3.3 Identification Strategy . . . 134
3.3.1 Empirical Specification . . . 134
3.3.2 Exogenous Variations in Innovation by Listed Firms . . . 136
3.3.3 First-Stage Results . . . 141
3.4 Local Innovation Spillovers . . . 142
3.4.2 Knowledge Diffusion Channels . . . 145
3.4.3 Local Innovation Spillovers and Venture Capital . . . 156
3.4.4 Effect Depending on Capital Availability . . . 158
3.5 Robustness . . . 160
3.5.1 Alternative Stories . . . 160
3.5.2 Additional Robustness Checks . . . 163
3.6 Conclusion . . . 164
3.7 Appendix . . . 189
3.7.1 Construction of variables . . . 189
3.7.2 List of Scientists and Engineers: Census 1990 occupation . . . 190
4 Do managers overreact to salient risks? 193 4.1 Introduction . . . 194
4.2 Hurricane activity on the US mainland . . . 201
4.2.1 Event location . . . 201
4.2.2 Event frequency . . . 202
4.2.3 Event cost . . . 202
4.2.4 Event anticipation . . . 203
4.3 The psychological mechanisms for probability evaluation and risk assessment . . . 203
4.3.1 The availability heuristic . . . 203
4.3.2 The availability heuristic . . . 205
4.3.3 Implications and hypothesis development . . . 206
4.4 Empirical design . . . 208
4.4.1 Identification strategy . . . 208
4.4.2 Data . . . 209
4.4.3 Assignment to treatment and control groups . . . 211
4.4.4 Methodology . . . 213
4.5 Do managers overreact to salient risks? . . . 214
4.5.1 Main results . . . 214
4.5.2 Cross sectional variation in managers’ responses . . . 219
4.5.3 Robustness and validity check . . . 221
4.6 Is managers’ reaction costly? . . . 222
4.6.1 Source of cash . . . 222
4.6.2 Value of cash . . . 224
4.7 Are there any other alternative explanations? . . . 226
4.7.2 The possibility of a “change in risk” . . . 233
4.7.3 The possibility of “risk learning” . . . 234
4.7.4 Reaction to extreme earthquakes outside the US . . . 235
4.8 The effects of cash holdings on post-hurricane performance . . . 236
4.9 Conclusion . . . 238
Chapter 1
The Real Effects of Lending
Relationships: Evidence from
Innovative Firms and Inventor
Mobility
How the Banking Sector can Shape State Innovative
Capacities
1.1
Introduction
Innovation is essential for long-run economic growth (Schumpeter 1942). However, be-cause innovation relies on human capital and intangible assets, its financing is inhibited by informational frictions (Hall and Lerner 2010). This raises the question of which type
of financial system is more conducive to the financing of innovation.1
The banking literature (e.g., Rajan 1992) contrasts two polar systems – relationship-based versus arm’s length – each with its forces and weaknesses in funding innovative firms. On the one hand, in a relationship-based system, lenders are better able to acquire subjective and abstract (“soft”) information through ongoing personal interaction with borrowers. Soft information can mitigate information asymmetry, especially for small,
opaque firms (Petersen and Rajan 1994) and facilitate the financing of innovation.2 On
the other hand, Rajan and Zingales (2003) argue that a relationship-based system may fa-vor incumbents at the expense of newcomers and prevent the entry of innovative startups. They further assert that an arm’s length system may give innovators a better chance of securing a loan, because it allows them to tap a wider circle of potential lenders and facilitates the aggregation of public, hard information dispersed among many investors.
In this paper, we study how the strength of lending relationships affects innovation activity and its distribution across the economy. First, we analyze whether lending re-lationships foster or impede innovation and test whether the ability of innovators to exchange soft information with lenders is crucial to innovative activities. Second, we
1See Hall and Lerner (2010), Lerner, Sorensen, and Stromberg (2011), and Brown, Martinsson, and Petersen (2013) for studies of equity funding of innovation, and Acharya and Subramanian (2009), Amore, Schneider and Zaldokas (2013), Chava et al. (2013), Cornaggia et al. (2013), Mann (2013), and Nanda and Nicholas (2013) for the role of credit market institutions.
2Examples of soft information include the competence and trustworthiness of the management, the types of forthcoming investment opportunities, or trade secrets whose public disclosure would reduce a project’s value.
contrast the effect of relationships on opaque versus transparent firms and study how it affects the allocation of innovative human capital across firms. This investigation allows us to explore how lending relationships shape the distribution of innovation capacities.
The difficulty when studying the effect of lending relationships is that these relation-ships are not random. In particular, they are likely to be endogenous to firm charac-teristics that may be correlated with innovation activity. To overcome this problem, we use the wave of intrastate banking deregulation passed in different states in the United States from the early 1970s to the mid-1990s as a shock to relationships. By removing re-strictions on bank expansion within state borders, intrastate deregulation has intensified banking competition (Black and Strahan 2002; Stiroh and Strahan 2003) and increased the size of banks (Jayaratne and Strahan 1998). These developments in local banking markets damage lending relationships. Indeed, Petersen and Rajan (1995) show that competition reduces banks’ incentives to invest in relationships as they are less able to reap the rewards of their investment in the future. In addition, Stein (2002) demonstrates that large banks interact more impersonally with their borrowers because they have dif-ficulties dealing with non-verifiable soft information that cannot be easily passed along within the hierarchy.
The staggered timing of banking deregulation across states permits a difference-in-difference identification strategy, which compares innovation activity before and after each deregulation event relative to a control group of states not undergoing a regulation change. We proxy for innovation activity by counting the number of firms filing patents with the U.S. Patent and Trademark Office (USPTO). An appealing feature of USPTO data is that they cover the whole universe of patents, including patents filed by small and
private firms.
We find that the number of innovative firms declines after states deregulate their banking system. Exploring the dynamic effect of deregulation, we show that there is no pre-deregulation trend and that the number of innovative firms starts to decline three years after deregulation and ends up 20% below its initial level after 10 years. Given that the average state has 180 firms that file patents in a given year, a state that deregulates its banking system loses an average of 36 innovative firms in the long-run.
To confirm that our shock increases credit constraints for lending relationship-dependent firms, we explore the cross-sectional dimension of our effect. We construct three standard proxies to classify industries by the strength of relationships and find that the decline in innovation is more pronounced in industries where firms rely more on relationships. This effect is even stronger in industries that are more exposed to credit supply shocks: industries that are more dependent on external finance (Rajan and Zingales 1998) and those with fewer tangible assets (Almeida and Campello 2007).
We also define more granular proxies for firms’ dependence on lending relationships. Since opaque firms rely more on relationships to exchange soft information with lenders (e.g., Berger et al. 2005), we proxy for relationship dependence at the firm level by its degree of opacity. First, we find that the decline in innovation is concentrated in young firms, as these firms typically produce less hard information. Second, it is also stronger in young industries holding fixed firm age, because it is more difficult to evaluate projects in nascent industries as there are fewer successful projects to which new projects can be compared. Third, we obtain similar results when we use firms’ patenting history to proxy for the amount of information that is available to lenders. These results depict a
consistent story where opaque, relationship-dependent innovators are more affected by deregulation.
We next turn to the consequences of credit supply shock on the labor market of inven-tors. Specifically, we study how it affects the allocation of talent and inventor mobility across firms and across states. First, we show that small firms tilt the composition of their innovative workforce away from young inventors after deregulation, consistent with the hypothesis that small firms compensate the loss of soft information by employing more seasoned inventors. Small firms are also less likely to employ promising inventors, suggesting that constrained employers lose their most talented employees.
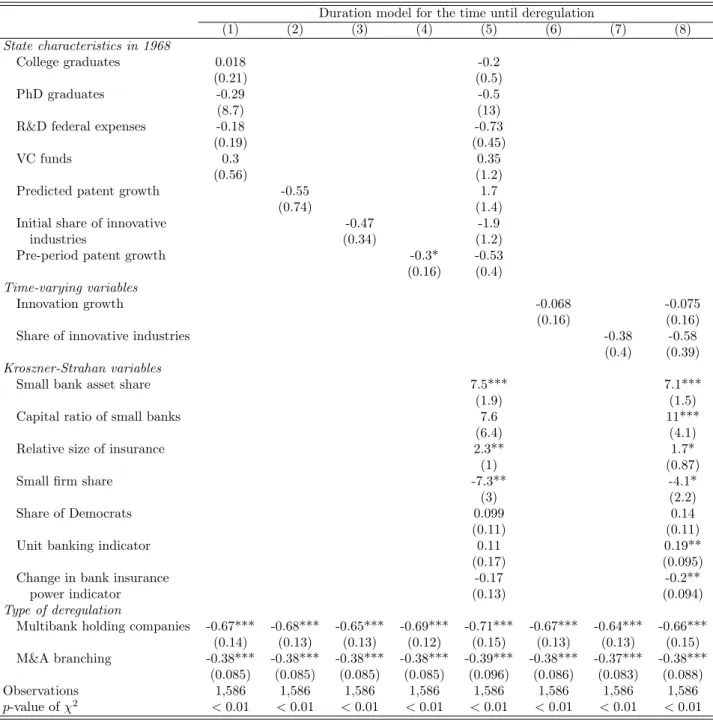
Second, we study inventor mobility across firms (within state) and across states. We find that inventors working for small firms are more likely to leave after deregulation and, when they leave, they are more likely to switch to a larger employer. Zooming in on the characteristics of moving inventors, we observe that younger and more promising inventors are more likely to change firms following deregulation. Across states, we find that inventors are more likely to relocate to another state when their state of origin deregulates. This effect is stronger for inventors working in small firms and for young and promising inventors. Overall, our results indicate that financial reforms affect not only the level, but also the geographical and across-firm distribution of innovative activity. Finally, we investigate the identifying assumption behind out analysis, namely, that the timing of deregulation is exogenous to innovation activity. Kroszner and Strahan (1999) show that deregulation is not random and is related to interest group factors such as the prevalence of small banks and of small firms. However, we show that the timing of deregulation is not related to various measures of state-specific innovation capacities
or pre-deregulation innovation trends, which suggests that deregulation offers a valid quasi-natural experiment as far as innovation is concerned.
Our paper relates to several strands of literature. First, it connects with the literature on the real effects of lending relationships (e.g., Petersen and Rajan 1994; Berger and Udell 1995; Berger et al. 2005; Zarutskie 2006; Detragiache, Tressel, and Gupta 2008). We add to this literature by focusing on an important outcome, innovation, through which the banking sector can impact economic growth.
Second, we contribute to the literature linking bank financing and innovation (Ben-fratello, Schiantarelli, and Sembenelli 2008; Hellmann, Lindsey, and Puri 2008) and more specifically to the research agenda that seeks to identify the characteristics of debt mar-kets that are more conducive to innovation. Acharya and Subramanian (2009) and Mann (2013) study the effect of creditor rights, while Nanda and Nicholas (2013) investigate the impact of bank distress.
Another channel through which banking regulation can affect innovation is analyzed by Amore, Schneider, and Zaldokas (2013), who focus on another episode of deregulation in the U.S., namely, interstate banking deregulation, which allowed banks to expand
across state borders.3 They show that interstate deregulation enabled banks to better
diversify and thus to increase credit supply to innovative firms. Cornaggia et al. (2013) exploit another episode of interstate deregulation to study the dynamics of public firms’ acquisitions of small innovative targets. In contrast, we focus on the wave of intrastate branching deregulation, which allowed banks to expand within state borders. The reason is that we want to isolate the effect of a shock to lending relationships with no change
in banks’ ability to diversify geographically: arguably, diversification benefits are much
lower with within-state expansion.4
More closely related to our paper is Chava et al. (2013), who consider both intrastate and interstate banking deregulation. Their focus is different as their goal is to contrast the effects of intrastate deregulation with interstate deregulation. They find, like us, that innovation decreases following intrastate deregulation. In contrast to us, they argue that this effect is due to a reduction of competition in local banking markets. We offer and test an alternative hypothesis: deregulation stifles innovation because by increasing com-petition, it damages lending relationships. First, our explanation reconciles our findings with those of previous studies that intrastate branching deregulation increases banking competition (Jayaratne and Strahan 1998; Black and Strahan 2002; Stiroh and Strahan 2003; Cetorelli and Strahan 2006). Second, to disentangle Chava et al.’s (2013) hypoth-esis from ours, we follow the methodology of Black and Strahan (2002) to show that the effect of deregulation operates through an increase in banking competition. Specifically, we show that innovation declines more in states with more concentrated banking markets, because the increase in competition has a greater effect in markets that are initially less competitive. Finally, we provide several additional tests of the relationship hypothesis in the cross-section of industries, firms, and inventors.
Third, we contribute to the burgeoning literature on inventor mobility (Almeida and Kogut 1999; Agrawal, Cockburn, and McHale 2006; Breschi and Lissoni 2009; Marx, Strumsky, and Fleming 2009) and more broadly to the literature on the domestic and international migration of skilled human capital (instance Borjas, Bronars, and Trejo
4Among our other robustness tests, we check that our results are robust to controlling for interstate deregulation.
1992; Boustan, Fishback, and Kantor 2010; Docquier and Rapoport 2012). Our paper indicates that finance also determines the migration of talent.
1.1.1
Banking deregulation
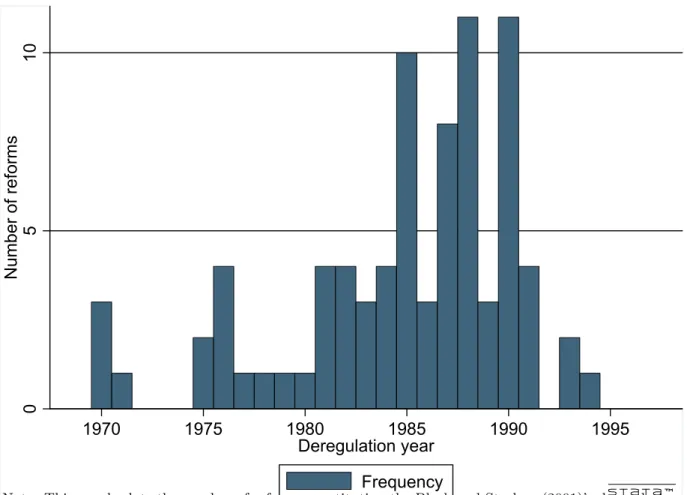
[INSERT FIGURE 1.1 ABOUT HERE]
Before 1970, most U.S. states had strong banking market regulations. Branching was either prohibited or strongly limited, with the exception of 12 states that allowed unre-stricted statewide branching. Starting in 1970 however, all the other states progressively lifted restrictions on branching within their borders. States generally relaxed restrictions on within-state bank expansion in three steps: by permitting the formation of multibank holding companies, by permitting branching by means of merger and acquisitions (M&As) only, and by permitting unrestricted (de novo) branching, thereby allowing banks to enter new markets by opening new branches. Figure 1.1 illustrates the timing of the deregula-tion for the three dimensions. There are 82 episodes of dereguladeregula-tion in 39 different states between 1970 and 1994. Because we do not have priors about which of these three steps had the greatest impact, we follow Black and Strahan (2001) and construct a deregulation index. The index equals zero if a state does not permit branching via M&As, de novo branching, or the formation of multibank holding companies; otherwise, the index equals
the sum of the number of ways banks may expand within a state.5 At the end of the
deregulation period, in 1994, 38 states had a deregulation index equal to three.
In our main specification, the deregulation index enters linearly into the innovation
5While stronger competition and larger bank size limit the ability of lenders to finance soft information-based projects, the lifting of de novo branching restrictions might also reduce distance to the nearest lender, which may counterbalance partially the loss of soft information. If this is the case, then our estimate will underestimate the impact of hurting lending relationships on innovation.
equation, that is, we assume that increasing the index from zero (full regulation) to one has the same effect as moving from one to two, or from two to three (full deregulation). We show in Section 1.5.4 that our results are robust when using the index non-parametrically.
1.1.2
Measure of innovation
We use patents filed with the U.S. Patent and Trademark Office (USPTO) compiled in the National Bureau of Economic Research (NBER) Patents File (Hall, Jaffe, and Tra-jtenberg 2001) to measure innovation. The data contain all patents granted in the U.S., along with information about the patentee (unique identifier, institutional characteristics, nationality, geographic localization) and about the patent (year of application, technol-ogy class, number of citations received). An appealing feature of the NBER Patents File is that it covers the entire universe of patents filed in the U.S., including patents filed by young and private firms. This is important because these firms are more likely to be affected by changes in local banking markets as they typically have less access to national capital markets. Having comprehensive patent data is also needed to assess the effect of banking deregulation on the total amount of innovation produced in each state. This feature of the data allows us to rule out explanations of our results based on a change in the share of innovation conducted by public versus private firms.
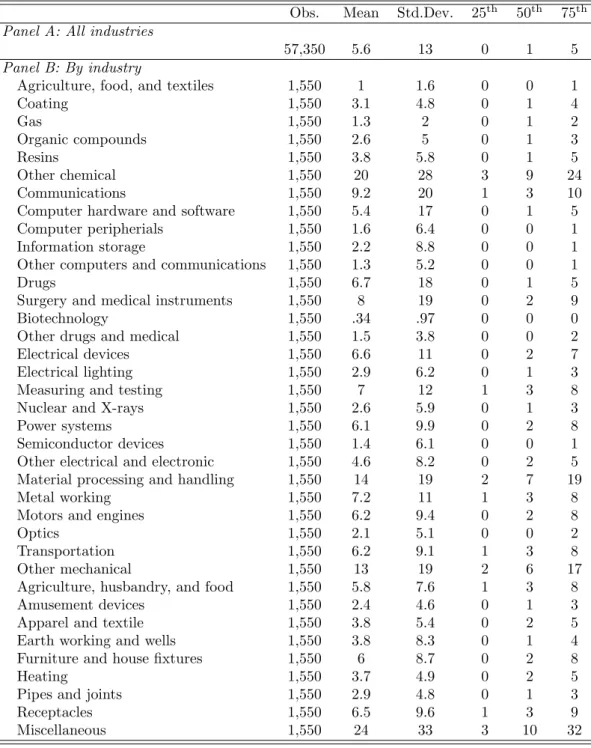
While the NBER patent data do not have a standard industry classification, they have a classification based on the technology of patents. We use the two-digit classification,
which counts 37 technology classes listed in Table 1.1.6 With a slight abuse of terminology,
we will use the terms “technology class” and “industry” interchangeably in this paper.
6We have re-run all our regressions and obtained similar results with the finest three-digit classifica-tion, which counts 422 technology classes.
[INSERT TABLE 1.1 ABOUT HERE]
We only keep patents filed by U.S. corporations in our sample, thereby excluding
foreign firms, universities, and governmental agencies.7 We date our patents according
to the year in which the patent application was filed. This avoids anomalies that may be created due to a lag between the date of application and the granting date. We con-sider all patents filed between 1968 (two years before the beginning of the deregulation period) and 1998 (four years after the end of the deregulation period). Our main vari-able of interest is the number of uniquely identified firms that file at least one patent
(hereafter “innovators”) at the state-year-industry level.8 Finally, we follow the banking
deregulation literature and exclude Delaware. This leaves us with a balanced panel of 37 industries in 50 states (including the District of Columbia) over 31 years. Table 1.1 reports summary statistics for the number of innovators for each of the 37 industries. There is an average (median) of 5.6 (1) innovators in a given state-year-industry cell with a substantial heterogeneity across both industries and states.
Patents have long been used as an indicator of innovative activity (Griliches 1990); this measure, however, has its drawbacks. Not all firms patent their innovations, because some do not meet the patentability criteria and the firm might rely on secrecy or other means to protect its innovation. In addition, patents measure only successful innovations. Despite these drawbacks, there is nevertheless a strong relationship between R&D and the number of patents in the cross-section of firms (R-squared is 0.9; see Griliches 1990).
7We exclude foreign firms because these firms often file patents with the USPTO to protect their innovations on U.S. soil but actually seek financing and do their R&D in their home country (see Acharya and Subramanian 2009).
8When an innovator files patents in several industries in a given state and year, we assign the innovator to the industry(ies) in which the innovator filed the largest number of patents (if the maximum is reached for several industries). This assumption is consistent with interpreting the number of innovators as a measure of the extensive margin of innovation, as it avoids double counting.
1.1.3
Identification strategy
Our main specification focuses on the number of innovative firms. The reason is that we want to weight small and large firms equally, because we expect deregulation to affect mostly small firms. Following the innovation literature, we estimate a Poisson model to
take into account the counting nature of the dependent variable:9
E [Innovatorsjst] = exp (αj + γs+ δt+ β Deregulationst+ Controlsst) , (1.1)
where Innovatorsjst is the number of innovators in industry j, state s, and year t.
Deregulationst is the deregulation index equal to the number of steps of deregulation
that have been implemented in state s up to year t, that is, the index is incremented by
one for all the years following each deregulation event. αj, γs, and δt denote industry,
state, and year fixed effects. Industry fixed effects account for the heterogeneity in the propensity to innovate and to patent innovation across industries. State fixed effects capture time-invariant determinants of innovation in the different U.S. states, such as the size of the state, the sectoral composition, and the level of education. Year fixed effects
control for aggregate shocks and common trends in innovation activity.10 We also
con-trol for time-varying state characteristics that may affect innovation: annual number of college degrees granted, annual number of doctorates granted, annual amount of federal funds for research and development, and volume of capital invested each year by venture
capitalists.11 The Poisson model is estimated using maximum likelihood and standard
9See Hausman, Hall, and Griliches (1984) for a discussion of count data models.
10Such common shocks can be caused by changes in the legal and institutional environment at the federal level, such as the creation of the Court of Appeals for the Federal Circuit in 1982.
11Data on educational attainment and federal R&D expenses come from the National Science Foun-dation’s CASPAR database, while information on venture capital funds is from VentureXpert.
errors are clustered at the state level to account for serial correlation and correlation within states.
The parameter of interest is β. It measures the permanent effect of one step of
deregulation (out of three possible steps) on the number of innovators. The identification of β relies on comparing the number of innovators before and after deregulation relative to a control group of states not experiencing a change in regulation.
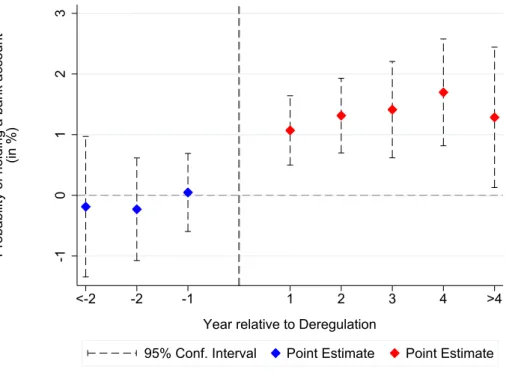
[INSERT FIGURE 1.2 ABOUT HERE]
Before running our regressions, we estimate the dynamic effect of deregulation around the event date. In Figure 1.2, we estimate equation (1.1) where the deregulation index is replaced by dummy variables for each year from 10 years before to 10 years after each step of deregulation. Reassuringly, there is no trend before the event date. In particular, the number of innovators 10 years before deregulation is almost equal to the number of innovators at the time of deregulation. This is consistent with our identifying assumption that deregulation is not endogenous to innovation (see also Section 2.5.1). Figure 1.2 also shows that the effect of deregulation starts to materialize three-four years after the event date. There are two possible explanations for this result. First, it can take a couple of years before deregulation reshapes the banking market structure and leads to the development of large banks (Jayaratne and Strahan 1998). On the other hand, the adverse effect of competition on banks’ incentives to invest in lending relationships is effective as soon as banks anticipate increased competition, which is at the time of deregulation (or even before if deregulation is anticipated). Second, there is a delay between the time an innovative project is funded and the moment when the firm files the patent application. We run formal statistical tests in the following section.
1.2
Data and Empirical Strategy
1.3
Number of Innovating Firms
1.3.1
Baseline results
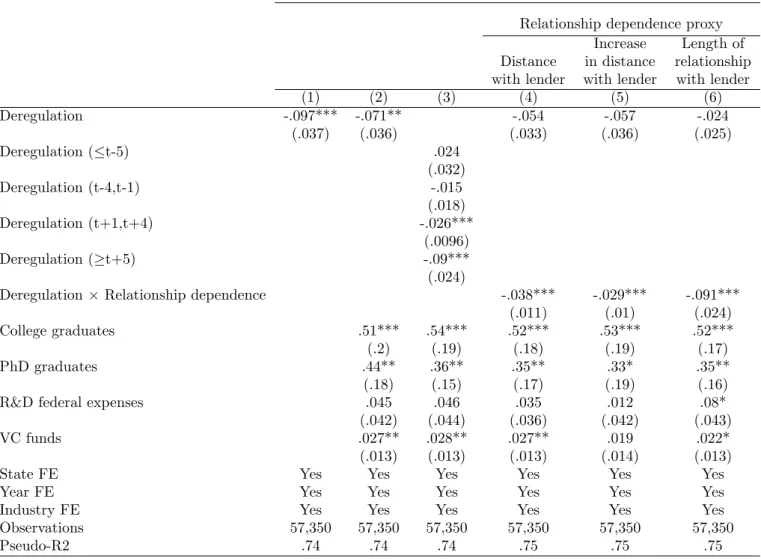
[INSERT TABLE 1.2 ABOUT HERE]
We start by investigating the effect of banking deregulation on the number of innova-tive firms. Results are reported in Table 1.2. Column (1) shows that every deregulation step leads to a statistically significant 9.7% decline in the number of innovators. In col-umn (2), we add time-varying control variables for the level of education, federal R&D spending, and venture capital activity at the state-level. All these variables are significant with the expected sign except federal R&D spending, which is insignificant; this may be due to the fact that federal spending is directed toward moderately innovative states. The coefficient on the deregulation index remains negative at −7.1% and significant at the 5% level. Given that the deregulation index ranges from zero to three, it indicates that the number of innovators drops by a little more than 20% when a state moves from being fully regulated (deregulation index equal to zero) to being fully deregulated (deregulation index equal to three).
In column (3) we exploit the time dimension of the panel more fully to check that we are not capturing a trend. We decompose each of the three components of the deregulation index into four dummy variables associated with four periods around the deregulation date: more than four years before deregulation, the four years preceding deregulation, the four years following deregulation, and more than four years after deregulation. Then,
we sum over the three components of the deregulation index to obtain four dummy variables corresponding to the four time periods around each step of deregulation. The deregulation year is the reference year. First, as seen in Figure 1.2, we find that there is no pre-deregulation trend. Second, we also find that it takes some time before the effects of deregulation materialize: the number of innovators decreases by 2.7% in the first four years after deregulation while it decreases by 9% after that.
1.3.2
Relationship dependence
We next turn to our main hypothesis, namely that innovation declines because lending relationships are hurt by deregulation. To test this hypothesis, we ask whether innovators that are more reliant on relationships are more affected by deregulation. One difficulty is that relationships reflect the optimal answer of firms to their specific environment, which may create an endogeneity problem. To overcome this problem, we rely on an empirical strategy that is similar in spirit to Rajan and Zingales (1998). We posit that some industries are naturally more reliant on bank relationships than others, for instance because firms operating in these industries are more opaque and need to exchange soft information with lenders. Thus, we compute proxies of relationship dependence at the industry level across all borrowers in the U.S. By construction, these proxies are constant across states and are therefore exogenous to unobserved state-specific characteristics.
We create three proxies of relationship dependence using the National Survey of Small Business Finances (1987 and 1998), which contains a thorough documentation of firms’
relationships with financial institutions.12 The first proxy is the average distance
be-12For more details about this database, see Petersen and Rajan (2002). We provide more detail on how we construct these proxies in Appendix 3.7.1.
tween firms and their main lenders in 1987 (the first year the survey was conducted) at the two-digit SIC level. As shown by Petersen and Rajan (2002), when the distance between the bank lending office and the borrowing firm is longer, they communicate in more impersonal ways and are less able to share soft information. The second proxy is borrowed from Landier, Nair, and Wulf (2009) and is defined as the average increase in distance between banks and borrowers between 1987 and 1998. The idea is that in hard information industries, the distance between banks and borrowers increases more as lenders take advantage of technological developments. The third proxy of relationship dependence is the average length of the relationship between banks and borrowers in 1987 (Petersen and Rajan 1994). The low correlations between these three measures suggest
that they are capturing different dimensions of relationship dependence.13 Finally, we
map each of the three variables into the 37 patent classes that we use in our regressions and classify a patent class as relationship dependent if the variable is above the sample
median.14
We regress the number of innovators on the deregulation index and its interaction with each of the three measures of relationship dependence as well as on the same set of controls and fixed effects as before. The results are reported in Table 1.2, columns (4)-(6). With all three measures, the negative effect of deregulation is stronger in more relationship-dependent industries, while the effect is never significant in industries less reliant on relationships (the reference group in the regression). The difference between
13The correlation between (minus) distance and (minus) change in distance is −0.42, between (minus) distance and length of relationship is −0.01, and between (minus) change in distance and length of relationship is 0.23. The fact that the first correlation is negative is due to the fact that distance is measured in 1987 and change in distance is computed between 1987 and 1998, which are negatively correlated if it is easier to increase the distance when the initial distance is small.
14We obtain similar results if we split industries into terciles or quartiles of relationship dependence or if we use the continuous variables.
high and low relationship dependent industries is −3.8% when relationships are proxied by average distance with lender, −2.9% when relationships are proxied by change in distance, and −9.1% when using the length of relationships; it is significant at the 1% level with all three proxies. These results lend support to the hypothesis that innovation activity slows down because banking deregulation increases credit rationing for firms that are more reliant on relationship lending.
1.3.3
Sensitivity to credit supply shocks
To provide further evidence that our findings are explained by a credit supply shock, we test whether our effect is stronger for firms that are more sensitive to credit supply shocks. We consider two standard measures of sensitivity to credit supply shocks. The first one is Rajan and Zingales’ (1998) external finance dependence defined as the industry average of the fraction of investment that cannot be financed by current cash flows. The second proxy is asset tangibility; it captures more specifically the sensitivity to a shock to lending relationships. Indeed, tangible assets can be pledged to mitigate information asymmetries, which is especially useful when relationships are weak and borrowers cannot share soft information with lenders. For instance, Berger and Udell (1995) show that
banks ask for more collateral when they have weaker relationships with the borrower.15
We measure asset tangibility as the industry average of the ratio of net property, plant, and equipment over total assets. We construct these two variables using Compustat and map the SIC industries into patent classes.
[INSERT TABLE 1.3 ABOUT HERE]
15See also Almeida and Campello (2007) and Chaney, Sraer, and Thesmar (2012) for the importance of tangible assets in alleviating credit constraints.
Table 1.3, column (1), we regress the number of innovators on the deregulation in-dex and its interaction with financial dependence. We find that the interaction term is negative and significant. Therefore, industries that rely more on external financing are more affected by deregulation. This is consistent with the interpretation that the observed drop in innovation is due to a credit supply shock. We next consider the triple interaction of deregulation with financial dependence and with each one of the measures of relationship dependence. In columns (2)-(4), the triple interaction term is negative for all three proxies and is significant at the 5% level for two out of the three proxies. There-fore, among relationship-dependent industries, those that are more reliant on external financing are more affected by deregulation than those that have more internal funds. This result lends further support to the interpretation that the effect of deregulation on relationship-dependent industries operates through a credit supply shock.
A similar picture emerges when we use asset tangibility as a proxy for sensitivity to credit supply shocks. In column (5), the interaction term between deregulation and asset tangibility is positive and significant, which indicates that the negative effect of deregu-lation is dampened in industries that have more tangible assets. The triple interaction of deregulation with asset tangibility and relationship dependence is positive and significant for all three proxies of relationship dependence. Therefore, among relationship-dependent industries, those with more tangible assets are less affected. This finding is consistent with Berger and Udell (1995), who show that tangible assets which can be pledged to secure loans are substitutes to lending relationships.
1.3.4
Effect depending on lenders’ information set
So far we have considered industry-level time-invariant measures of relationship depen-dence. We now develop more granular measures based on the idea that borrowers who cannot produce easily verifiable information have to rely on relationship lending [see Berger et al. 2005 for a discussion]. Relationships allow opaque firms to exchange soft information with lenders and thus to mitigate information asymmetries (Petersen and Rajan 1994). Therefore, the prediction of the relationship hypothesis is that innovators who cannot produce hard information should be more affected by the weakening of lend-ing relationships brought about by deregulation. To test this prediction, we create a series of measures for the amount of hard information available to lenders.
Information proxy based on age
The first proxy is simply the age of the firm. Young firms have mechanically a shorter track record than old firms, therefore it is more difficult for young innovators to produce hard information such as past patents or historical financial statements. The second proxy is the age of the industry. Regardless of the firm’s ability to produce hard information about itself, its projects remain hard to evaluate if it operates in a young industry and the banker remains at arm’s length. Intuitively, it is more difficult to assess the quality of a project when there is no similar product on the market than when several firms have already successfully commercialized similar innovations. Therefore, the ageing of an industry produces hard information for all the projects in the industry. In other words, it was more difficult to assess the quality of a project in the computer sector before the emergence of Microsoft, Sun Microsystems, and Apple.
Firm age is calculated as the number of years since the firm first filed a patent appli-cation. We identify young firms as those whose age is below the sample median (three
years) and old firms as those whose age is above the sample median.16 Industry age is
measured as the median age of innovators in the industry. We classify an industry as
young if its age is below the median industry age (also three years) and old otherwise.17
To investigate the effect of age, we count the number of young innovators and the number of old innovators at the state-year-industry level. We therefore obtain a four-dimensional balanced panel where the new dimension is the age category of innovators: young or old. We construct a dummy variable equal to one in the young innovator age category, as well as a dummy variable equal to one if the industry is classified as young. We then regress the number of innovators at the state-year-industry-innovator age category level on the two age dummies and their interactions with deregulation, as well as the same controls and fixed effects as in equation (1.1).
[INSERT TABLE 1.4 ABOUT HERE]
The results are reported in Table 1.4. In column (1), we consider the effect of innovator age and find that deregulation essentially affects young innovators. While the effect of deregulation on old innovators (the reference group) is negative and insignificant, the number of young innovators decreases by a significant 5.1% compared to old innovators. In column (2), we consider industry age and find that compared to old industries, the number of innovators in young industries decreases by a significant 7.5% after deregulation. When
16The NBER Patents File starts in 1965 but coverage is good only starting in 1968, which creates a truncation problem in the definition of age. To limit this problem, we start the sample period in 1970 when studying the effect of age.
17We find similar results in unreported regressions when we use the average age of patents in the industry as an alternative measure of industry age.
we include innovator age and industry age in column (3), both are negative and significant: young industries are more affected holding fixed firm age, and young firms are more affected holding fixed industry age. These results are consistent with the hypothesis that damaging lending relationships is more harmful to firms and industries that do not have much a track record.
Information proxy based on the patent portfolio
Another dimension of an innovative firm’s track record is its patenting history. To proxy for the information set of potential lenders, we construct two variables based on observable information about the firm’s patent portfolio. To create the first variable, we rely on pairwise citations data, which provide for every patent k the list of patents that cite patent k. Since we know the date when citing patents are granted, we can compute at any point in time the number of citations received by a given patent up to that point. Therefore, we can count the total number of citations received by the patent portfolio of a firm at any point in time. Forty percent of innovator-year observations correspond to firms that have received at least one citation. We classify innovators into two groups depending on whether they have received at least one citation. Finally, we count at the state-industry-year level the number of innovators with no past citations, as well as the number of innovators whose patents have already received citations.
While the first proxy captures the observable quality of the patent portfolio, the second proxy measures the complexity of the patent portfolio. To measure the complexity of a patent, we ask whether it cites a wide body of technological antecedents, in which case external lenders might find it more difficult to assess its quality because this requires
expertise in a broad set of industries. To operationalize this idea, we borrow from the measure of patent originality developed by Hall, Jaffe, and Trajtenberg (2001), which is defined as one minus the Herfindahl concentration index of patent classes associated with cited patents. For each innovator-year observation, we compute the average originality across patents filed by the firm up to that year, and we count the number of firms with patent portfolio originality above the median, as well as the number of firms with patent portfolio originality below the median.
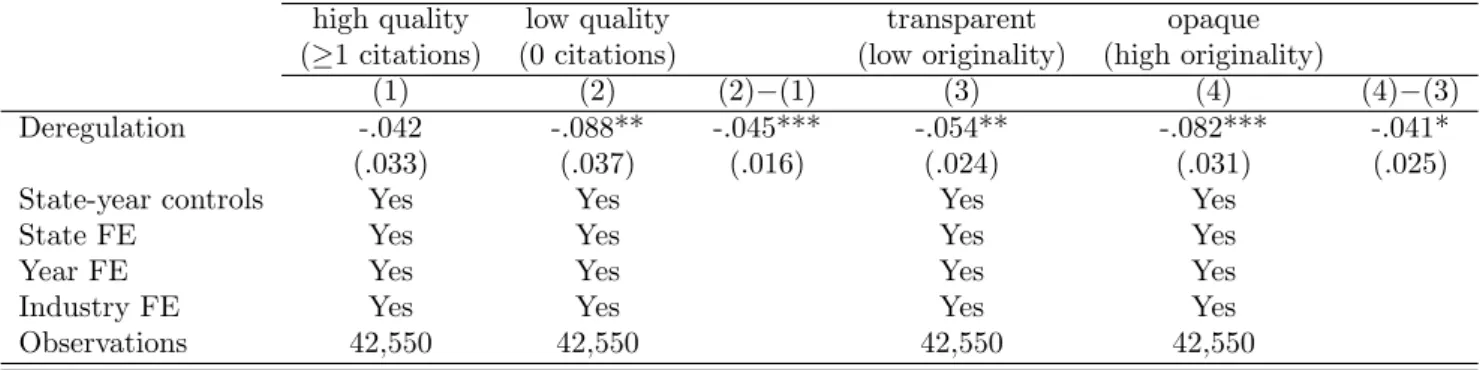
[INSERT TABLE 1.5 ABOUT HERE]
Table 1.5 reports the results of the effect of deregulation depending on the amount of information available to lenders. First, we find that firms with cited patents are barely affected by deregulation (negative but insignificant coefficient in column (1)). Conversely, the number of innovators with no cited patents decreases by a significant 8.8% (column (2), the difference with the estimate in column (1) is significant at the 1% level). There-fore, more opaque innovators are more affected by deregulation than innovators with a track record of successful patents. The results in columns (3) and (4) are similar when using the alternative proxy for the lender’s information set based on the complexity of patent portfolios. Overall, the results in this section are consistent with the interpreta-tion that deregulainterpreta-tion tightens credit constraints for opaque innovative firms that need to share soft information with lenders.
1.4
Labor Market Reallocation
In this section we investigate whether there is a reallocation of inventors following dereg-ulation. We focus on human capital for several reasons. First, labor and especially educated labor is highly mobile both across firms and across geographic areas. Second, our lending relationships hypothesis makes predictions on the characteristics of inventors who move after deregulation and on the characteristics of firms they leave and the firms to which they move. If deregulation entails a loss of soft information for small, opaque firms, we expect those firms to prefer hiring seasoned inventors to alleviate information asymmetry with lenders. Indeed, hiring a seasoned inventor allows the firm to produce more hard information to the lender since her track record of patents is easily verifiable. In addition, if credit constraints increase particularly for small firms, then these firms should lose their talented inventors first as they are more difficult to retain.
The patent data include the names of the inventors for every patent; they do not, however, provide consistent listings of inventor names or unique inventor identifiers. To overcome this problem, Lai, D’Amour, and Fleming (2009) develop a disambiguation algorithm to create unique inventor identifiers, which we use to track inventors over time. Since inventor identifiers are only available starting in 1975, we study inventor mobility
over the 1975-1998 period.18
We first take a static view and study the composition of the labor force of inventors of small versus large employers. Then, we explore the mobility of investors across firms and across states and ask whether inventors leave small firms to work for bigger firms or for firms located in other states.
18The data are available at http://dvn.iq.harvard.edu/dvn/dv/patent and the disambiguation algo-rithm is discussed in Lai, D’Amour, and Fleming (2009).
1.4.1
Static analysis
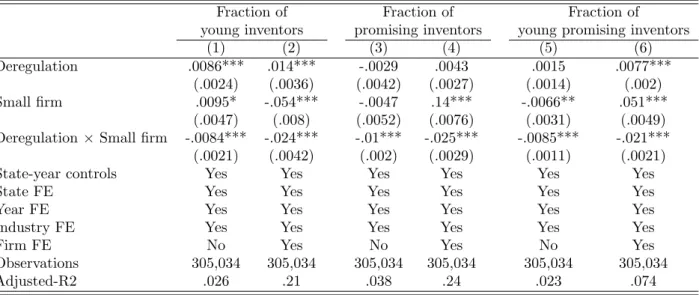
We start the analysis at the firm level. Each year, we list for each firm all the authors of patents filed by the firm during that year; when the same inventor is the author of several patents in the same firm-year, she is listed only once. We have 305,034 firm-year observations. We measure employment as the number of inventors at the firm-year level and define small firms as firms with below-median employment (three inventors). To investigate employment composition, we construct three variables at the firm-year level: the fraction of young inventors, the fraction of promising inventors, and the fraction of young promising inventors. We measure inventor age as the time elapsed since the inventor first filed a patent and define young inventors as those who are below the median inventor age (two years old). To proxy for promising inventors, we count the number of patents the inventor will file in the future and define promising inventors as those with a number of future patents above the median (two patents). Young promising inventors are those who are both young and promising.
[INSERT TABLE 1.6 ABOUT HERE]
First, we regress the fraction of young inventors at the firm-year level on the dereg-ulation index, a small firm dummy and its interaction with deregdereg-ulation, and the same set of fixed effects and controls as in equation (1.1). Consistent with the hypothesis that small firms compensate the loss of soft information by hiring more seasoned inventors, the interaction term between the small firm dummy and deregulation in column (1) in Table 1.6 is negative and significant at the 1% level. Second, in column (3), we find that the fraction of promising inventors also drops by a significant amount in small firms
lose their most talented employees first. Finally, combining these two results, we analyze in column (5) the fraction of young promising inventors and find that it decreases by 0.85 percentage points in small firms relative to large firms following deregulation. Given that young promising inventors represent on average 16% of the inventors in a firm, this means that each step of deregulation reduces the fraction of young promising inventors by 0.85/0.16 = 5% in small firms. All these findings are robust to controlling for firm fixed effects in columns (2), (4), and (6).
1.4.2
Dynamic analysis
The above results offer a static view of the composition of the labor force at the firm level. We now take a more dynamic view and investigate inventor mobility across firms and across states.
To measure inventor mobility we follow Marx et al. (2009) and identify an inventor as changing employers if she files two successive patent applications that are assigned to dif-ferent firms. Specifically, we start with the patenting history of 630,866 unique inventors. The unit of observation is an inventor-employer-year cell (i, k, t) such that inventor i files at least one patent assigned to firm k in year t. For every subsequent observation, we define a move dummy variable equal to one if the inventor’s employer is different from the
previous employer;19 15.5% of observations correspond to a move. Because the previous
observation for the same inventor is needed to detect a move, the first observation of each
19When we observe a firm change, we do not know precisely when it occurred within the time interval between the two observations. This is, however, unlikely to be a major problem because the average time between two consecutive observations is only 2.4 years. In the main analysis, we follow Marx, Strumsky, and Fleming (2009) and consider that the move happens at the midpoint of the time window between the two observations. In unreported regressions, we obtain similar results when assuming that the move happens at the first date or at the second date.
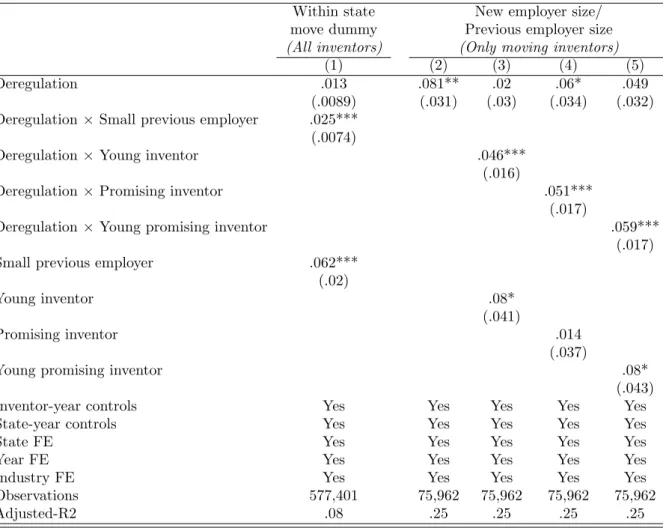
inventor is excluded from the analysis; in particular, investors that appear only once are excluded. We are left with 232,091 unique inventors and 577,401 inventor-employer-year observations. We construct two variables to study inventor mobility: a within-state move dummy variable equal to one if the inventor moves to another firm in the same state (13% of observations) and an out-of-state move dummy variable equal to one if the inventor moves to another firm in another state (2.5% of observations).
[INSERT TABLE 1.7 ABOUT HERE]
We start by analyzing state mobility in Table 1.7. First, we regress the within-state move dummy on the deregulation index and its interaction with the dummy variable equal to one if the inventor’s (initial) employer is below the median size. In addition to the same set of fixed effects and controls as in equation (1.1), we also include inventor age and indicator variables for the inventor’s main technology class defined as the industry in which the inventor files the largest number of patents over the sample period. We find that the likelihood that an inventor leaves a small employer increases by 3.8 percentage points (0.013+0.025 in column (1)) following every step of deregulation. This corresponds to a 30% increase relative to the unconditional probability of moving. In contrast, there is no significant effect on mobility away from large firms (the reference group in the regression).
We next investigate whether inventors are leaving small firms to work for larger firms. We focus on the subsample of inventor-employer-year observations corresponding to a change of employer within the state and compute the ratio of new employer size over previous employer size. Column (2) in Table 1.7 shows that after deregulation, the ratio