HAL Id: hal-01448826
https://hal.univ-reunion.fr/hal-01448826
Submitted on 19 May 2017
HAL is a multi-disciplinary open access
archive for the deposit and dissemination of
sci-entific research documents, whether they are
pub-lished or not. The documents may come from
teaching and research institutions in France or
abroad, or from public or private research centers.
L’archive ouverte pluridisciplinaire HAL, est
destinée au dépôt et à la diffusion de documents
scientifiques de niveau recherche, publiés ou non,
émanant des établissements d’enseignement et de
recherche français ou étrangers, des laboratoires
publics ou privés.
Insights into the evolution of the Yenkahe resurgent
dome (Siwi caldera, Tanna Island, Vanuatu) inferred
from aerial high-resolution photogrammetry
Élodie Brothelande, Jean-François Lénat, A. Normier, C. Bacri, A. Peltier, R.
Paris, K. Kelfoun, O. Merle, Anthony Finizola, E. Garaebiti
To cite this version:
Élodie Brothelande, Jean-François Lénat, A. Normier, C. Bacri, A. Peltier, et al.. Insights into the
evolution of the Yenkahe resurgent dome (Siwi caldera, Tanna Island, Vanuatu) inferred from aerial
high-resolution photogrammetry. Journal of Volcanology and Geothermal Research, Elsevier, 2016,
Understanding volcanoes in the Vanuatu arc, 322, pp.212–224. �10.1016/j.jvolgeores.2015.07.001�.
�hal-01448826�
Insights
into the evolution of the Yenkahe resurgent
dome
(Siwi caldera, Tanna Island, Vanuatu) inferred
from
aerial high-resolution photogrammetry
E.
Brothelande
a,b,⁎
,
J.-F. Lénat
a, A.
Normier
c, C. Bacri
c, A. Peltier
d, R. Paris
a, K.
Kelfoun
a, O. Merle
a,
A.
Finizola
e, E. Garaebiti
faLaboratoire Magmas et Volcans, Université Blaise Pascal — CNRS — IRD, OPGC, 5 rue Kessler, 63038 Clermont Ferrand, France
b Université de Nantes, Nantes Atlantique Universités, Laboratoire de Planétologie et Géodynamique de Nantes, UMR CNRS 6112, 2 rue de la Houssinière, 44322 Nantes, France c O.R.A. (Observer Relever Analyser) association — “Wings for science” project, Maison des associations, 38 boulevard Henri IV, 75004 Paris, France
dObservatoire Volcanologique du Piton de la Fournaise (OVPF), Institut de Physique du Globe de Paris, Sorbonne Paris Cité, CNRS, UMR 7154, Géologie des Systèmes Volcaniques, 14 RN3, le 27ème km,
97418, La Plaine des Cafres, La Réunion, France
eLaboratoire GéoSciences Réunion, Université de la Réunion, Institut de Physique du Globe de Paris, Sorbonne Paris Cité, CNRS UMR 7154,15 avenue René Cassin, CS 92003, 97744 Saint Denis,
cedex 9, La Réunion, France
f Vanuatu Meteorology and Geohazards Department, P.M.B. 9054, Port Vila, Vanuatu
a b s t r a c t
The
Yenkahe dome (Tanna Island, Vanuatu) is one of the most spectacular examples of presently active
post-caldera
resurgence, exhibiting a very high uplift rate over the past 1000 years (156 mm/year on
average).
Although numerous inhabited areas are scattered around the dome, the dynamics of this
structure
and associated hazards remain poorly studied because of its remote location and dense
vegetation
cover. A high-resolution photogrammetric campaign was carried out in November 2011 over
the
dome. Georeferenced photographs were treated by “Structure from Motion” and “Multiple-view
Stereophotogrammetry
” methods to produce a 3D-digital surface model (DSM) of the area and its
associated
orthophotograph. This DSM is much more accurate than previously available SRTM and Aster
digital elevation models (DEMs), particularly at minimal (coastline) and maximal altitudes (Yasur
culmination point, ~390 m). While previous mapping relied mostly on low resolu-tion DEMs and
satellite images, the high precision of the DSM allows for a detailed structural analysis of the Yenkahe
dome, notably based on the quantification of fault displacements. The new structural map, inferred from
the 3D reconstruction and morphological analysis of the dome, reveals a complex pattern of faults and
de-stabilization scars reflecting a succession of constructive and destructive events. Numerous landslide
scars direct-ed toward the sea highlight the probable occurrence of a tsunami event affecting the
south-eastern coast of Tanna. Simulations of landslide-triggered tsunamis show the short time propagation of
such a wave (1–2 min), which could affect coastal localities even following relatively small destabilized
volumes (a few mil-lion cubic meters).
1. Introduction
Vanuatu is a 1200 km-long volcanic arc located in the south-west Pa-cific, resulting from the eastward subduction of the Australian plate be-neath the Pacific plate. In the southern segment of the arc, at the latitude of Tanna, the convergence rate reaches ~ 12 cm/year (direction N69) and the associated back-arc extension rate of the North-Fiji basin, to the east, is ~ 4 cm/year (Pelletier et al., 1998; Calmant et al., 2003). Tanna Island is approximately 2.5 Ma old (oldest rocks are from late
Pliocene;Carney and Macfarlane, 1979) and was constructed by succes-sive phases of volcanism and reef limestone growth. The Siwi Group, to the southeast of the island (Fig. 1A), dated from upper Pleistocene to present, is composed of pyroclastic deposits and associated lavas, mainly andesites to basaltic andesites. A moderate volume eruption (1–2 km3), still undated but estimated to be as young as a few tens of
ka, formed the Siwi caldera and the associated ignimbrite (Nairn et al., 1988; Allen, 2005). The Siwi caldera (N24 km2) is defined on land by a
more or less rectangular ring fracture (Carney and Macfarlane, 1979) and extends offshore between Ipikel (also named Sulphur Bay) and Port Resolution (Fig. 1B).
The Siwi caldera is a remarkable example of caldera unrest as it hosts the rare association between one of the most active volcanoes of the archipelago, Mount Yasur, and the impressive Yenkahe resurgent ⁎ Corresponding author at: Laboratoire Magmas et Volcans, Université Blaise Pascal —
CNRS— IRD, OPGC, 5 rue Kessler, 63038 Clermont Ferrand, France. E-mail address:elodie_brothelande@yahoo.fr(E. Brothelande).
dome. Given the small amount of lava emitted by the Yasur volcano,
Metrich et al. (2011)proposed that the high SO2 degassing rates
(630 t/day on average over the past 5 years, Bani et al., 2012) could be associated with an intrusion rate of 5.107m3/year of basaltic magma
in the Siwi area. Located in the middle of the caldera, and elongated in the same direction (~ N67), the Yenkahe dome is about 5 km long, 3 km wide, and 200–300 m high (Fig. 1B). The Yenkahe dome repre-sents one of the most spectacular examples of presently active post-caldera resurgence. The last uplift occurred during two strong local earthquakes in 1878 (not felt 20 km away,Paton and Paton, 1894), resulting in a 10-meter elevation of the bay of Port Resolution.
230Th/234U dating performed on coral samples from terraces on the
east-ern part of the Yenkahe dome revealed a mean uplift of 156 mm/year over the last 1000 years (Chen et al., 1995). Like other examples of re-surgent domes (e.g. Long Valley,Battaglia et al., 2003; Yellowstone,
Miller and Smith, 1999; Husen et al., 2004), Yenkahe is probably related to shallow magma intrusion processes generating rapid surface defor-mation and possible destabilization of the edifice, as observed for in-stance at Ischia (Tibaldi and Vezzoli, 2004).
The latest structural analysis of the Yenkahe dome was carried out byMerle et al. (2013). Their study principally relied onfield observa-tions, relatively limited by the dense vegetation, satellite images, and existing low-resolution digital elevation models (DEMs) such as SRTM (90-m resolution) and Aster 2nd generation (30-m resolution). They made a clear distinction between the western and eastern parts of the dome. The western dome (Fig. 2A) exhibits a 1-km wide graben delimited by 40 to 60 m-high normal faults in thefield (the Yenkahe North Fault, YNF, and the Yenkahe South Fault, YSF). The graben posi-tion is asymmetrical, with the northernflank of the dome being shorter and steeper than its southern counterpart. The graben is interrupted to the west by the semi-circular ring faults of a small caldera (Paleo-Yasur caldera, ~ 4 km in diameter;Fig. 2A) in which the Yasur cone is now established. Finally, in this western part of the dome, the graben is af-fected by a few westward-dipping transverse normal faults (T1, T2and
T3). The vertical displacement of these faults, probably posterior to the
graben, is not mentioned. The eastern part of the dome, to the east of
T3, exhibits a different pattern. The graben is replaced by a network of
perpendicular longitudinal and transverse normal faults on a relatively flat dome roof (Fig. 2B). Transverse faults are still dipping westward. These differences between the eastern and western fault patterns and the geometry of transverse normal faults ledMerle et al. (2013)to pro-pose a recent uplift of the eastern dome relative to the western dome. Such a process may be explained by the eastward migration of a mag-matic body at depth. Finally, the presence of landslide scars is men-tioned by these authors above Ipikel and coarsely defined on the eastern side of the dome (Fig. 2B).
Recent advances in publicly available high-resolution Google imag-ery allow the mapping of interesting visible features within the caldera (Fig. 1B). Unvegetated areas on the Yenkahe dome itself may be mapped as hydrothermal areas; most of them were visited during a field campaign in 2012 and correspond to hydrothermally altered ground affected by high temperatures (40–100 °C). The density of these areas on the eastern side of the dome reflects a higher hydrother-mal activity level in comparison to the western side.
Other features, such as populated areas in and around the caldera were also mapped, based on the identification of individual and collec-tive buildings (churches, schools). These populated areas (and tourist lodges) are scattered around the dome and along the coast, which makes them vulnerable to direct and indirect consequences of potential landslides. Roads between the airport and the volcano or the south of the island, used by both locals and a great number of tourists each day may also be affected by this type of event. In spite of its relevance in terms of resurgence processes and associated hazards, the Yenkahe dome remains poorly studied because of its remote location and difficult field work conditions (lack of infrastructures, density of vegetation). Unfortunately, further structural research in the area has been limited by currently available digital elevation models (DEMs).
Photogrammetry is a method based on image processing that pro-duces 2D and 3D reconstructions, digital terrain models (DTM), digital surface models (DSM), orthoimages and classification of objects, at relatively low cost in comparison to other methods (Terrestrial Laser Scanner, LIDAR, etc.). This technique is used in a great variety of Fig. 1. (A) The volcanic island of Tanna and the location of the active Siwi caldera (SRTM DEM). (B) Map of the Siwi caldera, on a Google Earth Pro orthoimage, showing the caldera rim, the volcanic edifices, the Yenkahe dome and notable visible features. Structural limits are inferred from the SRTM DEM. Coordinates: UTM 59S–WGS84.
disciplinaryfields (geography, geology, biology, archeology, mining activities, etc.) for mapping, conducting morphological studies or monitoring displacements. Though the“Structure from Motion and Multiple-view Stereophotogrammetry” method (SfM-MVS) is not new, applications to geosciences, and particularly volcanology, are relatively recent (e.g.James and Robson, 2012; James and Varley, 2012; Gomez, 2014). This paper presents another useful contribution of this photo-grammetric method, that of the 3D reconstruction of the Yenkahe resur-gent dome, within the Siwi caldera. Mapping of the topographic variations on the dome can be interpreted in terms of tectonic and col-lapse structures. Volume estimations for the dome itself, as well as for rec-ognized sector collapses were also carried out, as critical parameters to better constrain the growth process and the related hazards in the area.
2. Method
2.1. Aerial photography and ground control points
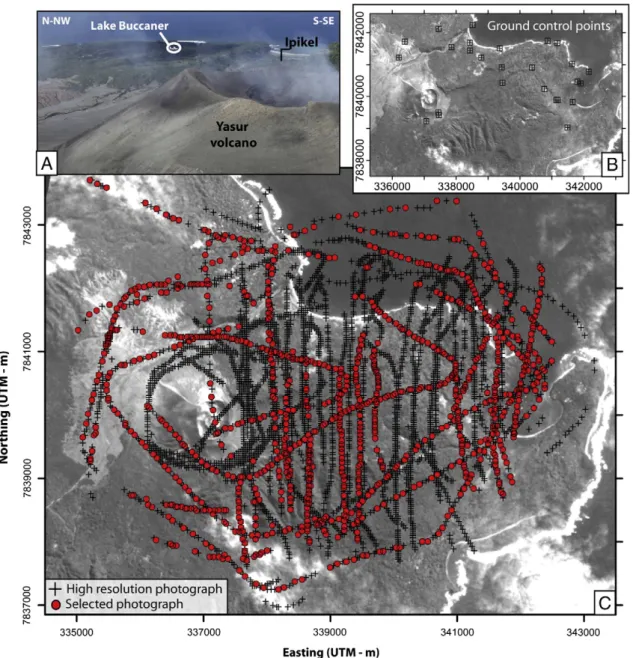
A high resolution photographic campaign was carried out in Novem-ber 2011 over the Yenkahe dome. More than 7000 photographs were taken within a week using a Canon EOS 5D on board a Lake Buccaneer air-craftflying 100–200 m above the topography (Fig. 3A). Different focal depths were used (24–70 mm), but most photographs were taken using a wide angle lens. Each photograph corresponds to 21 million pixels, generally resulting in a ground resolution of a few tens of centime-ters. Camera positions were referenced using a camera-synchronized standard GPS (handheld Garmin Etrex 30) for purposes of 3D Fig. 2. Structural sketch maps of (A) the western and (B) eastern parts of the dome established byMerle et al. (2013).
reconstruction. Aircraft tracks were chosen in order to photograph struc-tures under very variable view angles, in a strategy of“Structure from Mo-tion” photogrammetric processing (James and Robson, 2012; Westoby et al., 2012; Gomez, 2014). In order to calibrate the model elevation, the standard GPS position of 23 visible ground control points were acquired in July 2012, and 4 additional points were chosen on the shoreline with an elevation set to zero (relying on satellite images). The validity of the ground control points measured in 2012 (Fig. 3B) may be questioned, as significant deformation may have occurred on the Yenkahe dome within the intervening eight months. However, an independent differen-tial GPS campaign, involving the repetition of measurements on Yasur and the Yenkahe dome (vegetation-free areas) in August 2011 and July 2012, has shown that displacements were in the order of magnitude of a few centimeters between the two periods. This deformation has no sig-nificant influence on the reconstruction of the structure analyzed here. 2.2. Photogrammetry
Photographs were sorted in order to dismiss the ones acquired under bad weather or low-angle oblique light conditions. A hierarchy
of relevance was assigned to the rest of the set to favor continuous series of overlapping photographs offering a broad coverage of the Yenkahe dome under stable and favorable light conditions. About one thousand georeferenced photographs were chosen to cover the area, favoring a regular mesh and different view angles (Fig. 3C).
3D reconstruction was performed by a“Structure from Motion and Multiple-view Stereophotogrammetry” method (e.g.Fonstad et al., 2013) using the commercial software Agisoft Photoscan 1.0.4© follow-ing a 4-step procedure. First, a great number of points (between 35,000 and 40,000) were identified from the pixel pattern of each pho-tograph. Then, during the alignment phase, the relative geometries of the points were compared on overlapping views in order to adjust the position and view angle for every photograph. The bundle adjustment algorithm used in the Structure-from-Motion method resolves both the 3D geometry of the scene and the camera positions and orientations at the same time. For this purpose, geometrical deformation on the pe-riphery of the photographs was automatically corrected and camera GPS positions facilitated the computation. Initial resolution of tiff photo-graphs (120 Mo) was kept without any degradation, in spite of long computation time, in order to preserve the quality of picture alignment. Fig. 3. (A) Picture of the Lake Buccaneer aircraft during high resolution photography acquisition in November 2011. (B) Ground control points used to calibrate the elevation of the model. (C) Camera locations of the 7000 photographs taken during the campaign, and the 1007 photographs selected for the calculus of the 3D model. Coordinates: UTM 59S–WGS84.
From this, a cloud of points was generated, and densified by the multiple-view algorithm. Point scattering, generally linked to remaining peripheral deformations on photographs, was identified on the criterion of low density of homologous points andfiltered. Finally, a 3D model mesh was computed from the dense point cloud, converted to a grid, and textured from a mosaic of pictures. A one-meter resolution orthophotograph and a two-meter resolution digital surface model (DSM) were produced from the selected set of one thousand high-resolution photographs, offering a 3D reconstruction of the Yenkahe dome and the Siwi caldera, together with georeferencing of visible features.
The point cloud and subsequent 3D model were georeferenced by both camera positions and ground control points. After obtaining the bestfitting spatial referencing by tilting the model and applying homo-geneous deformations, the algorithm returns position errors (several meters to a few tens of meters); low standard-GPS accuracy is, to some extent, compensated by the great number of points (seeFig. 4). The accuracy of the DSM (referred to as Uncorrected Photogrammetric DSM) was assessed by comparing the elevation values of 35 GPS sta-tions located in unvegetated areas of the dome and the Yasur volcano to the elevation given by the independent differential GPS (DGPS) cam-paign carried out in 2011 (Section 2.1). DGPS elevation values were ob-tained by measuring ellipsoidal heights (WGS84) with a 5-cm precision and correcting these values from the geoid height based on the UNAVCO model (http://sps.unavco.org/geoid). Such a comparison was carried out for SRTM and Aster DEMs as well (Fig. 4). The precision of the differ-ent models was estimated through a root mean square error (RMS;
Fig. 4).
The linear relationship between uncorrected photogrammetric DSM elevations and DGPS elevations were used to apply a secondary correction leading to afinal photogrammetric DSM with a maximized accuracy. Accuracy and precision are of course lower and much more heterogeneous outside the dome area, as a consequence of the photo-graph set geometry.
2.3. Volume estimations and tsunami modeling
Volume estimations were performed by calculating the volume dif-ference between thefinal photogrammetric DSM and the DSM obtained by erasing the dome (for dome volume calculation) orfilling the col-lapse scars artificially (for the collapse volume calculations). Lateral limits of these structures were defined by structural analysis. These vol-ume calculations relied on nvol-umerical integration (trapezoidal rule) per-formed with Surfer 10© (Golden software). Considering that vegetation generates a constant elevation offset over the area, no related correction was applied.
The presence of small collapse scars directed toward the sea suggests the possibility of a tsunami generated from the eastern side of the Yenkahe dome. Unfortunately, very little is known about the bathyme-try around the south-east coast of Tanna, as no high-resolution survey has been carried out yet. Such bathymetry data would provide better constraints on the geometry and volume of these collapses offshore and would help in devising well-constrained tsunami scenarios. How-ever, a rough estimate of the propagation time and the wave run-up along the coast can be made based on our current state of knowledge. For this purpose, the low-resolution bathymetry obtained by the EVA (Evolution des Arcs Insulaires) program (Monzier et al., 1984) was linked to the photogrammetric DSM, by a simple kriging and smoothing process. Constraints on the area of Port-Resolution bay were deduced from current boat anchorage at a maximum depth of 5 to 7 m. In order to estimate the wave amplitudes and the propagation of a tsuna-mi generated by a potential collapse, simulations were performed using the two-fluid numerical model Volcflow. This code simulates both land-slide motion and water surface displacement using the general shallow water equations of mass conservation and momentum balance. Debris and water are treated as two separatefluids (no-mixing) with a con-stant density over time (2000 and 1000 kg/m3, respectively). Debris
density is reduced when the landslide is in the water. Details about the Volcflow code and other application examples may be found in
Kelfoun et al. (2010)andGiachetti et al. (2011). 3. Results and interpretation
Fig. 4compares the elevation given by the uncorrected photogram-metric DSM (seeSection 2.2) and the two regional DEMs (90-m resolu-tion SRTM and 30-m resoluresolu-tion Aster) to the elevaresolu-tion given by a DGPS campaign in 35 stations. These stations are located in areas free of veg-etation on the Yenkahe dome (hydrothermal areas) and on the Yasur volcano; their locations are given inFig. 5A. The linear correlations be-tween DSM/DEMs and DGPS elevations gives an idea of the accuracy of the models (perfect accuracy being represented by a linearfit equa-tion y = x). The precision of models may be estimated qualitatively from point scattering relative to the linearfit, and quantitatively by a root mean square error (RMS) calculated between real values and the fit. On both accuracy and precision aspects, the uncorrected photogram-metric DSM appears to be the best model (Fig. 4), with typical errors of 2–3 m compared to DGPS.
The uncorrected DSM was then corrected from the linearfit equa-tion to obtain afinal photogrammetric DSM. This DSM is compared to SRTM and ASTER DEMs onFigs. 5A–C. Culminating points are indicated on the three models (392 m, 373 m and 371 m, respectively). All models agree on the (x, y) location of the point but the DSM and DEMs exhibit a
Fig. 4. Comparison of elevations given by models (uncorrected photogrammetric DSM, SRTM and Aster DTM) to elevations acquired by DGPS at 35 stations (seeFig. 5A for locations). The best linearfit and the root mean square error (RMS) characterizing scattering from this fit are given in each case.
20-m elevation discrepancy. However, the Photogrammetric DSM is consistent with the maximum elevation given by the latest topo-graphic survey of the area, which is 391 m (Vanuatu, 1:50000, 2007— Topographic map of Port Resolution, Vanuatu— 1916911 — X721 — Edition 1-VDLS). Elevations along the coastline (Fig. 5A–C), defined from orthoimages (photogrammetric and Google imagery), were ex-tracted from the three models for comparison. These elevations should be close to zero in an ideal model, but steep topographic slopes along
the shore may generate errors. The three histograms of elevation values are given inFig. 5D, showing that errors are much lower (b10 m) in the photogrammetric DSM. We may conclude that this DSM is much better constrained and more reliable for minimal and maximal elevations in comparison to SRTM and Aster DEMs.
Elevation variations were compared along a transverse profile P for the three models (Fig. 5E). While being consistent with smooth topo-graphic variations given by SRTM and Aster DEMs, the Photogrammetric Fig. 5. (A) Final photogrammetric DSM (corrected from linearfit). (B) SRTM DEM. (C) Aster DEM. Lighting from N315, tilt 45°. Coordinates: UTM 59S–WGS84. The coast line (inferred from orthoimages) and a transverse profile P are indicated in red and black, respectively. DGPS stations are indicated in figure A. (D) Histograms of elevations along the coastline for the three models. (E) Surface elevation variations along profile P for the three models.
Fig. 6. (A) Contour map, (B) slope map, and maps offirst derivatives along (C) the longitudinal direction N67 and (D) the transverse direction N137 (D). (E) Structural sketch map of the Yenkahe dome. Unbroken line with open triangular teeth indicates the dome. Block symbols indicate the downthrown side for normal and ring faults,filled triangular teeth indicate the downthrown side of collapse and slumping scars. YNF: Yenkahe North Fault. YSF: Yenkahe South Fault. SF: Somma Fault. MS: Major slumping. T1 and T2: major transversal faults. Inset: Rose diagrams representing the orientation of longitudinal and transverse normal faults. Coordinates: UTM 59S–WGS84.
DSM profile exhibits a much better precision. The complete elevation map of the DSM can be found in Fig. A.1 (Appendix A— Supplementary online material). Apart fromb15 m-irregularities, surface variations of the DSM reflect real topographic variations. Such an approximation is based on the hypothesis of a globally homogeneous thickness of the veg-etation cover. Such an assumption appears reasonable given our obser-vations from aerial photographs and in thefield (concerning both vegetation cover and topographic variations).
Topographic steps characterized by asymmetrical steep slopes may then be interpreted in terms of faults or collapse scars (Figs. 5E,6), espe-cially when they represent continuous lineaments over several hun-dreds to thousands of meters on the map. Such lineaments may be demonstrated by the slope map of the area and apparent dip directions may be inferred from longitudinal (N67, dome direction) and transver-sal (N337, perpendicular) surface derivatives of elevation in the area (Fig. 6B–D). Below, the vertical displacement along interpreted faults will be estimated from the geomorphological vertical separation of faulted blocks. This apparent displacement does not take into account the possible effect of events subsequent to faulting (erosion, etc.).
Analogue models of resurgent domes show the development of a de-pression on top of the dome along the growth, which generally takes the form of a longitudinal graben in nature (Acocella et al., 2001; Brothelande and Merle, 2015). Linear longitudinal features affecting the dome were thus interpreted in terms of normal faults forming a lon-gitudinal graben (Fig. 6E). Three categories were distinguished as a function of fault offset determined from the DSM. The Yenkahe North fault (YNF) and Yenkahe South fault (YSF) qualify as major faults with an apparent vertical displacement of 50 m over a significant portion of their length. The displacement actually reaches 93 m for the YNF, and 57 m for the YSF. The majority of faults on the dome fall into the catego-ry of moderate faults, with an apparent vertical displacement of be-tween 10 and 50 m. Lastly, minor faults indicated in dashed lines on
Fig. 6E are characterized by vertical displacements of less than 10 m. As noted byMerle et al. (2013), the graben is not symmetrical, which is confirmed by the fact that the vertical displacement of southward dip-ping faults (YNF and others) is generally greater than that exhibited by northward dipping faults (Figs. 5E,6E). The master faults of the graben vanish toward the east, adopting a curved shape, resulting in aflared shape for the central part of the graben. However, the graben itself does not vanish as it is still defined by moderate longitudinal faults until the eastern dome end. This graben continuity is notably easier to observe on 3D views, such asFig. 7. Though most longitudinal faults ex-hibit a N70 trend, some segments are oriented ~N33, so that the graben seems slightly bent in its central part (Figs. 6E,7).
A second set of linear faults, with apparent normal kinematics, de-veloped perpendicularly to the dome axis (Fig. 6E). This transversal ex-tension affects the top of the dome, resulting in a perpendicular fault pattern within the graben, as well as on the domeflanks. In contrast to the longitudinal extension, this extension is highly asymmetrical, with 80% of the transverse faults dipping toward the WSW. In terms of chronology, the longitudinal faults tend to exhibit a smaller vertical displacement, or even disappear when crossing transversal faults, espe-cially on the western part of the dome (around T1 and T2, seeFig. 6E). Therefore, the transverse faults appear to be more recent. However, this chronology is not perfectly clear and the two sets of faults may have been activated alternately.
Ring faults can be identified (curved shape, delimiting a flat area) on the border of the Siwi caldera, and on the western part of the dome, curved around the Yasur cone (Figs. 6E,8). A classification of ring faults based on the offset was adopted in a similar way to linear normal faults. In spite of the lower precision characterizing the periphery of the dome, the Siwi caldera ring fault is well identified on the photogrammetric DSM, and its location shows a perfect consistency with the previous mapping inferred from the low resolution SRTM DEM and satellite
Fig. 7. View of the‘landscape’ of the Yenkahe dome and Yasur volcano (photogrammetric orthophotograph wrapped on the photogrammetric DSM). View from the ENE (N80, 30° tilt), Z factor = 1. Some of the dome striking features are indicated in white.
images shown inFig. 1. The north-eastern portion of the Siwi ring frac-ture is very well defined, and the apparent vertical displacement reaches 80 m. Since the lower part of the fault is occupied by the Siwi River, the contribution of vegetation should be removed, and the maxi-mum vertical displacement is reduced to approximately 70 m. In con-trast, in the southern portion of the fault, the vertical displacement remains around 10–20 m. Nonetheless, part of the southern displace-ment might be hidden by eruptive products from the Ombus cone. Around the Yasur cone, ring faults have been identified since the pioneering work byCarney and Macfarlane (1979), defining the small Paleo-Yasur caldera (less than 2 km in diameter). The collapse of the southern portion was accommodated by two concentric faults of ap-proximately 20 m and 10 m in vertical displacement (Figs. 6E and8). The outer ring fault is bordered by a hydrothermal area, suggesting that this fault may be a guide for hydrothermal circulation. This fault in-terrupts a more or less radial system of erosional gullies that can be identified by symmetrical slopes (Fig. 6B) characterizing an old edifice. This old edifice (Figs. 6E, 7, 8) is associated with high elevations (N300 m;Fig. 6A; Fig. A.1 of Appendix A— Supplementary online mate-rial). To the north-east, the collapse has been accommodated by the sin-gle Somma fault, with a vertical displacement reaching 40 m. Minor linear normal faults (a few meters displacement;Fig. 8) are observed within the Paleo-Yasur caldera, in the extension of the resurgent dome graben, as noted byPeltier et al. (2012).
The eastern border of the dome reveals the presence of numerous horseshoe-shaped structures, interpreted as collapse scars (Figs. 6E,7). These scars intersect one another, indicating multiple small amplitude destabilization episodes toward the east, the north-east and the south-east. The shape of the coast itself, indented with small bays, suggests that it has probably been affected by several even larger collapses. Addi-tionally, a large scar (MS;Fig. 6E) seems to affect nearly a third of the dome. Almost continuously defined, and locally highlighted by parallel scars, this structure is characterized by a relative drop of the eastern block by up to 20–30 m. This scar most probably represents large-scale, maybe slowly ongoing, destabilization. Other destabilization scars are present on the northernflank of the dome where they tend to be more linear (and parallel to the graben andflank systems). Their identification as scars (and not faults) is based on their location on potentially unstable slopes (higher portion of theflank) and the northward-directed sluggish shape of the domeflank below (Fig. 6E). The precision of structural map-ping over the dome is naturally limited byb10 m irregularities in the can-opy surface. In contrast, high-resolution photogrammetry provides a much higher precision in the Yasur area (apart from the inside of the cra-ter). Deposits from repeated instabilities (1975 and 1919 landslides;
Fig. 8) can be observed, characterizing ash cone landslides toward the north and west over the Siwi calderafloor. To the south and the east, the Yasur cone lies on the Yenkahe dome (affected by the Paleo-Yasur caldera) and on the relicts of an old tephra cone named the Paleo-Yasur Fig. 8. Structural sketch map of the Yasur area. Fault symbols are similar to the ones used inFig. 6. YNF: Yenkahe North Fault. YSF: Yenkahe South Fault. SF: Somma Fault. L1, L2 and L3: minor faults in the continuation of the Yenkahe graben. Coordinates: UTM 59S–WGS84.
cone. The south of the cone is indented by afield of recent lavas probably emplaced from a basal fracture or vent (proposed byNairn et al., 1988). To the south of this lavafield, a morphological unit located inside the Paleo-Yasur caldera, concentrates hydrothermal areas (Fig. 8). Outcrops along the pathway up to the volcano suggest that this unit may be a very altered scoria cone, perhaps similar to the Paleo-Yasur cone. Recent lavas were emplaced between these two relicts.
4. Discussion
The high-resolution DSM draws a large panel of information that can be used for a variety of purposes, including a better understanding of the dome formation mechanisms and a clearer assessment of the related risks.
4.1. Fault patterns and dome dynamics
Unlike satellite images, 3D-reconstitutions allow for an unambigu-ous determination of relative movements of blocks, and the quanti fica-tion of fault displacements. With a northern offset approximately six times greater than the southern one, the morphology of the Siwi caldera ring fault exhibits a strong north–south asymmetry (Fig. 6E). This asym-metry evokes a trapdoor forming process (Lipman, 1997). The caldera fault delimits a relativelyflat caldera floor. The dome rises from this flat floor with slopes of up to 40–50° to the north and 15–30° to the south. The confined nature of deformation within the caldera suggests the implication of faults in the resurgent process. Indeed, the study of old eroded systems (e.g. Grizzly Peak caldera,Fridrich et al., 1991; Chegem caldera,Gazis et al., 1995) as well as analogue models (e.g.
Acocella et al., 2001) show that resurgent domes are limited by reverse faults. The intersection of such faults with the topographic surface prob-ably constitutes the dome borders defined onFig. 6E.
The top of the dome is occupied by linear longitudinal faults forming a slightly curved axial graben (Fig. 6E). This graben most probably re-flects the surface extension related to the dome formation. It can be con-sidered as a primary structure but may continue to extend while dome growth is ongoing. Contrary to thefirst observations carried out by
Merle et al. (2013), we argue that the graben may be considered as al-most longitudinally continuous (Fig. 7), as observed in analogue models of doming related to elongated intrusions (Brothelande and Merle, 2015). As noted byMerle et al. (2013), this graben, as well as the whole dome, is affected by a NS asymmetry, which may reflect a trap-door growing process.
Transverse normal faults present all along the dome are most likely subsequent to the graben formation, or operate alternately. The great ma-jority of westward dipping faults (80%) confirms the observation ofMerle et al. (2013), and subsequent hypotheses of a relatively recent uplift of the eastern dome side relative to the western side. Hydrothermal areas on top of the dome mapped from orthoimages are much more numerous on the eastern dome showing its high level of activity (Fig. 1). Precise mapping and quantification inferred from photogrammetry thus confirm most of their general observations. Yet, the history of the dome should also take into account the numerous collapses newly demonstrated by the photo-grammetric DSM (seeSection 4.3). Related collapse scars notably render the eastern dome's structural pattern very complex.
Even if the nature of the deformation source is not known (probably magmatic;Nairn et al., 1988), its total volume may be approximated, based on the assumption that it corresponds more or less to the volume of the dome raised above the Siwi calderafloor. An estimation made from the digital surface model gives a volume of ca. 2.2 km3for the whole subaerial edifice constituted by the Yenkahe dome and the ad-ventive ash cones (Yasur and Ombus). Removing the contribution of both cones, this estimation can be refined to ca. 2.1 km3
, although this value does not take into account the quantity of material lost during col-lapse events.
4.2. Morphology of the Yasur and former edifices
The Yasur cone is built from the ash expelled during explosions currently occurring every few minutes. Its asymmetric edification (Fig. 8) is due to both its location on the western edge of the dome and to the north-westward direction of the dominant winds carrying the ash. Such a construction becomes unstable when it reaches a critic-al slope of approximately 30°. Landslide scars and deposits on the northern (1975) and the western (1919)flanks of the cone suggest that these small events may occur every few decades, if the ash emis-sion rate remains comparable to the current one. The northern flank, with slopes of more than 30° (31–32°), appears to be the most un-stable, threatening road users passing close to the volcano. Indeed, the lower parts of the northern and western slopes host the route for the ve-hicles carrying the tourists from the airport to the volcano every day (Fig. 8).
On the summit area, the presence of ash clouds on many photo-graphs, and the deviation of light rays by high temperatures make the 3D reconstitution of the crater rather delicate. However, we be-lieve that the general geometry remains valid, as it is consistent with observations from the 2012field campaign. Comparison with the Yasur crater morphology records shows that the shape of the main crater rim has been stable over the past decades (Fig. 9). Inside the crater, the vent configuration is relevant in terms of dynamics and orientation of the explosions, and should be taken into account for the protection of tourists enjoying the Yasur explosions from the crater rim every night. Multiple vents, in different pit-craters, have always existed, and their morphology has continued to change rapidly (Fig. 9). In 1986,Nairn et al. (1988)reported the presence of three aligned vents (A, B, C), two of which (A and C) were located in two pit-craters. In 1991,five vents were identified (A, B, B′, B″, C), lo-cated in two large pit-craters (GVN, 1991). Between 1996 and 1998, the number of vents changed from four to two as the sub-crater ge-ometry was reorganized. Significant changes even happened on much shorter timescales. In 1997, S. O'Meara and R. Benward report-ed the merging of the two central vents of the southern crater into a single one within 24 h (GVN, 1997a). In 2011, three vents were ac-tive: A and B located in the southern pit-crater, and C centered in the northern one (Fig. 9). A small lineament, going from the northern pit-crater toward the south-west, is probably inherited from former pit-crater geometry. The shape of the northern pit-crater shows a collapse scar, highlighting the possibility of inward collapses affect-ing the rim. Outside the crater rim, scars can be observed, and were pointed out byPeltier et al. (2012)as being hydrothermally active. The northern one might have formed very recently as it is not present in the 1986, 1991, and 1996 sketch maps. The origin of these scars is un-clear; they might result from explosive or from collapse events.
The DSM of the Yasur volcano has demonstrated the possibility of collapses affecting both the cone slopes and the crater rim. These desta-bilizations are small in volume, but they might constitute a real threat for the tens to hundreds of tourists visiting the volcano every day, in ad-dition to the risks directly related to explosions.
To the south and east, the Yasur volcano lies on pre-existing edifices (Figs. 7, 8). Around the cone, ring faults delimit the Paleo-Yasur caldera, less than 2 km in diameter, and with a 30 to 40 m total offset. This cal-dera affects an old edifice, inferred from erosional features, and is interrupted to the west. The reason for this interruption is unclear, such as the nature (resurgent or eruptive) of the old edifice. The west-ern border of the caldera is occupied by two morphological units iden-tified as being tephra cone relicts (Fig. 8). These two relicts might be inherited from the same cone and might have been separated later by a destabilization event. In any case, recent lavas erupted from the base of the Yasur would cover such destabilization deposits. The complex morphology around the Yasur volcano reveals that the recent cone lies on top of a composite edifice that most probably resulted from a succes-sion of constructive and destructive phases.
4.3. Instabilities of the Yenkahe dome
A great number of collapse scars have been identified on the dome (Fig. 6E). Scars can be observed up on the northernflank of the dome, and related to slug-shaped features at the base. The high level of hydro-thermal circulation within theflanks (Fig. 1) are likely to favor destabi-lization processes. Potential landslides therefore constitute a major threat for the Ipikel locality and for the scattered inhabitants along the Siwi River (Fig. 1). The absence of similar structures on the southern flank may be attributed to less steep slopes, and to the buttressing effect of the Ombus edifice.
At the eastern termination of the dome, the DSM reveals multiple intersecting collapse scars represented by more or less horseshoe-shaped structures oriented toward the sea (Fig. 6E). These small collapses are recent, as they affect the recently emerged eastern parts of the dome (Chen et al., 1995; Merle et al., 2013). Almost no faults are visible inside these collapses. Curiously, these scars exhibit a strongly curved geometry resulting in a more or lessflat floor (instead of dipping toward the east). This might be a consequence of the recent uplift of the eastern dome (tilting structures). Up on the dome, a much larger-scale scar (MS,
Fig. 6E) seems to be related to a destabilization of almost one-third of the dome toward the east. Whereas small recent landslides are favored by steep slopes and high erosion rates on the coast, large-scale gravita-tional instabilities are more commonly attributed to low-competency al-tered material. Such slow destabilization might have taken place from the beginning of dome formation. Indeed, this might explain the curved-shaped of the graben master faults in the central part of the graben.
Volume estimations of collapses related to small eastern scars give orders of magnitudes of a few millions of cubic meters for each event.
The direction of the small collapses towards the sea suggests the possi-bility of a tsunami generated from the east of the Yenkahe dome. Such a tsunami would constitute a major threat to the main localities and the numerous tourist lodges located along the coast.
In order to get a rough estimate of the time propagation and wave run-up associated with one of these landslides, we conducted Volcflow simulations. For instance, the landslide considered inFig. 10 corre-sponds to a volume of 8·106m3. To counter the effect of theflat floor
of these small collapses, and obtain the collapse of the entire volume, a low frictional retarding stress (20 kPa) was applied. Simulation results reveal that such a collapse event would generate a tsunami reaching the coast facing Port Resolution and Ipikel in 75 and 90 s, respectively (Fig. 10). The maximum run up of 4 m would not affect the center of Port Resolution, which is located more than 10 m above sea level, but the impact on coastal activities would not be negligible, notably in the frequented Port-Resolution bay. In contrast, a 3 m-high wave could have serious consequences on the coastal part of Ipikel, which is located only 1 to 2 m above sea level. Indeed, traditional housing, mainly made of local materials (wood and leaves) supplemented by cheap construct-ing materials (sheet metal, etc.), appears to be relatively vulnerable to any kind of natural disaster. Other touristic structures further along the coast may be affected as well. Even the smallest landslides affecting the east of the dome may have dramatic consequences for the inhabi-tants and the tourist activity developing all along the coast.
We want to stress the point that this result should not be regarded as a plausible scenario, but as a possible order of magnitude for such an event. To compare with recent events, the 2002 landslide in Stromboli was in the order of magnitude of ten million cubic meters in volume and caused a run up of 10 m along the coast of the island (Bonaccorso
Fig. 10. Simulation of a landslide-generated tsunami on the eastern part of the Yenkahe dome. (A) and (B) Reconstructed topography before (simulated) and after (current) a collapse of about 8·106
m3
. Contour lines are shown every 50 m. (C) Wave amplitudes at t = 80 s. The shaded area represents the submarine deposits and the internal white contours indicate de-posits thicker than 10 m. Coordinates: UTM 59S–WGS84. (D) and (E) Wave profiles at locations 1, near Ipikel (Ipi on C), and 2, near Port Resolution (PR on C), respectively.
Fig. 9. Sketch maps and photographs showing the Yasur crater and subcrater morphology in 1986 (sketch mapNairn et al., 1988), 1991 (sketch map G. GrangerGVN, 1991), 1996 (sketch map H. GaudruGVN, 1996), 1997 (sketch A. MabonlalaGVN, 1997b), 1998 (sketch A. MabonlalaGVN, 1999), 2001 (photograph M. LardyGVN, 2002), 2004 (photograph M. LardyGVN, 2004) and 2011. Coordinates: UTM 59S–WGS84.
et al., 2003). In 1999, 2- to 5-m high sea waves striking the shore of Omoa Bay (Marquesas Islands, French Polynesia) were the probable re-sult of the collapse of 2.4 million cubic meters of material 5 km away, whose effect was amplified by local bathymetry (Hébert et al., 2002). Improved bathymetric resolution along the south-east shore of Tanna is necessary for increasing our understanding of these collapse features, and thus initiating hazard assessment of collapse-related tsunamis in the area.
5. Conclusions
Through 3D reconstruction of topography, high-resolution photo-grammetry provides very useful information (quantitative, accurate and precise) for the structural analysis of volcanic edifices at a relatively low capital and logistical cost. North–south asymmetry of the caldera and the dome suggests an asymmetric source, and a trapdoor process for both the caldera collapse and the dome resurgence. The pattern resulting from the high-resolution mapping of faults and landslide scars reveals a complex history. The two perpendicular sets of linear faults probably reflect a two-phase history for the deformation at depth, involving the growth of an elongated dome followed by an east-ward migration of the deformation source as suggested by previous au-thors. On the western side of the dome, the Yasur volcano lies on a composite volcanic edifice. Lastly, the present study highlights a great number of recent collapses, affecting the fast growing dome and the ac-tive volcano area. These events, which appear to be relaac-tively frequent, directly or indirectly (via tsunamis) threaten the population of the Siwi caldera, the tourists and consequently the economy of the whole island. Supplementary data to this article can be found online athttp://dx. doi.org/10.1016/j.jvolgeores.2015.04.006.
Acknowledgments
We thank the inhabitants of the Yasur area for their help in thefield. Morris Harrison, Jason Andrews, David Nakedau and Sandrine Cevuard from the Vanuatu Meteorology and Geohazards Department have been of great help infield work organization and carrying out in 2011 and 2012. We are grateful to the anonymous reviewers who helped im-prove this manuscript. This research wasfinanced by the French Government Laboratory of Excellence initiative no. ANR-10-LABX-0006, the Région Auvergne, the European Regional Development Fund and O.R.A. association. This is Laboratory of Excellence Clervolc contri-bution no. 145 and IPGP contricontri-bution no. 3629.
References
Acocella, V., Cifelli, F., Funiciello, R., 2001. The control of overburden thickness on resur-gent domes: insights from analogue models. J. Volcanol. Geotherm. Res. 111, 137–153.http://dx.doi.org/10.1016/S0377-0273(01)00224-4.
Allen, S.R., 2005. Complex spatter- and pumice-rich pyroclastic deposits from an andesitic caldera-forming eruption: the Siwi pyroclastic sequence, Tanna, Vanuatu. Bull. Volcanol. 67, 27–41.http://dx.doi.org/10.1007/s00445-004-0358-6.
Bani, P., Oppenheimer, C., Allard, P., Shinohara, H., Tsanev, V., Carn, S., Lardy, M., Garaebiti, E., 2012. First estimate of volcanic SO2budget for Vanuatu island arc. J. Volcanol.
Geotherm. Res. 211–212, 36–46.http://dx.doi.org/10.1016/j.jvolgeores.2011.10.005. Battaglia, M., Segall, P., Roberts, C., 2003. The mechanics of unrest at Long Valley caldera,
California. 2. Constraining the nature of the source using geodetic and micro-gravity data. J. Volcanol. Geotherm. Res. 127, 219–245. http://dx.doi.org/10.1016/S0377-0273(03)00171-9.
Bonaccorso, A., Calvari, S., Garfí, G., Lodato, L., Patanè, D., 2003. Dynamics of the December 2002flank failure and tsunami at Stromboli volcano inferred by volcanological and geophysical observations. Geophys. Res. Lett. 30, 1941.http://dx.doi.org/10.1029/ 2003GL017702.
Brothelande, E., Merle, O., 2015.Estimation of magma depth for resurgent domes: an experimental approach. Earth Planet. Sci. Lett. 412, 143–151.
Calmant, S., Pelletier, B., Lebellegard, P., Bevis, M., Taylor, F.W., Philips, D.A., 2003. New insights on the tectonics along the New Hebrides subduction zone based on GPS results. J. Geophys. Res. 108, 1–22.http://dx.doi.org/10.1029/2001JB000644. Carney, J., Macfarlane, A., 1979.Geology of Tanna, Aneityum, Futuna and Aniwa. New
Hebrides Gov. Geol. Surv. Rep. 5–29.
Chen, J.K., Taylor, F.W., Edwards, R., Cheng, H., Burr, G., 1995.Recent emerged reef terraces of the Yenkahe resurgent block, Tanna, Vanuatu— implications for volcanic landslide and tsunami hazards. J. Geol. 103, 577–590.
Fonstad, M.A., Dietrich, J.T., Courville, B.C., Jensen, J.L., Carbonneau, P.E., 2013. Topographic structure from motion: a new development in photogrammetric measurement. Earth Surf. Process. Landf. 38, 421–430.http://dx.doi.org/10.1002/esp.3366.
Fridrich, C.J., Smith, R.P., Dewitt, E., Mckee, E.H., 1991. Structural, eruptive, and intrusive evolution of the Grizzly Peak caldera, Sawatch Range, Colorado. Geol. Soc. Am. Bull. 103, 1160–1177.http://dx.doi.org/10.1130/0016-7606(1991)103.
Gazis, C.A., Lanphere, M., Taylor, H.P., Gurbanov, A., 1995. 40Ar/39Ar and 18O/16O studies of the Chegem ash-flow caldera and the Eldjurta granite: cooling of two late Pliocene igneous bodies in the Greater Caucasus Mountains, Russia. Earth Planet. Sci. Lett. 134, 377–391.http://dx.doi.org/10.1016/0012-821X(95)00141-X.
Giachetti, T., Paris, R., Kelfoun, K., Pérez-Torrado, F.J., 2011. Numerical modelling of the tsunami triggered by the Güìmar debris avalanche, Tenerife (Canary Islands): comparison withfield-based data. Mar. Geol. 284, 189–202.http://dx.doi.org/10. 1016/j.margeo.2011.03.018.
Gomez, C., 2014. Digital photogrammetry and GIS-based analysis of the bio-geomorphological evolution of Sakurajima Volcano, diachronic analysis from 1947 to 2006. J. Volcanol. Geotherm. Res. 280, 1–13.http://dx.doi.org/10.1016/j.jvolgeores. 2014.04.015.
GVN, 1991.Bulletin of the Global Volcanism Network. vol. 16, No 11. Smithsonian Institution, Washington D.C.
GVN, 1996.Bulletin of the Global Volcanism Network. vol. 21, No 9. Smithsonian Institution, Washington D.C.
GVN, 1997a.Bulletin of the Global Volcanism Network. vol. 22, No 11. Smithsonian Institution, Washington D.C.
GVN, 1997b.Bulletin of the Global Volcanism Network. vol. 22, No 8. Smithsonian Institution, Washington D.C.
GVN, 1999.Bulletin of the Global Volcanism Network. vol. 24, No 4. Smithsonian Institution, Washington D.C.
GVN, 2002.Bulletin of the Global Volcanism Network. vol. 27, No 1. Smithsonian Institution, Washington D.C.
GVN, 2004.Bulletin of the Global Volcanism Network. vol. 29, No 7. Smithsonian Institution, Washington D.C.
Hébert, H., Piatanesi, A., Heinrich, P., Schindelé, F., Okal,, E.a., 2002. Numerical modeling of the September 13, 1999 landslide and tsunami on Fatu Hiva Island (French Polynesia). Geophys. Res. Lett. 29, 122-1–122-4.http://dx.doi.org/10. 1029/2001GL013774.
Husen, S., Smith, R.B., Waite, G.P., 2004. Evidence for gas and magmatic sources beneath the Yellowstone volcanicfield from seismic tomographic imaging. J. Volcanol. Geotherm. Res. 131, 397–410.http://dx.doi.org/10.1016/S0377-0273(03)00416-5. James, M.R., Robson, S., 2012. Straightforward reconstruction of 3D surfaces and
topogra-phy with a camera: accuracy and geoscience application. J. Geotopogra-phys. Res. 117, F03017.http://dx.doi.org/10.1029/2011JF002289.
James, M.R., Varley, N., 2012. Identification of structural controls in an active lava dome with high resolution DEMs: Volcán de Colima, Mexico. Geophys. Res. Lett. 39 (22). http://dx.doi.org/10.1029/2012GL054245.
Kelfoun, K., Giachetti, T., Labazuy, P., 2010. Landslide-generated tsunamis at Réunion Is-land. J. Geophys. Res. 115, F04012.http://dx.doi.org/10.1029/2009JF001381. Lipman, P.W., 1997. Subsidence of ash-flow calderas: relation to caldera size and
magma-chamber geometry. Bull. Volcanol. 59, 198–218. http://dx.doi.org/10.1007/ s004450050186.
Merle, O., Brothelande, E., Lénat, J.-F., Bachèlery, P., Garaébiti, E., 2013. A structural outline of the Yenkahe volcanic resurgent dome (Tanna Island, Vanuatu Arc, South Pacific). J. Volcanol. Geotherm. Res. 268, 64–72.http://dx.doi.org/10.1016/j.jvolgeores.2013. 10.009.
Metrich, N., Allard, P., Aiuppa, A., Bani, P., Bertagnini, A., Shinohara, H., Parello, F., Di Muro, A., Garaebiti, E., Belhadj, O., Massare, D., 2011. Magma and volatile supply to post-collapse volcanism and block resurgence in Siwi Caldera (Tanna Island, Vanuatu Arc). J. Petrol. 52, 1077–1105.http://dx.doi.org/10.1093/petrology/egr019. Miller, D.S., Smith, R.B., 1999.P and S velocity structure of the Yellowstone volcanicfield
from local earthquake and controlled‐source tomography. J. Geophys. Res. Solid Earth 104, 15105–15121.
Monzier, M., Collot, J.Y., Daniel, J., 1984.Carte bathymétrique des parties central et méridionale de l'arc insulaire des Nouvelles Hébrides. Office de la Recherche Scientifique et Technique Outre-Mer (ORSTOM), Paris.
Nairn, A., Scott, B.J., Giggenbach, W.F., 1988.Yasur volcano investigations, Vanuatu, September 1988. New Zeal. Geol. Surv. Rep. G136 (74 pp).
Paton, M.W., Paton, J., 1894.Letters and Sketches From the New Hebrides. London Hodder and Stoughton.
Pelletier, B., Calmant, S., Pillet, R., 1998.Current tectonics of the Tonga–New Hebrides re-gion. Earth Planet. Sci. Lett. 164, 263–276.
Peltier, A., Finizola, A., Douillet, G.A., Brothelande, E., Garaebiti, E., 2012. Structure of an ac-tive volcano associated with a resurgent block inferred from thermal mapping: the Yasur–Yenkahe volcanic complex (Vanuatu). J. Volcanol. Geotherm. Res. 243–244, 59–68.http://dx.doi.org/10.1016/j.jvolgeores.2012.06.022.
Tibaldi, A., Vezzoli, L., 2004. A new type of volcanoflank failure: the resurgent caldera sec-tor collapse, Ischia, Italy. Geophys. Res. Lett. 31 (14).http://dx.doi.org/10.1029/ 2004GL020419.
Westoby, M.J., Brasington, J., Glasser, N.F., Hambrey, M.J., Reynolds, J.M., 2012. “Structure-from-Motion” photogrammetry: a low-cost, effective tool for geoscience applications. Geomorphology 179, 300–314.http://dx.doi.org/10.1016/j.geomorph.2012.08.021.