HAL Id: tel-01356741
https://tel.archives-ouvertes.fr/tel-01356741
Submitted on 26 Aug 2016HAL is a multi-disciplinary open access
archive for the deposit and dissemination of sci-entific research documents, whether they are pub-lished or not. The documents may come from teaching and research institutions in France or abroad, or from public or private research centers.
L’archive ouverte pluridisciplinaire HAL, est destinée au dépôt et à la diffusion de documents scientifiques de niveau recherche, publiés ou non, émanant des établissements d’enseignement et de recherche français ou étrangers, des laboratoires publics ou privés.
mechanisms against pathogens
Juliana Iglesias
To cite this version:
Juliana Iglesias. Functional analysis of CYP76C2 in plant defense mechanisms against pathogens. Plants genetics. Université de Strasbourg, 2015. English. �NNT : 2015STRAJ024�. �tel-01356741�
i
UNIVERSITÉ DE STRASBOURG
ÉCOLE DOCTORALE SCIENCES DE LA VIE ET LA SANTÉ (ED 414)
INSTITUTE DE BIOLOGIE MOLÉCULAIRE DES PLANTES ( CNRS-UPR 2357)
THÈSE
présentée par :Juliana IGLESIAS
Pour obtenir le grade de :
Docteur de luniversité de Strasbourg
Spécialité: Aspects moléculaires et cellulaires de la biologie
Analyse fonctionnelle du rôle de CYP76C2
dans les mécanismes de défense des
plantes contre les agents pathogènes
Soutenue le 17 Juin 2015 à Strasbourg devant le jury composé de :
Dr. WERCK Danièle IBMP-CNRS Directrice de thèse Dr. SAINDRENAN Patrick IBP-CNRS Rapporteur externe Dr. FERNANDEZ Diana IRD-CIRAD-UM2 Rapporteur externe Dr. HUGUENEY Philippe INRA Colmar Examinateur interne
ii CONTRE LES AGENTS PATHOGENES
Une analyse du transcriptome dArabidopsis thaliana soumis à différents stress biotiques a révélé lactivation de certains membres de la famille CYP76, particulièrement celle de CYP76C2 ( 50 fois). La caractérisation fonctionnelle de la famille CYP76, et plus particulièrement celle de CYP76C2 a donc fait lobjet de cette thèse. Après confirmation de lactivation sélective de CYP76C2 en réponse aux pathogènes par qRT-PCR, le phénotype de ses mutants dinsertion et de surexpression a été caractérisé sous différentes conditions dinfection par: Pseudomonas syringae pv. tomato DC3000, P. syringae pv. tomato DC3000 avrRpm1 et par Botrytis cinerea. Afin didentifier la voie métabolique faisant intervenir CYP76C2, un profilage métabolique ciblé et non ciblé a été entrepris, centré sur le(s) métabolite(s) différentiellement accumulés dans les différents mutants en condition dinfection. Alors que des différences subtiles de sensibilité des mutants de CYP76C2 aux pathogènes semblent confirmer son rôle dans la réponse aux pathogènes, les lignées affectées dans son expression ne présentent pas de phénotypes clairement différents de ceux des plantes sauvages. Une analyse non ciblée en UPLC-MS (Orbitrap) a permis didentifier un composé absent dans le mutant cyp76c2 qui pourrait correspondre à un dérivé conjugué en C11, sans que sa structure ne puisse pour linstant être identifiée (formule brute C17H28O9). CYP76C2 ne semble pas impliqué directement dans la synthèse dune molécule cruciale pour la mise en place du processus de défense, mais exerce plus probablement une fonction spécialisée ou partiellement redondante de défense ou de détoxication.
Mot clés: cytochrome P450, activation, defense, Botrytis cinerea, Pseudomonas syringae, metabolism.
iii A transcriptome analysis of Arabidopsis thaliana subjected to biotic stresses has revealed the activation of members of the CYP76 family, especially of CYP76C2 ( 50 times). The functional characterization of CYP76C2, has been the objective of this thesis. After confirmation of the selective activation of CYP76C2 by pathogens, the phenotype of its insertion and overexpressor mutants was characterized under infection by Pseudomonas syringae pv. tomato DC3000, P. syringae pv. tomato DC3000 avrRpm1 and Botrytis cinerea. In order to identify the metabolic pathway involving CYP76C2, targeted and non-targeted metabolic profiling was focused on differentially accumulated compounds in the different mutants after infection. Whereas subtle differences of response of the CYP76C2 mutant lines in response to pathogens seemed to confirm its involvement in response to biotic stress, phenotypes strikingly different from those of wild-type plants were not observed. A non-targeted analysis by UPLC-MS (Orbitrap) identified a compound absent in the cyp76c2 line that may correspond to an oxygenated C11 conjugate (raw formula C17H28O9), but its structure was not identified. CYP76C2 thus does not seem directly involved in the synthesis of a molecule crucial for defense responses, but more likely has a role in the synthesis of a potentially redundant specialized defense compound or in a detoxification process.
Keywords: cytochrome P450, activation, defense, Botrytis cinerea, Pseudomonas syringae, metabolism.
iv Esta tesis está dedicada a María del Carmen y Julio.
Ellos llegaron a Córdoba en busca de sus sueños y yo llegue a Francia en busca de los míos gracias a todos los valores que nos supieron transmitir.
Caminante, son tus huellas el camino y nada más; caminante, no hay camino, se hace camino al andar. Al andar se hace camino y al volver la vista atrás se ve la senda que nunca se ha de volver a pisar. Caminante no hay camino sino estelas en la mar (Extract from Campos de Castilla, Proverbios y cantares (XXIX), A. Machado, 1912)
v This thesis was supported by INTA (National Institute of Agricultural Technology) from Argentina and the IBMP-CNRS from France.
I wish to express my sincere thanks to Danièle Werck and Serge Kauffmann for proposing this thesis subject and providing me with all necessary facilities for the research in France. I am undoubtedly thankful and indebted to D. Werck who provided insight and expertise all along the thesis.
I want to thank the jury members for kindly accepting to review my thesis.
I would like to express my very great appreciation to B. Boachon for his valuable suggestions during the planning and development of this research work. His willingness to give his time and expertise for UPLC-MS analysis has been very much appreciated.
I take this opportunity to express my gratitude to all the former and present members of the P450 Department for their help and support, a special thank you to N. Navrot, P. Ullmann, C. Gavira, A. Alber and C. Parage, for technical guidance and proofreading of this manuscript. I am also grateful to J.F. Ginglinger, A. Lesot, B. Grausem, E. Widemann, G. Verdier, H. Renault, T. Ilc, Z. Liu and F. Pinot for helpful discussions on diverse matters. T. Heitz and H. Zuber for precious standards. M. Heinlein and E. Peña for sharing their vision of science with me.
F. Philippon, thank you for your invaluable provision of lab material. You are one of the most efficient and patient persons I know.
I am grateful to people at the different platforms of the institute for their help and assistance, especially A. Alioua, R. Lugan, M. Erhardt, J. Mutterer, V. Cognat, and F. Disdier. I thank M. Ramel for advices on plant culture. I want to recognize all the work done by people from administration and L. Monnier, who made our lives at lab easier.
I would like to thank P. Saindrenan and his team (M. Garmier, L. Didierlaurent) for his precise, concise and valuable advices on my work and assistance with H. arabidopsidis.
vi and to F. Gándara our former Director, to C. Améndola and to I. Cattoni for insight into statistics. C. Bruno for Infostat. J.I. Fernández for photoshop assistance.
To all the authors I wrote to, thanks for your answers and insightful comments.
I would like to thank my friends and family here and in Argentina, for their support and encouragement throughout my stay in France.
To all my friends in Strasbourg: Doro and Thomas, Denise, Carolina, Andrea, Lucia and Francisco, Eduardo y Marina, Lule I will not forget the wonderful moments spent with you.
Alexandra, Annette and Carole you know you have a huuuuuuuuuuuuuuuuuge place in my heart. Next stop: Argentina!
To my friends from life: Celes, Isa, Naty, gracias por todo, sin Uds no existo. No tengo palabras. Marcos! Ernes, Lore, Ale, Fer, cuanto cuanto cuanto!!!
Finally to: H.S.T, T., S.C., M.D, C.F, C.P.E, S.R, A.L, without them it would have been impossible or very boring...
vii
Title i
Abstract in French ii
Abstract in English iii
Dedication iv
Acknowledgements v
List of Contents vii
List of Figures xiii
List of Tables xvii
Abbreviations xviii
INTRODUCTION 1
The plant model of choice: Arabidopsis thaliana 2
Cytochrome P450 4
Nomenclature 8
P450 and Plant Defense 8
Secondary Metabolism 10
Phytoalexins and phytoanticipins 15
Camalexin the main phytoalexin from Arabidopsis 18
The camalexin pathway: work in progress 21
Specialized metabolism: application and outlook 24
Terpenoids 26
Terpenoids biosynthesis 29
DEFENSE STRATEGIES IN PLANTS 33
1- Pathogen-triggered Immunity 34
2- Effector-triggered immunity 34
a) Theory Gene-for-Gene Resistance 37
b) and c) The Guard model and The Decoy model 38
viii
Signaling Pathways and Downstream Responses 44
Hormones and plant defenses 44
SA Biosynthesis 46
1- The PAL pathway (PAL): 46
2- Isochorismate pathway (ICS): 47
JAs biosynthesis 50
SA pathway signaling 55
JAs pathway signaling 56
Crosstalk between SA and JA/ET 60
Crosstalk between ABA and SA/JA 60
Crosstalk between AUX and SA/JA 60
Crosstalk between GB and SA/JA 61
Programmed Cell Death 62
Hypersensitive Response (HR) 65
The role of ROS and NO in HR 67
Induction pathways of HR 73
HR: ecological cost and trade-off 75
SAR 79
The networking of small metabolites in SAR 80
Some words about MeSA and JA 83
JA and SAR 84
The role of NPR1 and SAR 85
Pathogen Lifestyle 87
The pathogens used in this thesis 89
Pseudomonas syringae pv tomato DC3000 89
Coronatine: mimicking the enemy 92
The bacterial PAMP Flagellin 94
Defense and metabolism in the interaction A. thaliana-Pto DC3000 95
ix
HYPOTHESIS AND OBJECTIVES 104
Objectives 104
CYP76 family background information 105
MATERIALS AND METHODS 117
BIOLOGICAL MATERIAL 117
Plant Material and Growing Conditions 117
Plant Pathogens 117
1 -Pseudomonas syringae pv tomato DC3000 117
2- Botrytis cinerea 118
METHODS 118
Construction of over-expression mutant 35S:CYP76C7 and transformation 118
Escherichia coli chemical transformation 119
Agrobacterium tumefaciens transformation using electroporation 120
RNA extraction 121
cDNA synthesis 122
Genotyping of T-DNA insertion lines 122
DNA extraction protocol 124
Genotyping of Overexpression Lines 124
Gene Expression Analysis 125
- Glucuronidase (GUS) Activity Assay 125
qRT-PCR for Gene Expression 126
Plant Infections 129
Plant Leaves Infection with Pto DC3000 129
DNA extraction and qPCR quantification 130
Botrytis cinerea Infection 131
Hyaloperonospora arabidopsidis 131
Hyaloperonospora arabidopsidis Infection 132
Metabolomics Analysis 132
x
Targeted Analysis for (mono) terpenoids: UPLC MS/MS 3Q-MRM Mode 133
Hormone Profiling 135
Non-targeted analysis: UPLC MS (Orbitrap) 138
Enzymatic Activities in vitro with Microsomal Fraction of Recombinant Yeast 139
Yeast Transformation Protocol 139
P450 Quantification by Spectral Assay 142
HPLC Analysis 143
Statistical Analysis 137
WORKFLOW OF EXPERIMENTS AND DATA ACQUISITION 148
RESULTS 149
Gene Expression Analysis 149
Strategy for qRT-PCR analysis of gene expression 149
Effect of B. cinerea infection on the expression of CYP76 151
Effect of Pto DC3000 infection on the expression of CYP76 154
Effect of Pto DC3000 avrRpm1 infection on the expression of CYP76 158
HR zone 158
LAR zone 160
SAR zone 161
Conclusion of the qRT-PCR analysis of gene expression 162
CYP76C2 expression monitored via -glucuronidase (GUS) activity 167
Conclusion of the CYP76C2 expression monitored via GUS activity 172
CYP76C2: Phenotyping in response to pathogens 174
Virulent infection with Pto DC3000 174
Temporal analysis of symptoms development after Pto DC3000 infection 177
Infection with Pto DC3000 avrRpm1: HR LAR and SAR responses 180
HR 180
LAR and SAR responses 181
Temporal analysis of symptoms -Pto DC3000 avrRpm1 infections 185
xi
Conclusion of the experiments of phenotyping of the CYP76C2 190
Metabolomics Analysis 191
Headspace volatile analysis in GC-MS 191
Metabolic Profiling of Soluble Metabolites in UPLC-3Q-MS/MS 197
Targeted Analysis of Monoterpenoids: UPLC-3Q-MS/MS in MRM Mode 197
Hormone profiling 201
Profiling of benzoates and derivatives at 24 HPI 201
UPLC-3Q-MS/MS analysis 201
UPLC-ORBITRAP-MS/MS analysis 207
Hormone Profiling: kinetics of accumulation in a timeline from 0 to 72 HPI 212
Two compounds of relevance: Camalexin and Linalool timeline 219
Conclusions on hormone profiling and camalexin accumulation in a time line 227
-glycosidase/ -xylosidase treatments 229
Enzymatic Activities in vitro with Microsomal Fraction of Recombinant Yeast 235
Non-targeted analysis: Orbitrap UPLC-MS 236
In the search for conjugate 238
Conclusion on Non-Targeted Profiling 240
CONCLUSIONS AND PERSPECTIVES 241
REFERENCES 250
APPENDIX 292
List of P450 used in transcriptomic analysis 292
Genotyping of T-DNA insertion lines and overexpression lines 296
Melting curve analysis of primers used in qRT-PCR 300
qPCR quantification of Pseudomonas syringae growth in planta 302
Temporal analysis of symptoms development after Pto DC3000 infections 304
Temporal analysis of symptoms development after B. cinerea infections 305
Hyaloperonospora arabidopsidis infection with strain Noco2 306
xii
Microsomes CYP76C2 Extended abstract in french
314 315 Publication in a journal
xiii
Page
Figure 1 : Arabidopsis thaliana 2
Figure 2 : Ribbon representation of P450 CYP74A structure 4
Figure 3 : The P450 catalytic cycle 6
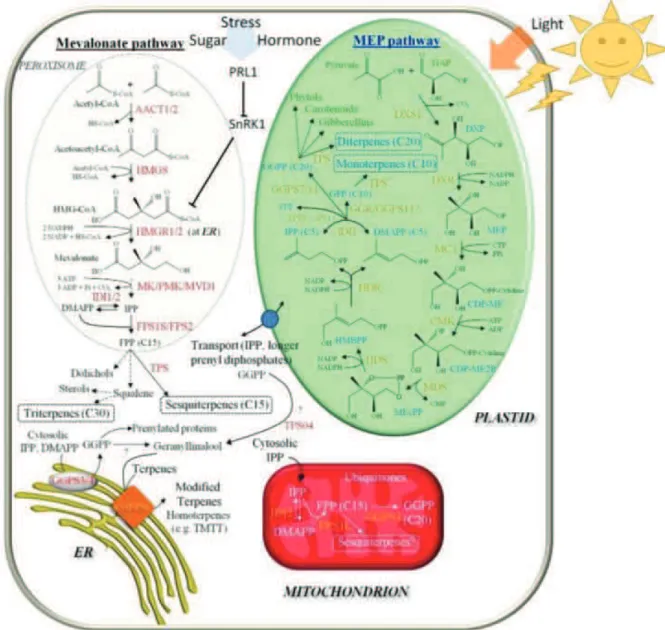
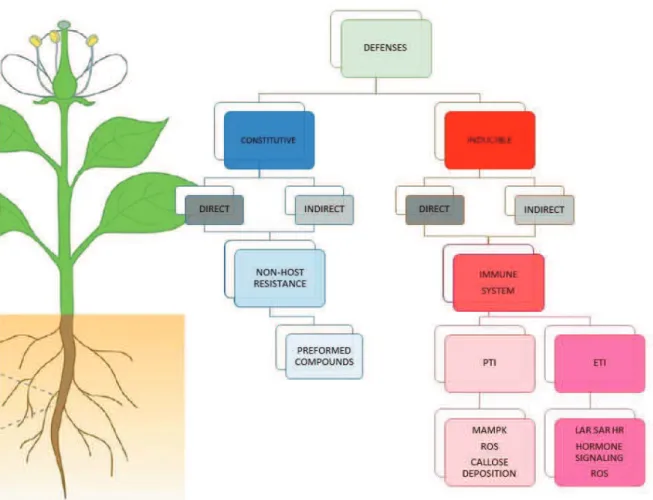
Figure 4 : Main pathways for secondary metabolites precursors 11 Figure 5 : Phytoalexins from different plant families 17 Figure 6 : The puzzling biosynthetic pathway of camalexin 23 Figure 7 : Some examples of terpenoid classes and diversity 28 Figure 8 : Schematic and summarized representation of terpene biosynthesis and classes 31 Figure 9 : Terpene biosynthesis Mav and Mep pathways and their subcellular localization 32 Figure 10 : Schematic representation of plant defenses 33
Figure 11 : PAMPS and BAK1 35
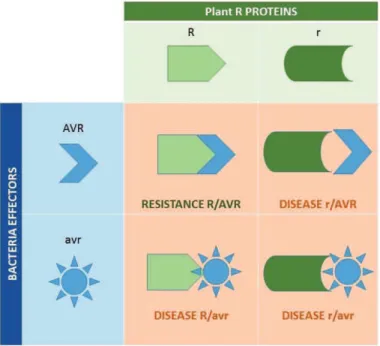
Figure 12 : Schematic representation of the gene-for-gene theory 37
Figure 13 : The guard model vs the decoy model 40
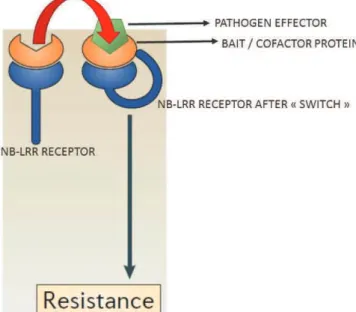
Figure 14 : The bait and switch model 41
Figure 15 : The zigzag model of plant immune system 43 Figure 16 : Structure of plant hormones relevant to plant-pathogen interactions 45
Figure 17 : SA biosynthesis and modifications 48
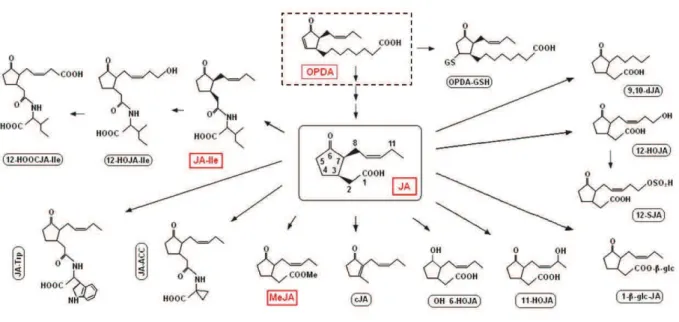
Figure 18 : JAs precursors and derivatives 50
Figure 19 : Cellular compartmentalization of JA biosynthesis and signaling 52 Figure 20 : JA synthesis and further transformations 54 Figure 21 : SA signaling cascade after (hemi)biotroph pathogen attack 55 Figure 22 : JA signaling cascade after necrotroph pathogen attack 56 Figure 23 : Schematic representation of hormonal crosstalk 59 Figure 24 : Col-0 plants with Pto DC3000 avrpm1 showing the HR lesion 66
Figure 25 : Generation of ROS 67
Figure 26 : Enzymatic scavenging of ROS 69
Figure 27 : Biology of the oxidative burst 71
Figure 28 : Cross-talk between ROS and NO in plant cell death 72
Figure 29 : The induction pathway of HR 73
xiv
Figure 33 : Schematic representation model of SAR signaling 81 Figure 34 : NPR3 and NPR4 regulation of NPR1 in SAR 86 Figure35: : Infection cycle of Pseudomonas syringae pv tomato in A. thaliana leaves 90
Figure 36 : Schematic representation of RIN4 92
Figure 37 : Molecular representation of coronatine 93 Figure 38 : PAMP elicitors activate SA signaling and indole glucosinolate metabolism 94
Figure 39 : Botrytis cinerea 99
Figure 40 : Chronology of genes differentially expressed during A. thaliana-B. cinerea 101 Figure 41 : Phylogenetic tree representing CYP76 family members in A. thaliana 105 Figure 42 : Gene structure and chromosome localization of the CYP76 family 106 Figure 43 : Schematic representation of expression patterns in A. thaliana organs 107 Figure 44 : Reactions catalyzed by CYP76C1, CYP76C2, and CYP76C4 in vitro 109 Figure 45 : Timeline progress and information CYP76C subfamily 111 Figure 46 : Stress responsive matrix of selected P450 genes 113 Figure 47 : Data from transcriptomic analyses LAR responses 6 HPI 114 Figure 48 : Diagram of primers and T-DNA insertion 123 Figure 49 : A. thaliana Col-0 plant, 96 HPI avirulent strain + virulent strain 130 Figure 50 : The molecular structure of analyzed compounds 144 Figure 51 : Absorption spectrum of analyzed compounds 145 Figure52: : Transcript level of CYP76 family members during interaction with B. cinerea 153 Figure 53 : Transcript level of CYP76C2 at 8-24-48 HPI during interaction with B. cinerea 154 Figure 54 : Transcript levels of CYP76 family members interaction with Pto DC3000 157 Figure 55 : Transcript levels of the CYP76 family members interaction with Pto avrRpm1 164 Figure 56 : Summary transcript levels of CYP76C2 166 Figure 57 : GUS staining of B. cinerea infected leaves from promCYP76C2:GUS 168 Figure 58 : Local and systemic gene expression B. cinerea infection promCYP76C2:GUS 169 Figure 59 : GUS staining of Alternaria brassicicola infected leaves from promCYP76C2:GUS 169 Figure 60 : GUS staining of Pto DC3000 infected leaves from promCYP76C2:GUS 170 Figure 61 : GUS staining of Pto DC3000 avrRpm1 infected leaves from promCYP76C2:GUS 171 Figure 62 : GUS staining of Pto DC3000 infected leaves from promCYP76C2:GUS 172 Figure 63 : Pto DC3000 infection on A. thaliana leaves of Col-0, cyp76c2 and 35S:CYP76C2 175 Figure 64 : Disease symptoms 72 HPI in A. thaliana leaves of Col-0, cyp76c2,35S:CYP76C2 176
xv
Figure 67 : Quantification of Pto DC3000 avrRpm1 infection on Col-0, cyp76c2, 35S:CYP76C2 180 Figure 68 : Disease symptoms, LAR and SAR responses at 72 HPI in Col-0 plants 182 Figure 69 : Quantification Pto DC3000 infection on A. thaliana of Col-0, cyp76c2,35S:CYP76C2 183 Figure 70 : Quantification Pto DC3000 infection on A. thaliana of Col-0, cyp76c2, 35S:CYP76C2 184 Figure 71 : Time course progress Pto DC3000 avrRpm1 infection in Col-0, cyp76c2,35S:CYP76C2 186 Figure 72 : Visual assessment disease development in A. thaliana Col-0, cyp76c2,35S:CYP76C2 187 Figure 73 : Quantification disease development in A. thaliana Col-0, cyp76c2, 35S:CYP76C2 189 Figure 74 : GC-MS chromatograms of headspace volatiles from Col-0, cyp76c2,35S:CYP76C2 193 Figure 75 : GC-MS chromatograms of headspace volatiles from Col-0, cyp76c2,35S:CYP76C2 194 Figure 76 : GC-MS chromatograms of headspace volatiles from Col-0, cyp76c2,35S:CYP76C2 195 Figure 77 : GC-MS chromatograms of headspace volatiles from Col-0, cyp76c2,35S:CYP76C2 196 Figure 78 : Targeted UPLC-3Q-MS/MS profiling Col-0, cyp76c2, 35S:CYP76C2 198 Figure 79 : Bi-plot of PCA of the metabolic profiling of Col-0, cyp76c2, 35S:CYP76C2 200 Figure 80 : UPLC-3Q-MS/MS chromatograms of Col-0, cyp76c2, 35S:CYP76C2 202 Figure 81 : UPLC-3Q-MS/MS chromatograms of 2,5 DHBA standard and 35S:CYP76C2 203 Figure 82 : Four potential compounds related to 2,5 DHBA in Col-0, cyp76c2, 35S:CYP76C2 204 Figure 83 : Profiling SA, SAG, JA-Ile, JA-Ile-OH, JA-Ile-COOH in Col-0, cyp76c2, 35S:CYP76C2 205 Figure 84 : Bi-plot of PCA of the hormone profiling of Col-0, cyp76c2, 35S:CYP76C2 207 Figure 85 : Quantification of compounds potentially related to 2,5 DHBA and conjugated forms 208 Figure 86 : Bi-plot of PCA of the hormone profiling of Col-0, cyp76c2, 35S:CYP76C2 210 Figure 87 : Profiling of BA, SA, SAG and SGE upon Pto DC3000 avrRpm1 infection 213 Figure 88 : Profiling of 2,3 , 2,5, 2,4 and 3,4 DHBA upon Pto DC3000 avrRpm1 infection 215 Figure 89 : Profiling of JAs upon Pto DC3000 avrRpm1 infection 216 Figure 90 : Profiling of TA and its sulfated/glycosylated forms upon Pto DC3000 avrRpm1 218 Figure 91 : Profiling of ABA upon Pto DC3000 avrRpm1 infection 219 Figure 92 : Profiling of camalexin upon Pto DC3000 avrRpm1 infection 220 Figure 93 : Profiling of linalool and hydroxylated derivatives upon Pto DC3000 avrRpm1 221 Figure 94 : Bi-plot of PCA of the hormone profiling of Col-0, cyp76c2 ,35S:CYP76C2 0 HPI 224 Figure 95 : Bi-plot of PCA of the hormone profiling of Col-0, cyp76c2 ,35S:CYP76C2 24 HPI 225 Figure 96 : Bi-plot of PCA of the hormone profiling of Col-0, cyp76c2 ,35S:CYP76C2 48 HPI 226 Figure 97 : Bi-plot of PCA of the hormone profiling of Col-0, cyp76c2 ,35S:CYP76C2 72 HPI 227 Figure 98 : MRM methods in UPLC-3Q-MS/MS for benzenoids 229
xvi
Figure 101 : Targeted UPLC profiling of SA and glycosylated forms in Col-0, 35S:CYP76C2 232 Figure 102 : Targeted UPLC profiling of DHBAs and glycosylated forms in Col-0, 35S:CYP76C2 234 Figure 103 : HPLC-photodiode array chromatogram of in vitro conversion 235 Figure 104 : Area values of the peak corresponding to compound 1 236 Figure 105 : Area values of the peak corresponding to compound 1 238 Figure 106 : Peak area of the compounds of m/z 377 and 215 from orbitrap UPLC-MS 6 HPI 239 Figure 107 : Mass spectrum of the [M- H2O] ion 215 m/z, ESI positive 240 Figure 108 : Schematic representation of T-DNA insertion in the lines used in this thesis 297 Figure 109 : Genotyping of T-DNA insertion and overexpression lines of CYP76C1 and CYP76C2 297 Figure 110 : Genotyping of T-DNA insertion and overexpression lines of CYP76C3 298 Figure 111 : Genotyping of T-DNA insertion and overexpression lines of CYP76C4 298 Figure 112 : Melting curve analysis of primers used in qRT-PCR of gene expression 300 Figure 113 : Melting curve analysis of primers used in qRT-PCR of gene expression 301 Figure 114 : Standard curve AtTUB4 gene from A. thaliana 302 Figure 115 : Standard curve of plasmid containing the PsOpfr gene from Pto DC3000 303 Figure 116 : qPCR quantification of time course infection Pto DC3000 on A. thaliana -EE 304 Figure 117 : Quantification of disease development in A. thaliana Col-0, cyp76c2, 35S:CYP76C2 305 Figure 118 : Hyaloperonospora arabidopsidis infection with strain noco2 306 Figure 119 : Bi-plot of PCA of the metabolic profiling of Col-0, cyp76c2, 35S:CYP76C2 307 Figure 120 : Bi-plot of PCA of the metabolic profiling of Col-0, cyp76c2, 35S:CYP76C2 308 Figure 121 : Profiling of BA, SA, SAG and SEG upon Pto DC3000 avrRpm1 infection 309 Figure 122 : Profiling of 2,3, 2,5, 2,4 ?3,4 DHBA upon Pto DC3000 avrRpm1 infection 310 Figure 123 : Profiling of JAs upon Pto DC3000 avrRpm1 infection 311 Figure 124 : Profiling of TA and glycosylated form upon Pto DC3000 avrRpm1 312 Figure 125 : Profiling of ABA and camalexin upon Pto DC3000 avrRpm1 infection 312 Figure 126 : Profiling of linalool and hydroxylated derivatives 313 Figure 127 : CYP76C2 : yeast transformation, positive colonies and P450 spectro 314
xvii Page Table 1: Cytochrome P450 in defense and signaling in Arabidopsis thaliana 9 Table 2: Classes of specialized metabolites and their role in defense in higher plants 13 Table 3: List of factors triggering camalexin biosynthesis in Arabidopsis thaliana 20 Table 4: SA modifications in Arabidopsis thaliana 49 Table 5: Metabolic fate of JAs in A. thaliana 53 Table 6: Morphological classification of cell death in plants 63 Table 7: Classification of non-autolytic cell death in plants 64
Table 8: Pathogens and lifestyle 87
Table 9: Reported substrates of the members of the CYP76C subfamily 108 Table 10: Primer sequence with user extensions used to amplify CYP76C7 119 Table 11: Primers sequences used for colony PCR 120 Table 12: Primer sequences used for genotyping of knock-out lines 123 Table 13: Primer sequences of reference genes 127 Table 14: Primer sequences used for RT-qPCR for gene expression quantification 128
Table 15: Reference genes annotation 128
Table 16: Gene specific primers for pathogen DNA quantification 130 Table 17: UHPLC gradient elution linalool derivatives 134 Table 18: m/z Fragments obtained by UPLC-MS for different linalool derivatives 135 Table 19: UHPLC gradient elution for hormones 136 Table 20: m/z Fragments obtained by UPLC-MS 137 Table 21: UHPLC gradient elution Orbitrap 138 Table 22: HPLC gradient for benzenoids derivatives 143 Table 23: List of candidate substrates used in CYP76C2 enzymatic assays 143 Table 24: Mean value of Botrytis necrotic lesion in % of col-0 plants 190 Table 25: PCA summary fragments from 100-450 m/z 199 Table 26: PCA summary putatives DHBA UPLC-MS/MS 206 Table 27: PCA summary putatives DHBA Orbitrap-UPLC 209 Table 28: Kruskal-Wallis test for mean comparison hormone profiling 222 Table 29: PCA summary hormone profiling timeline 223 Table 30: Information on chemical formulae calculated with the m/z of compound 1 237 Table 31: List of genetic material available and genetic status 299
xviii
12-OH-JA-sulfate 12-Hidroxy-(+)-7-Isojasmonic Acid Sulfate 2,3 DHBA 2,3 Dihydroxybenzoic Acid
2,4 DHBA 2,4 Dihydroxybenzoic Acid 2,5 DHBA 2,5 Dihydroxybenzoic 3,4 DHBA 3,4 Dihydroxybenzoic Acid 4CL 4-Coumarate CoA Ligase
A
AAO Aldehyde Oxidase ABA Abscisic Acid ANOVA Analysis of Variance AOC Allene Oxide Cyclase AOS Allene Oxide Synthase
AP2/ERF Apetala 2/Ethylene Response Factor Atrboh Respiratory Burst Oxidase Homologues AtST2 A. Thaliana Sulfotransferase 2
Avr Avirulent Aza Azelaic Acid
AZI1 Azelaic Acid Induced 1
B
BA Benzoic Acid
BA2H Benzoic Acid-2-Hydroxylase
BAK1
Brassinosteroid Insensitive 1 Associated Kinase BIK1 Botrytis Induced Kinase 1 BLAST Basic Local Alignment Search Tool bp Base Pair
BR Brassinosteroid BSA Bovine Serum Albumin BZL Benzoyl CoA Ligase
C
CaMV Cauliflower Mosaic Virus CAT Catalase
CC-NB-LRR Coil-Coil -NB-LRR cDNA Complementary DNA CE Collision Energy CFA Coronafacic Acid cfu Colony Forming Unit CH4 Cinnamate 4-Hydroxylase cJA Cis- Jasmonate
CK Cytokinines CMA Coronamic Acid
CoA Coenzyme A
COI1 Coronatine Insensitive 1 Col-0 Columbia Ecotype COR Coronatine CT Threshold Cycle C-terminal Carboxy-Terminus CWDE Cell Wall Degrading Enzyme CYP Cytochrome P450 Cys(IAN) Ian Cysteine Conjugate
D
Da Dalton
DA Dehydroabietal
DAD1 Delayed Anther Dehiscence 1 DAMP Danger-Associated Molecular Pattern DGL Dongle
DHCA Dihydrocamalexic Acid.
DIR1 Defective In Induced Resistance 1 DMAPP Dimethyl Allyl Diphosphate DMSO Dimethyl Sulfoxide DNA Deoxyribonucleic Acid dn-OPDA Dinor-OPDA dNTP Deoxyribonucleotide Triphosphate DO Optical Density DTT Dithiothreitol E E Efficiency
EAR ERF -Associated Amphiphilic Repression EDS1 Enhanced Disease Susceptibility 1 EDTA Ethylene Diamine Tetraacetic Acid EFR Elongation Factor Ef-Tu
ER Endoplasmic Reticulum ESI Electrospray Ionization EST Expressed Sequence Tag ET Ethylene
ETI Effector-Triggered Immunity ETS Effector-Triggered Susceptibility
F
FAA Formalin Acetic Acid Alcohol FB1 Fumonisin B1
FLD Flowering Locus D flg22 Flagellin 22
xix
G
G3P Glycerol-3-Phosphate GB Gibberellin
GC-MS Gas Chromatography- Mass Spectrometry gDNA Genomic DNA
GFP Green Fluorescent Protein GGP1/GGP3 -Glutamylpeptidases
GGT1/GGT3 -Glutamyltranspeptidases 1 and 3 GRX Glutaredoxin
GSH Glutathione
GSH(IAN) IAN Glutathionyl Derivative GST Glutathione S-Transferase GSTF6 Glutathione-S-Transferase GUS !-Glucuronidase
H
h Hours
HPI Hours Post Infection
HPLC High Performance Liquid Chromatography HR Hypersensitive Response
I
IAA Indole Acetic Acid IAN Indole-3-Acetonitrile (IAN)CysGly IAN Cysteinyl-Glycine IAOx Indole-3-Acetaldoxime IAR3 IAA-Alanine Resistant 3 ICS1/2 Isochorismate Synthase
ILL6 IAA-Leucine Resistant (ILR)-Like Gene 6 IPL Isochorismate Pyruvate Lyase IPP Isopentenyl Diphosphate
IPTG Isopropyl-"-D-Thiogalactopyranoside IS Internal Standards
J
JA Jasmonic Acid /Jasmonate
JA-ACC
JA /1-Amino-1-Cyclopropane Carboxylic Acid Conjugate JA-ILE Jasmonoyl Isoleucine
JA-Ile-COOH 12-Carboxyjasmonoyil Isoleucine JA-Ile-OH 12-Hydroxyjasmonoyl-Isoleucine JAR1 Jasmonate Resistant 1
JA-Trp JA /Tryptophan Conjugate JAZ Jasmonate Zim
JMT JA Carboxyl Methyl Transferase
LAR Localized Acquired Resistance LB Left Border
LOX Lipoxygenase LOX2 Lipoxygenase 2 LRR Leucine Rich Repeat
LSD1 Lesion Simulating Disease Resistance
M
M Molar
m/z Mass To Charge Ratio
MAMP Microbe-Associated Molecular Pattern MAPK Mitogen Activated Protein Kinase MAPK Mitogen Activated Protein Kinases MC1 Metacaspase 1
MEA Malt Extract Agar MeJA Methyl Jasmonate MEP Methyl Erythrol Pathway MeSA Methyl Salicylate min Minute
MOS Modifier of Snc1
MRM Multiple Reaction Monitoring Mode MS Mass Spectrometry
MVA Mevalonate Pathway MYC Transcription Factor
N
NADPH Nicotinamide Adenine Dinucleotide Phosphate NASC Nottingham European Arabidopsis Stock Centre NB-LRR Nucleotide Binding-Leucine Rich Repeat NDR1 Non-Race Specific Disease Resistance 1 NIMIN1 Nim Interacting 1
NINJA Novel Interactor of JAZ
NIST National Institute of Standards and Technology nm Nanometer NO Nitric Oxide NPR1, NPR3, NPR4 Non-Expressor of PR1, 3, 4 N-terminal Amino-Terminus O OD Optical Density OG Oligogalacturonides OPDA 12-Oxo-Phytodienoic Acid OPDA-GSH OPDA Glutathione Conjugate OPR3 Oxophytodienoic Acid Reductase 3 ORA 59 Octadecanoid Responsive Arabidopsis 59
xx
P450 Cytochrome P450 PAD3 CYP71B15 Phytoalexin Deficient 3 PAD4 Phytoalexin Deficient 4 PAL Phenylalanine Ammonia- Lyase PAMP Pathogen-Associated Molecular Pattern PBS Phosphate Buffered Saline
PCA Principal Component Analysis PCD Programmed Cell Death PCR Polymerase Chain Reaction PCS1 Phytochelatin Synthase PDA Potato Dextrose Agar PDB Potato Dextrose Broth PDF 1.2 Plant Defensin 1.2 PEG Polyethylene Glycol Pip L-Pipecolic Acid PR Pathogenesis-Related PRR Pathogen Recognition Receptor PTI PAMP-Triggered Innate Immunity Pto DC 3000 P. syringae pv. tomato DC3000 (Vir) pv. Pathovar
Q
qPCR Real Time PCR
qRT-PCR Real Time Reverse Transcription PCR
R
RB Right Border R-gene Resistance Gene RLK Receptor Like Kinase RNA Ribonucleic Acid ROS Reactive Oxygen Species R-protein Resistance Protein RT Retention Time
RT-PCR
Reverse Transcription Polymerase Chain Reaction
S
SA Salicylic Acid
SA-Asp Salicyloyl-L-Aspartic Acid SABP2 SA Binding Protein 2 SAG Salicylic Acid 2-O-"-Glucoside
SAG 101
Senescence -Associated Carboxylesterase 101 SAR Systemic Acquired Resistance
SCF-COI1 complex E3 Ubiquitin-Ligase SKP1-Cullin-F-Box Complex SCG
sec Seconds
SEG Salicyloil Glucose Ester SM Secondary Metabolism SNI1 Suppressor of NPR1 Inducible 1 SOD Superoxide Dismutase STD Standard Deviation
T
TA Tuberonic Acid/ 12-Hydroxy-(+)-7-Isojasmonic Acid TAE buffer Buffer Tris, Acetate, EDTA
TAG Glycosylated form of Tuberonic Acid T-DNA Transfer DNA
TDS Thermal Desorber TE Tris-HCl EDTA TGA Transcription Factor TIR-NB-LRR Toll-Interleukin-NB-LRR TLR Toll Like Receptor Tm Melting Temperature TMTT 4,8,12-Trimethyltrideca-1,3,7,11-Tetraene TPL Topless Corepressor TPS Terpene Synthase Tris 2-Amino-2-Hydroxymethyl-Propane-1,3-Diol TRX-H 3-5 Thioredoxin
TTSS Type III Secretion System
U
UGT UDP-Glycosyltransferase
UHPLC Ultra High Performance Liquid Chromatography UPLC Ultra Performance Liquid Chromatography UV Ultra-Violet
V
v/v Volume in Volume
VPE Vacuolar Processing Enzymes VSP2 Vegetative Storage Protein 2
W
WRKY Transcription Factor WS Wassilewskija Ecotype WT Wild-Type
X
X-gluc 5-Bromo-4-Chloro-3-Indolyl-"-D-Glucuronic Acid
Z
IN
T
R
O
D
U
C
T
IO
N
2
INTRODUCTION
The plant model of choice: Arabidopsis thaliana
Arabidopsis thaliana (L.) Heynh. 1842 is a dicotyledonous species member of the Brassicaceae family (Figure 1). Although not of major agronomic significance, its characteristics including short life cycle (6 weeks), prolific seed production, and manageable size for cultivation has made this plant widely used as a model organism in plant biology since its full sequencing in 2000 (The Arabidopsis Initiative, 2000).
Figure 1: Arabidopsis thaliana (L.) Heynh., syn. Crucifera thaliana (L.) E.H. L. Krause.
From Deutschlands Flora in Abbildungen (1796) at http://www.biolib.de
3 A large number of mutant lines and genomic resources are currently available since plant transformation by Agrobacterium tumefaciens is highly efficient (Weigel and Glazebrook, 2002). This feature is not of minor relevance, since it allows to easily address a wide range of topics or fields that have demonstrated to be complex or problematic in more economically important plant species.
Until a few years ago, it seemed unlikely that such a small plant (and genome) would be suitable to tackle questions related to Plant-Pathogen interaction and Secondary Metabolism, but recent work have endorsed the Arabidopsis model for such studies (Mauch-Mani and Slusarenko, 1993; DAuria and Gershenzon, 2005; Pieterse et al., 2009; Koornneef and Meinke, 2010).
The validation of several pathosystems with useful variation in A. thaliana responses as a host (Mauch-Mani and Slusarenko, 1993; Katagiri et al., 2002; Slusarenko and Schlaich, 2003) has in fact enlarged our understanding of plant-pathogen interactions and the underlying signaling networking. It has also increased the possibilities of applying this knowledge to solve the fundamental question in plant pathology and to improve crop development (Laluk and Mengiste, 2010; Ferrier et al., 2011).
On the other hand, A. thaliana was also found appropriate for studies on function and evolution of plant secondary metabolism (Chapple et al., 1994; DAuria and Gershenzon, 2005) with numerous metabolites representatives of the major classes of secondary metabolites such as indole and indole-sulfur compounds, glucosinolates, terpenoids, phenylpropanoids, benzenoids, fatty acid derivatives and flavonoids (Lv et al., 2014).
Displaying a striking spatial and temporal variation and distribution of secondary metabolites within the plant, but also in ecological interactions with the surrounding environment, Arabidopsis provides a unique opportunity to study the biosynthesis, regulation and function of secondary metabolites in some major secondary metabolic pathways (Dixon, 2001; Edda von Roepenack-Lahaye et al., 2004; DAuria and Gershenzon, 2005; Lv et al., 2014).
4 Cytochrome P450
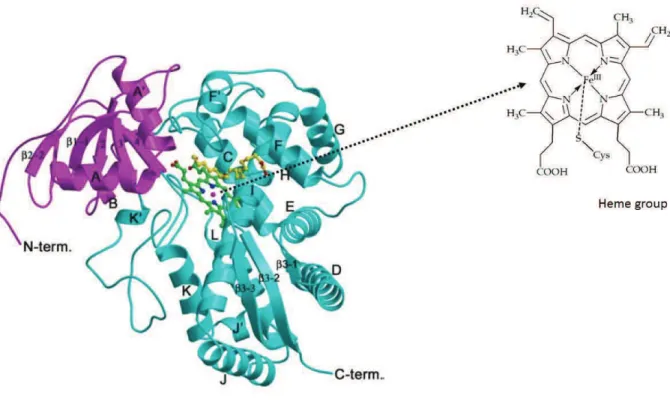
Cytochromes P450 or CYPs is a generic name for a large family of heme-thiolate proteins that use NAD(P)H as electron donor for dioxygen activation and insertion of one of its oxygen atoms into organic substrates (Mitzutani et al., 1998; Schuler and Werck-Reichhart, 2003).
P450s proteins are mainly -helical, with the heme cofactor sandwiched between a larger -helix-rich domain and a small !-sheet-rich domain (Munro et al., 2013) (Figure 2). The vast majority of the P450s are anchored into cellular membranes (usually endoplasmic reticulum) with a single N-terminal helix, with the globular part of the protein protruding into the cytoplasm (Schuler and Werck-Reichhart, 2003). The heme group is a highly conjugated ring system with four pyrrole nitrogen coordinated to iron (to form a heme b) that has as fifth ligand a conserved cysteine of the protein axially bound through a thiol bond (Munro et al., 2013) (Figure 2 ).
Figure 2: Ribbon representation of P450 CYP74A structure.
The - and !-domains are shown in cyan and magenta with the secondary structures. The N- and C-termini are labeled. Heme group and substrate can be seen in the center as ball-stick model (diverse colors). From Li et al. (2008).
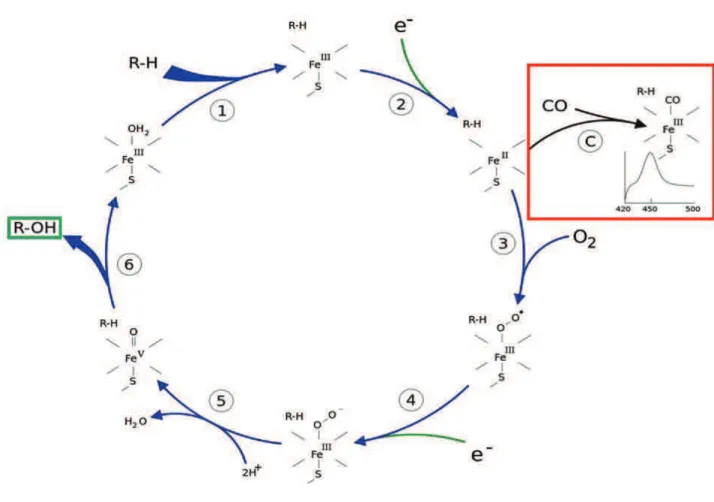
5 The name P450 originates from the reduced carbon monoxide (CO)-bound versus reduced difference UV-vis spectrum displayed by the P450 proteins which has its maximum at 450 nm (Omura and Sato, 1964) (Figure 3, square in red).
P450s are probably natures most versatile enzymes in terms of substrate range and molecular transformations (Munro et al., 2013). These enzymes can catalyse irreversible, rate-limiting steps, regio- and stereospecific oxygenations and oxidations in several branches of the plant metabolism (Morant et al., 2003; Schuler and Werck-Reichhart, 2003). The current list of reactions catalyzed is extensive and probably far from complete. It includes: hydroxylation, epoxydation, dealkylation, deamination, decarboxylation, isomerization and dimerization, C-C cleavage, ring expansion, ring opening, ring migration, ring coupling, dehydration and even reduction (Schuler et al., 1996; Werck-Reichhart and Feyereisen, 2000; Renault et al; 2014).
In higher plants, P450s plays crucial roles in the biosynthesis and/or catabolism of fatty acids (cutins and suberins), sterols and other terpenoids, amino acid-derived compounds (glucosinolates and cyanogenic glucosides), phenylpropanoids including lignin monomers, UV protectants (flavonoids, coumarins, sinapoyl esters) and pigments (anthocyanins), defense compounds/phytoalexins (including isoflavonoids, glucosinolates, terpenes, cyanogenic glucosides), hormones (gibberellins, abscisic acid, strigolactones, cytokinins, auxin, brassinosteroids), signalling molecules (jasmonic acid) as well as herbicide, insecticide and pollutants detoxification (Schuler and Werck-Reichhart, 2003; Powles and Yu, 2010; Renault et al., 2014).
Catalytically, they activate molecular oxygen (O2) inserting one of the atoms into a substrate bound in the active site, reducing the second oxygen atom into water. Hence P450s are monooxygenases (Bak et al., 2011; Meunier et al., 2004; Werck-Reichhart and Feyereisen, 2000).
The reaction can be summarized as follows (hydroxylation as an example)
Where, RH: substrate, NAD(P)H: electron donor, ROH: hydroxylated product.
A more detailed explanation of the catalytic cycle can be seen in Figure 3.
R-H +
O
2+ NAD(P)H+H
+R-
O
H + H
6
Figure 3: The P450 catalytic cycle.
See description in the text. In the red square a detail of the reduced carbon monoxide (CO) difference spectrum which has its maximum at 450 nm. (Image modified from "Medical gallery of David Richfield 2014". Wikiversity Journal of Medicine 1 (2). DOI:10.15347/wjm/2014.009. ISSN 2001-8762)
1- The substrate (R-H) binds to the active site of the P450, close to the heme group and on the opposite side of the heme-anchoring cysteine in the peptide chain.
2- The bound substrate induces a conformational change in the active site, displacing a water molecule usually bound as sixth ligand to the heme iron, and changing the state of the heme iron from low-spin to high-spin. This change favors the transfer of an electron from de electron donor NAD(P)H and the transition Fe+3 to Fe+2.
7 3- Molecular oxygen binds covalently to the distal axial coordination position of the reduced heme iron.
4- A second electron is transferred from NAD(P)H, reducing the dioxygen adduct to a negatively charged peroxo group in short-lived intermediate state.
5: The peroxo group formed in step 4 is rapidly protonated twice by local transfer from surrounding amino-acid side chains, releasing one molecule of water, and forming a highly reactive iron-oxo species.
6: Iron-oxo is the reactive species responsible for the substrate attack. Most often a hydrogen is abstracted from a closest position on the substrate, followed by an OH rebound, resulting in substrate hydroxylation. After the product has been released from the active site (R-OH), the enzyme returns to its original state, with a water molecule occupying the distal coordination position of the heme iron.
C: If carbon monoxide (CO) binds to reduced P450, the catalytic cycle is interrupted. This reaction yields the classic CO difference spectrum with a maximum at 450 nm.
Genes encoding the cytochromes P450s have been highly duplicated and new members have diverged enormously. As quoted in Renault et al, (2014), the amount of annotated plant P450s to date is 7512 which is significantly greater than seen in vertebrates (1461), insects (2137), fungi (2960) , bacteria (1042), Archae (27) and viruses (2) (Nelson, 2009). Furthermore it is the third largest family of plant genes after F-box proteins (692 genes in Arabidopsis) and receptor-like kinases (610 genes in Arabidopsis). Around 300 genes grouped in 50 families compose the CYPome of Angiosperms (Nelson and Werck-Reichhart, 2011).
There are 244 P450 genes and 28 pseudogenes in the Arabidopsis genome (Bak et al., 2011). The remarkable functional diversification showed by this enzymes in signaling, synthesis of biopolymers, formation of complex anatomical structures and in plant adaptation and defense; points to its relevance in plant metabolism (Nelson and Werck-Reichhart, 2011) and the necessity for further research to achieve full CYP exploitation (Renault et al.,2014).
8 Nomenclature
P450 has been classified into families and subfamilies. In plants there are so far 127 families grouped in 11 clans, including singlefamily and multiple-family clans (Nelson and Werck-Reichhart, 2011). P450s have been classified according to their protein homology and phylogenetic criteria (Nelson et al., 2006) with a 40 % of amino acid sequence identity for family membership and 55 % identity for a subfamily.
Name are assigned according to:
Where:
-CYP: cytochrome P450 -98: family number
-A: subfamily -3: specific protein
Further information can be found at http://drnelson.uthsc.edu/CytochromeP450.html.
P450 and Plant Defense
A worth mentioning number of P450 genes have been shown to be implicated directly or indirectly in plant defense responses against pathogens and pest, and, consequently, in disease resistance.
Their repercussion in plant defense was especially palpable when we became aware of all of the critical roles they play in pathways responsible for synthesizing hormones and signaling molecules, structural compounds and a vast array of secondary metabolites.
Their functions span through the metabolism of cutin, suberin and lignin, the metabolism of signaling molecules and hormones such as jasmonate, abscisic acid, gibberellins, auxin, strigolactones and brassinosteroids, and the metabolism of phytoalexins and phyoanticipins ( i.e secondary metabolites) such as glucosinolates, cyanogenic glucosides, alkaloids, phenylpropanoids, terpenoids and more. For instance, in Arabidopsis they are essential at a metabolic branch point between auxin and indole-glucosinolate biosynthesis pathways (Glawischnig, 2006; Bak et al., 2001; Dixon, 2001) that leads to the synthesis of plant defense molecules like camalexin and at the subsequent cascade of defense molecules of different sort and fortune as described and showed in Table 1. (Schuler et al., 2006).
A non-exhaustive list of P450s involved in defense and signaling in Arabidopsis thaliana can be seen in Table 1.
9 Table 1: Cytochrome P450 in defense and signaling in Arabidopsis thaliana.
Gene Accession number Pathway References
CYP707A1 CYP707A2 CYP707A3 CYP707A4
At4g19230 Abscisic acid
catabolism
Kushiro et al., 2004 Saito et al., 2004 Okamoto et al., 2006 Okamoto et al., 2009/2011 CYP72C1 At1g17060 Brassinosteroids/Triterpenoids
biosynthesis
Nakamura et al., 2005 Tkahashi et al., 2005 Turk et al., 2003 Thornton et al., 2010 CYP734A1 At2g26710 Brassinosteroids/Triterpenoids
catabolism Turk et al., 2005 Thornton et al., 2011 CYP85A1 CYP85A2 At3g30180 At5g38970 Brassinosteroids/Triterpenoids biosynthesis Kim et al., 2005 CYP90A1 CYP90B1 At3g50660 At5g05690 Brassinosteroids/Triterpenoids biosynthesis Ohnishi et al., 2012 CYP90C1 CYP90D1 At4g36380 At3g13730 Brassinosteroids/Triterpenoids biosynthesis Kim et al., 2005 Ohnishi et al., 2012 CYP71A12 CYP71A13 At2g30770 Camalexin biosynthesis Nafisi et al., 2007 Millet et al., 2010
CYP71B15 (PAD3) At3g26830 Camalexin
biosynthesis
Glazebrook and Ausubel, 1994 Zhou et al., 1999 Schuhegger et al., 2006 CYP79B2 CYP79B3 At4g39950 At2g22330
Camalexin and auxin biosynthesis
Hull et al., 2000 Mikkelsen et al., 2000 Glawischnig et al., 2004 CYP77A4 At5g04660 Cuticle , cutin, fatty acids Sauveplane et al., 2009 CYP86A2 At4g00360 Cuticle , cutin, fatty acids Xiao et al., 2004
Duan and Schuler,2005 CYP86A4
CYP77A6
At1g01600 At3g10570
Cuticle , cutin, fatty acids Duan and Schuler, 2005 Li-Beisson et al., 2009 Pinot and Beisson, 2011 CYP86A8 At2g45970 Cuticle , cutin, fatty acids Wellesen et al., 2001 CYP701A3 At5g25900 Gibberellins biosynthesis Helliwell et al., 1998
Davidson et al., 2003/2006 CYP714A1
CYP714A2
At5g24910 At5g24900
Gibberellins biosynthesis and catabolism Nelson et al., 2004 Zhang et al., 2011 CYP88A3 CYP88A4 At1g05160 At2g32440
Gibberellins biosynthesis Helliwell et al., 2001 Davidson et al., 2003/2006 CYP79A2 At5g05260 Benzyl-glucosinolates
biosynthesis
Wittstock and Halkier, 2000 CYP79F1
CYP79F2
At1g16400 At1g16410 Aliphatic glucosinolates biosynthesis
Hansen et al., 2001 Reintanz et al., 2001 Chen et al., 2003 CYP81F2 At5g57220 Indole-glucosinolates processing
upon attack
Bednarek et al., 2009 Clay et al., 2009 CYP83A1 At4g13770 Aliphatic glucosinolates
biosynthesis
Bak and Feyereisen, 2001 Chen et al., 2003 Hemm et al., 2003 Naur et al., 2003 CYP83B1 At4g31500 Indole-glucosinolates
biosynthesis
Bak et al., 2001
Bak and Feyereisen, 2001 Naur et al., 2003 CYP74A1
CYP74B2
At5g42650 Jasmonate /Oxylipins biosynthesis Laudert et al., 1996 Bate et al., 1998 CYP94B3 CYP94C1 At3g48520 At2g27690 Jasmonate conjugates catabolism Koo et al., 2011 Kitaoka et al., 2011 Heitz et al., 2012
10 Secondary Metabolism
Plants synthesize a vast array of organic compounds, referred to as secondary metabolites or natural products that are derived from plant primary metabolism and serve important adaptive functions to interact with or to adapt to the surrounding environment (Chapple et al., 1994; Wink, 2011; Kroymann, 2011).
The surroundings suppose an everyday challenge met by the plant, starting with its sessile nature and the lack of an authentic immune system (Jones and Dangl, 2006), that can only be counteracted with their capacity of synthetize an enormous variety of chemicals (Dixon, 2001; Bednarek et al., 2009; Wink, 2011).
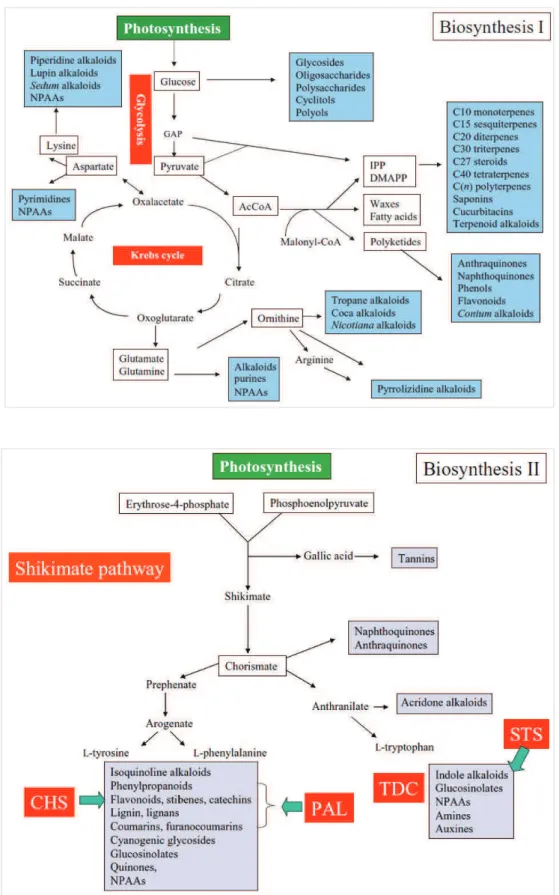
Secondary, now more often called specialized metabolites possess a high structural variety. They have in common low molecular weight in a diverse array of different chemical classes of compounds such as alkaloids, amines, cyanogenic glycosides, non-protein amino acids, glucosinolates, alkamides, peptides, lectins, terpenes, saponins, polyketides, phenolics and polyacetylenes (Winck, 2011) Illustrated in Figure 4 and Table 2.
11 from basic metabolic pathways, such as glycolysis, the Krebs cycle or the
shikimate pathway.
Figure 4: Main pathways leading to specialized metabolites precursors: glycolysis, the Krebs cycle or the shikimate pathway. From Wink, 2010.
12 They provide the plant with protection against pathogens (bacteria, fungi and viruses) and pests (insects and herbivores of all kinds, competing plants). They protect against UV light radiation and desiccation, and they can also play roles as signaling molecules: both allelochemicals and attractants for pollinators or seed dispersant (Dixon, 2001; Aharoni and Galili, 2011) (Table 2).
Specialized metabolites are often compartmentalized within vacuoles or in other specialized cellular compartments to avoid plant self-toxicity. Their modes of action include membrane disruption and pore formation (saponins, terpenoids, flavonoids), formation of physical barrier (lignin, waxes, cutin, flavonoids, amines), inhibition of DNA synthesis (cyanogenic compounds, alkaloids, flavonoids), inhibition of enzymes, nutrient and ion transport (cyanogenic glucosides, glucosinolates, alkaloids) , chelation (flavonoids), generation of ROS (flavonoids), inhibition and intervention in signal transduction processes (amines, peptides, carbohydrates) , inhibition of metabolism (alkaloids, tannins), growth retardation or disruption of the hormonal control of physiological processes (strigolactones, triterpenes, tetraterpenes) ( several authors, see Table 2).
The mode of action can be either direct or indirect. For instance, many compounds act directly on the pathogen/herbivore/neighbor, whereas others act indirectly via the attraction of organisms from other trophic levels that, in turn, protect the plant (volatiles from terpenoids and glucosinolates)(Mithofer and Boland, 2012)
Even though, by definition, primary metabolites are essential for plant survival, it is undeniable that secondary metabolites have relevant effect on fitness and yet plant survival (Aharoni and Galili, 2011).
It has been estimated that plants produce more than 200 000 different metabolites (D'Auria and Gershenzon, 2005; Fernie, 2007), and between 5000-20 000 metabolites within one single species (Wink, 2011). This rich diversity results from an evolutionary process driven by selection, through different plant lineages, when a particular compound was able to address specific needs in a given context (Dixon, 2001; Pichersky and Gang, 2000). Since organisms never exist alone, the continuous race between plants and environmental factors is a driving force for evolution and coevolution among all the cohabitant species.
13
Class Secondary metabolite
Abundance* Some examples Features References
Wi
th
N
Alkaloids 21000 theobromine, caffeine, nicotine atropine, solanine.
Defense mainly against herbivores and carnivores, but some cases against bacteria, fungi and viruses. Allelopathy.
-Denzel and Wink, 1993 - Katoh et al., 2005
- Freeman and Beattie, 2008 - Mithofer and Boland, 2012 Non-protein
amino acids
700 l-canavanine, GABA, l-DOPA, l-mimosine,
p-aminophenylalanine.
Herbivore repellent. Antimicrobial. Allelopathy. -Janzen et al., 2001 -Semar, 2011 -Huang et al., 2011 Amines 100 Several amine oxidases (copper amine
oxidases and flavin-containing amine oxidases). Polyamines: spermine, putrescine.
Against pathogen, virus and nematode infection (Involvement in wall reinforcement, HR, signaling defense)
-Walters, 2003 -Cona et al., 2006 -Sagor et al., 2009 Cyanogenic
glycosides
60 dhurrin, linamarin, amygdalin, lotaustralin, taxiphyllin, cyanohydrin, prunasin.
Pest deterrent.
Antifungal (aglycon). Allelopathy.
-Tattersall et al., 2001 -Gladow and Woodrow, 2002 -Ballhorn et al., 2005 -Zagrobelny et al., 2007 -Semar, 2011 Glucosinolates and indole derivatives 150 camalexin, indole/aliphatic/glucosinolates
Anti-herbivores. Antimicrobial effect.
Effect indirect: volatiles releases from glucosinolates to attract insects enemies. Allelopathy.
-Norsworthy et al., 2007 -Hopkins et al., 2009 -Bednarek et al., 2009 -Clay et al., 2009
-Wittstock and Burow,2010 -Semar, 2011
Alkamides 150-200 N-isobutyl decanamide (affinin) Allelochemical effect. Antimicrobial effect. (against bacteria and fungi)
-Tripathy et al., 1999 -Lait et al., 2003 -Mendez-bravo et al., 2011 Peptides and polypeptides (AMPs, LTPs)
2000 systemin, thionins, defensins, hevein like peptides, snakins.
Amplifying signals. Against herbivores and pathogens. -Osborn et al., 1995 -Garcia-Olmedo et al., 1998 -Graham et al., 2008 -Stotz et al., 2013 W it h o u t N
Monoterpenes 2500 menthol, pyrethrins pinene, limonene, etc. (essential oils)
Protection against insects, fungi, bacteria.
Attractant to natural enemies of insects. Allellopathy.
-Turlings et al., 1990, 1995 -Davies et al.,2007 -Maffei et al., 2011 -Piesik et al., 2011
14
bergamotene, costunolide,
parthenolide, artemisinin, capsidiol, polygodial ( essential oils)
entomopathogenic nematodes. Allelopathy. Phytoalexins. -Piesik et al., 2011 -Huang et al., 2012 -Kollner et al., 2013 Diterpenes 2500 gossypol, momilactones, oryzalexin,
gibberelic acid
Phytoalexin (antifungal and antibacterial). -Cartwright et al., 1981 -Akatsuka et al., 1983 -Peters et al., 2006 -Williams et al., 2011 -Singh and Sharma, 2014 Triterpenes 5000 digitonin, saponins
(avenacin, tomatine, avenacosids) citronella, brassinosteroids
Antimicrobial properties. Mimic insect hormones, mortality of larvae and adults. Anti-herbivores.
Phytoalexins/Phytoanticipins.
-Papadopouloou et al., 1999 -Mert-Türk, 2006
-Kreis and Müller-Uri, 2010 -Gonzalez-Coloma et al., 2011 Tetraterpenes 500 carotenes, xanthophylls, strigolactone Antioxidant, responsible of color in fruits, flowers, leaves
(Pollinators and seed dispersants). Interaction with hormones.
-Ramel et al., 2012 -Torres-Vera et al., 2014 Flavonoids
Tannins Anthocyanins
5000 catechin, lutein, flavones, rutin, kaempferol, narigenin. isoflavonoids, sakuratenin, resveratrol
Flower, fruits and leaf color, antioxidants, UV- protectant. Antimicrobial properties. Allelopathy. Toxic for insects and animals (Tannins). (Symbiosis)
-Snyder et al., 1990 -Chapple et al., 1995 -Skadhauge et al., 1997 -Chang et al., 2011 -Mierziak et al., 2014 Phenylpropanoids Lignin Coumarins, Furanocoumarins
2000 lignin, phenolic esters (chlorogenic acid), phenolamides (caffeic acid)
medicarpin, scopoletin, psoralen
Structure, protection, desiccation Defenses induced or preformed Antimicrobial. Allelopathy -Rice-Evans et al., 1997 -Costet et al., 2002 -Dixon et al., 2002 -Chong et al., 2002 -Razavi, 2011 Fatty acids ,Oxylipins
1500 cutin and waxes, cuticle jasmonic acid
Prevent desiccation
Signaling. Barrier against insects and microbes. Antimicrobial
-Blée, 2002
-Farmer et al., 2003 -Shah et al., 2005
-Kachroo and Kachroo, 2009 -Pinot and Beisson, 2011
Polyketides 750 anthraquinones (emodin) Against herbivores -Kim et al., 2004
-Godard et al., 2009 Carbohydrates 200 chitinases, glucanases, lectins Elicitor activity -Mauch et al., 1988
-Aziz et al., 2003 -Klarzynski et al., 2003 -Gauthier et al., 2014
15 Secondary metabolites can be stored as complex mixtures of inactive products that can be activated in case of necessity (Wink, 2011). Some are constitutive; others are induced after attack. Indeed, they can be synthesized during normal growth and development as preformed antimicrobial compounds (phytoanticipins) or accumulate de novo only in response to pathogen attack or stress (phytoalexins) (Papadopoulou et al., 1999). Both concepts have nothing to do with their chemical structure or the implicated chemical pathway, but with the way they are produced as it is described below (Figure 5). Hence, some compounds may be phytoalexins in some species and phytoanticipins in others (Dixon, 2001).
Phytoalexins and phytoanticipins
Phytoalexins are a heterogeneous class of specialized metabolites of low molecular weight that are synthetized de novo in response to abiotic or biotic stress. Therefore the synthesis of phytoalexins requires transcriptional/translational changes after pathogen detection and trafficking of substances to the infection site after pathogen infection. It is a process that costs extra energy to the plant (Flors and Nonell, 2006) but still very convenient since carbon and energy sources are redirected into phytoalexin synthesis only at the beginning of infection and only at the local sites , as it will be describe later (Grayer and Kokubun, 2001).
The term Phytoalexin was coined by Müller and Börger in 1940 and initial definition remains almost the same, except for the fact that instead of assuming ipso facto that they are synthesized for plant disease resistance , they are now rather defined as synthesized for plant defense, because their full mode of action and impact is not always well understood or easy to prove (Paxton, 1981, VanEtten et al., 1994; Gonzalez Lamothe, et al., 2009).
They serve, as many of the typical mechanisms of defense, as a protection for the plant against later situations of stress.
Phytoalexins have several interesting features, which can be summarized as follows:
1) They are synthesized very quickly, within hours of microbial attack.
2) They are generally restricted to a local area around the site of infection.
3) They are usually lipophilic, and therefore can cross membranes efficiently (Guest and Brown, 1997; Grayer and Kokubun, 2001). As methylation enhances its lipophilic properties, methylated phytoalexins are the most fungitoxic (Jeandet et al., 2014).
16 5) Phosphorylation, defense related genes, calcium sensors, elicitors, hormone signaling, ROS, sugars (as endogenous signals), and of course the nature of the infecting pathogen are regulators of phytoalexin biosynthesis (Jeandet et al., 2014).
6) They toxicity is non selective, which means that they can be toxic to a broad spectrum of fungi and bacterial pathogens (prokaryotic and eukaryotic).
7) They have low specificity (biocide and/or biostatic effects) and are less toxic than many know fungicides. Effective doses are within 10-5 to 10-4 M (Jeandet et al., 2014).
8) They can be detoxified by highly virulent strains (Smith et al; 1996, Van Etten et al., 1989; Pedras et al., 2005).
9) They are synthesized from a redirection of primary metabolism precursors, depending on de novo expression of genes encoding enzymes involved in biosynthetic pathways.
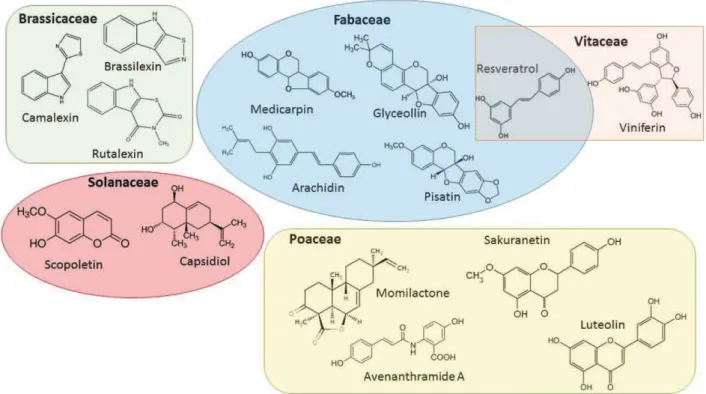
10) They are chemically diverse and some plant families are often associated with specific chemical groups (Figure 5). For example sesquiterpenoids and polyacetylenes with solanaceae; isoflavonoids with leguminosae; sulfur-containing indoles with Cruciferae. Cereals rather produce cyclic hydroxamic acids and diterpenes, (Grayer and Kokubun, 2001; Pedra et al., 2005; Mazid et al., 2011; Jeandet et al., 2014).
11) The three most characteristics pathways for phytoalexin biosynthesis are: phenylpropanoic pathway, the terpenoid pathway, the indole phytoalexin pathway (Jeandet et al., 2014)
12) They can hinder different aspects of the host-pathogen interaction:
a) Propagules, causing loss of motility and deformation of hyphae, germ tubes, conidia, etc.
b) Cellular response, by alterations in cell shape, causing cytoplasmic granulation and leaking, membrane burst and disintegration (probably by tubulin polymerization).
c) Physiology, by affecting sugar intake, respiration (by disturbing electron transport and by phosphorylation events) (Jeandet et al., 2014).
17 Phytoanticipins (VanEtten et al., 1994) are low molecular weight compounds present in plants that have antimicrobial effects. Unlike phytoalexins this compounds are either pre-existent to the pathogen attack, or rapidly formed from a pre-existent compound upon attack (release from an aglycone or from a conjugate). Some of them are found at the plant surface, some others are stored in vacuoles or organelles and are activated after the plant is challenged by a pathogen attack triggering defense responses. Saponins are among the most ubiquitous phytoanticipins. Two well-studied examples are avenacin A-1 (from Oat) and tomatine (from Tomato) (Mert-Türk, 2006).
Figure 5: Phytoalexins from different plant families exemplifying structure diversity. Based in Ahuja et al., 2012.
18 Camalexin, the main phytoalexin from Arabidopsis
Camalexin (3-thiazol-2-yl-indole) is the main phytoalexin of Arabidopsis and some others crucifers (Glawischnig, 2007).
It can be accumulated in the infected tissues as a defense response that limits the growth of a wide range of pathogens both biotrophs and necrotrophs (Ferrari et al., 2003; Glawischnig et al., 2007), but can also be induced by microbe associated molecular patterns (MAMPs) and abiotic stresses (Mert-Turk et al., 2003; Glawischnig et al., 2004; Kishimoto et al., 2006; Denoux et al., 2008; Schuhegger et al., 2006; Böttcher et al., 2009)
Camalexin acts as a part of the plant defense when pathogen triggered immunity (PTI) or effector triggered immunity (ETI) fail, in extenso genotypes with functional R genes has been demonstrated to accumulate less camalexin (Mert-Türk et al., 2003; Narusaka et al., 2004; Persson et al., 2009).
In connection to abiotic stress, it has been shown that wounding per se cannot induce camalexin accumulation, but instead can prime the plant for a successful accumulation of the phytoalexin after being challenged with a pathogen like Botrytis cinerea (Kishimoto et al., 2006; Chassot et al., 2008).
Other inducing stimuli have been described in the literature, for example cell wall fragments, oligogalacturonides (OGs), chitosan and flagellin (flg22), which in most of cases induced the expression of camalexin biosynthetic genes, but with no obvious camalexin accumulation ( Ahuja et al., 2012; Ferrari et al., 2013) ( there are some exception for flg22, shown in Table 3).
A more detailed list of pathogens and elicitors triggering camalexin biosynthesis in Arabidopsis thaliana can be found in Table 3.
Camalexin accumulation is essentially confined to the infection site (as is expected for a phytoalexin) and this spatial distribution is associated with a strong induction of biosynthetic genes in the infection zone (Kliebenstein et al., 2005; Schuhegger et al., 2007).
Usually camalexin accumulation is concomitant to lesion formation, however the review of Glawischnig et al., (2007) mentions the work of Raacke et al., (2006) in which camalexin was found in leaves challenged with an autoclaved suspension of yeast without lesion formation. Ahuja et al., (2012) also quoted this example and adds the examples of fusaric acid and victorin, both fungal toxins, capable of inducing camalexin accumulation with no lesion formation.
19 All Arabidopsis accessions and ecotypes were shown to accumulate camalexin, and the observed variations in the rate of accumulation and final concentration were more related to the class of stimuli or pathogen (even strain) than to the genotype (Glawischnig et al., 2007; Ahuja et al., 2012).
In Arabidopsis thaliana, camalexin is involved in defense against Botrytis cinerea and Alternaria brassicicola (Kagan and Hammerschmidt, 2002; Denby et al., 2004; Kliebenstein et al., 2005; Schuhegger et al., 2007 ), but avoidance (via ABC transporters) or active degradation was also reported for resistant fungal strains (Pedras et al., 2002; 2011).
Camalexin usually accumulates in leaves, but it has also be found in root exudates (Bednarek et al., 2005; Glawischnig et al., 2007; Millet et al., 2010).
Camalexin has all the properties of a typical phytoalexin, however, since is first isolation and description in 1991 (Browne et al., 1991), it is also gaining growing attention due to its health promoting attributes such as a moderate antifungal and bacteriostatic effects, as well as its antiproliferative and cancer chemopreventive properties (Mezencev et al., 2003; 2009; Smith et al., 2013; 2014).
Camalexin was, for example, shown to have cytostatic and cytotoxic effects against Trypanosoma cruzy (Mezencev et al., 2009), T-leukemia cells (Mezencev et al., 2003; 2011), prostate cancer cells (Smith et al., 2013; 2014) and human breast cell line in mammary tumors (Moody et al., 1997) due to oxidative stress, which causes apoptosis through ROS generation.