HAL Id: hal-01982897
https://hal.archives-ouvertes.fr/hal-01982897
Submitted on 16 Jan 2019HAL is a multi-disciplinary open access
archive for the deposit and dissemination of sci-entific research documents, whether they are pub-lished or not. The documents may come from teaching and research institutions in France or abroad, or from public or private research centers.
L’archive ouverte pluridisciplinaire HAL, est destinée au dépôt et à la diffusion de documents scientifiques de niveau recherche, publiés ou non, émanant des établissements d’enseignement et de recherche français ou étrangers, des laboratoires publics ou privés.
Viscous friction of squeezed bubbly liquid layers
Romain Morini, Xavier Chateau, Guillaume Ovarlez, Olivier Pitois, Laurent
Tocquer
To cite this version:
Romain Morini, Xavier Chateau, Guillaume Ovarlez, Olivier Pitois, Laurent Tocquer. Viscous friction of squeezed bubbly liquid layers. Soft Matter, Royal Society of Chemistry, 2018, 14 (41), pp.8372-8377. �10.1039/C8SM01335G�. �hal-01982897�
1
Viscous friction of squeezed bubbly liquid layers
Romain Morini1, Xavier Chateau1, Guillaume Ovarlez1,2, Olivier Pitois1,*, Laurent Tocquer1
1
Université Paris Est, Laboratoire Navier, UMR 8205 CNRS - Ecole des Ponts ParisTech - IFSTTAR, 5 bd Descartes, 77454 Marne-la-Vallée Cedex 2, France
2
Univ. Bordeaux, CNRS, Solvay, LOF, UMR 5258, F-33600 Pessac, France
* corresponding author
Abstract:
Shear viscosity of bubbly liquids is known to depend on both the gas volume fraction and the capillary number. Here we study the impact of confinement on their behavior by investigating the viscosity of semi-dilute bubbly liquid layers confined between two plates and characterized by a ratio of the undeformed bubble diameter to the layer thickness equal or larger than unity. For all the studied confinement ratios viscosity is shown to be smaller than the viscosity of the suspending liquid for capillary numbers larger than 0.1. Measurements of bubble deformations show that this behavior is related to bubble stretching in the direction of shear induced flow. In the limit of high capillary numbers, viscosity reaches values predicted for unconfined bubbly liquids. On the other hand, our results for smaller capillary numbers, i.e. within the range 0.001-0.1, reveal a non-monotonic variation of the viscosity as a function of the confinement ratio, exhibiting a well-defined maximum value for ratio close to 1.8. This behavior differs strongly from the reference case of unconfined bubbly liquid, and it is shown to result from both bulk and wall drag forces for the squeezed bubbles.
1. Introduction
Bubbly liquids are complex fluids encountered in numerous industrial applications or natural phenomena, such as bubble-bearing magmas 1. Within the industrial context, those fluids are produced as precursors for porous materials, where air is used for weight reduction or for thermal insulation purposes. On the different note, recent application takes advantage of air lubrication for saving fuel consumption of ships by injecting microbubbles below the hull 2. For each case, rheology of the bubbly liquid is an important issue for the design of efficient processes.
Several studies have increased our knowledge on such complex fluids. The result of Einstein 3 for the viscosity 𝜇 of dilute suspensions of solid spheres suspended in a Newtonian liquid of viscosity 𝜇0, i.e. 𝜇 𝜇⁄ 0≃ 1 +52𝜙, was generalized by Taylor
4
for the case of fluid suspensions: coefficient 𝑥 = 5 2⁄ in Einstein’s formula was modified for non-deformed droplets, i.e. 𝑥 = 5 2⁄ × (𝜇′+ 2𝜇0⁄ ) (𝜇5 ⁄ ′+ 𝜇0), where 𝜇′ is the shear viscosity of the suspended fluid. For gas bubbles 𝜇′⁄𝜇0 ≪ 1, the coefficient becomes unity and relative viscosity becomes 𝜇 𝜇0⁄ ≃ 1 + 𝜙, i.e. 𝑥 = 1. Note that, as for Einstein’s formula, this formula describes the viscosity in the dilute regime. Taylor 5 accounted also for drop deformations with respect to the spherical shape and he showed how drops deform as a function of the capillary number 𝐶𝑎 = 𝑅𝜇0𝜖̇ 𝜎⁄ , where 𝜖̇ is the applied shear rate, 𝑅 the undeformed drop radius and 𝜎 the surface tension of the fluid interface. 𝐶𝑎 quantifies the relative magnitudes of viscous forces (that act to stretch the drop) to capillary forces (that act to restore to spherical shape), i.e. drops can be considered as spheres in the limit of small capillary numbers. After Frankel & Acrivos 6 the relative viscosity of fluid suspensions is known as a function of both 𝐶𝑎 and 𝜙. It has been shown that 𝜇 𝜇⁄ decreases from 1 + 𝜙 for small capillary numbers towards 1 − 5𝜙 30 ⁄ for large capillary numbers. This behavior is related to drop or bubble stretching and alignment in the flow direction as 𝐶𝑎 increases, as studied in detail for single drops/bubbles 7–9
2 It is to say that bubble size sets the length scale below which results discussed above become irrelevant. Development of microfluidics has supported research on the effect of confining walls. It has been shown that drop deformation is increased as the drop/bubble size is close to the thickness of the sheared liquid layer (see 10 for a review). On the other hand, the shear viscosity of such confined bubbly liquid has not been studied so far. Here we perform rheology experiments on bubbly liquid layers confined between two plates and characterized by a ratio of the undeformed bubble diameter D to the layer thickness equal or larger than unity. In the following we show that prediction of models for viscosity of unconfined bubbly liquids is relevant for large capillary numbers, but bubble friction at wall dominates at small capillary numbers.
2. Materials and methods
The liquid used in this study is a calibration oil (PDMS oil, Brookfield) with the shear viscosity 𝜇0 = 4.680 Pa.s, the density 𝜌 = 0.97, and the surface tension with air 𝜎 = 20 mN/m. Inclusions are made of air.
2.1. Experimental setup
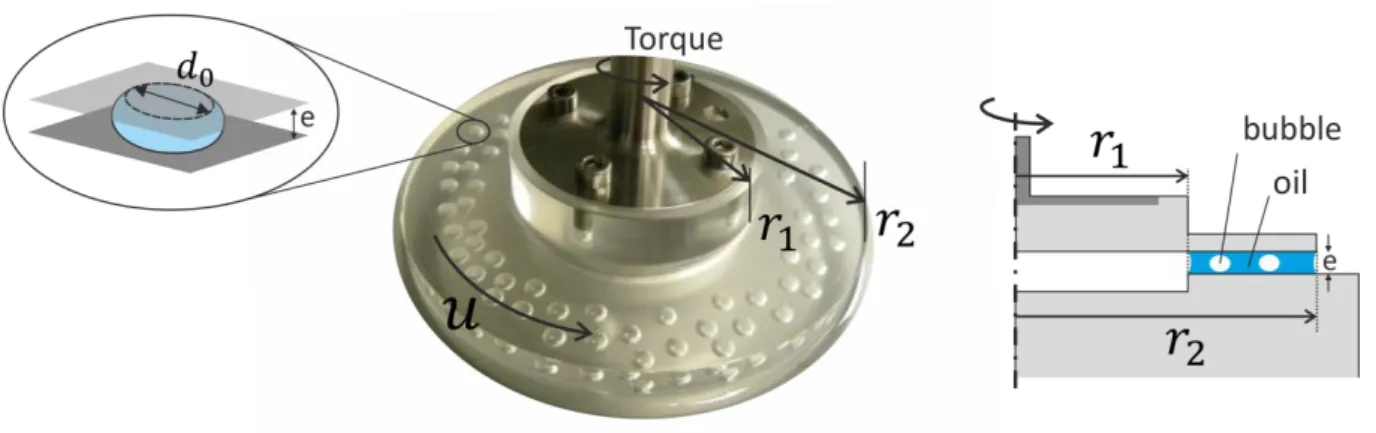
The experimental setup can be described as follows: two transparent (PMMA) plates are used to define the shear cell geometry in a rheometer (Kinexus ultra+, Malvern). The bottom plate is fixed and the upper plate is attached to the axis of the rheometer. A cavity has been made in the bottom plate (see figure 1) so the shear geometry is an annular area of thickness 𝑒 (gap) and width (𝑟2− 𝑟1), or area 𝑆 = 𝜋(𝑟22− 𝑟12), with 𝑟1 = 20.5 mm and 𝑟2 = 42 mm. As shown in the following, the advantage of the annular geometry as compared to a parallel plate geometry is to reduce the range of shear rates, and thus the range of capillary numbers, within the gap. The liquid is introduced within the shear area and it is held thanks to capillary forces provided that 𝜌𝑔𝑒 ≲ 2𝜎 𝑒⁄ , i.e. 𝑒 ≲ √2ℓ𝑐≈ 2 mm, where ℓ𝑐 = √𝜎 𝜌𝑔⁄ ≈1.4 mm is the capillary length.
Figure 1: Setup used for the study. Calibrated bubbles are inserted into the annular liquid layer held by capillarity between the two plates of the rheometry cell. The layer width is (𝑟2− 𝑟1). At rest and
for sufficiently small values of the gap (e), the bubbles are flattened over a contact area 𝜋𝑑02⁄ and 4
they have a barrel shape. The upper plate is rotated thanks to an applied torque and the plate velocity is measured. Parameters corresponding to the picture are: gas volume fraction 𝜙 = 0.075,
gap 𝑒 = 1 mm, and undeformed bubble diameter 𝐷 = 3.12 mm.
Bubbles are introduced by using calibrated glass capillaries connected to syringes. Capillaries are first filled with oil and an appropriate withdraw makes enter a volume V𝑏 of air. Then, each capillary is introduced into the liquid of the shear cell and a unique bubble of volume V𝑏 is formed by
3 pushing air with oil contained in the syringe. This procedure is repeated in order to introduce 𝑛 bubbles.
Depending on V𝑏 and 𝑒 the bubbles are more or less flattened and take a barrel shape with 𝑑0 the diameter of the flattened discus (see figure 1). For such a configuration the diameter of the squeezed bubble is 𝑎𝑠= 𝑑0+ 𝑒 (see also figure 3). Note that buoyancy forces tend to make the bubbles more flattened at the top plate than at the bottom plate. The magnitude of this effect can be estimated through the comparison of the ratio of the hydrostatic pressure 𝜌𝑔𝑒 with the squeezed bubble capillary pressure, i.e. 𝜎(2 𝑒⁄ + 2 (𝑑⁄ 0+ 𝑒)). For 𝐷 ≫ 𝑒 the bubble pressure simplifies, i.e. 2𝜎 𝑒⁄ , and the ratio writes 𝜌𝑔𝑒2⁄ . Within our range of values for the gap, this ratio is significantly 2𝜎 smaller than unity, which indicates that the effect of buoyancy can be neglected. This is not true for 𝐷 ≈ 𝑒. For such a situation and within the range of investigated bubble sizes, the diameter of the contact area of the static bubble is given by11: 𝑑0⁄ ≈ (𝐷 3𝐷 ⁄ ℓ𝑐)1 2⁄ . We obtain 𝑑0⁄ ≈ 0.8, and this 𝐷 means that the vertical size of the bubble is reduced by about 20%. In the following we will focus mostly on situations corresponding to 𝐷 > 𝑒.
From the geometry of a squeezed bubble, having a diameter 𝐷 in the undeformed configuration, the bubble volume writes (cylindrical coordinates): V𝑏 = 2𝜋 ∫0𝑒 2⁄ (𝑑0⁄ +2 (𝑒2⁄ − 𝑧4 2)1 2⁄ )2𝑑𝑧. Therefore, V
𝑏 = 𝜋𝐷3⁄ = 𝜋𝑑6 02𝑒 4⁄ + 𝜋2𝑑0𝑒2⁄ + 𝜋𝑒8 3⁄ . By introducing 6 𝑑̃0= 𝑑0⁄ and the confinement parameter: 𝐷
𝜆 =𝐷𝑒 (eq.1)
this equation becomes: 2𝑑̃02⁄ + 𝜋𝑑̃𝜆 0⁄𝜆2+ 4(1 𝜆⁄ 3− 1) 3⁄ = 0. The reduced diameter of the flattened area is:
𝑑̃0=𝑑0 𝐷 = 𝜆 4(− 𝜋 𝜆2+ √( 𝜋 𝜆2) 2 −32 3𝜆( 1 𝜆3− 1)) (eq.2)
The gas volume fraction of the bubbly liquid is set by the number and the geometry of the bubbles:
𝜙 = 𝑛𝜋𝐷6𝑒𝑆3 (eq.3)
From the practical point of view, significant coalescence events were observed for 𝜙 values larger than 0.075 so the latter value was chosen for studying the maximal effect of bubbles on the viscosity.
2.2. Rheometry
A torque ℳ is applied on the upper plate so the average shear stress exerted on the bubbly liquid is:
〈𝜏〉 =2𝜋(𝑟3ℳ
23−𝑟13) (eq.4)
The resulting angular velocity 𝜃̇(𝑡) is measured as a function of time. Local and average shear rates are given respectively by:
4 〈𝜖̇〉 =2𝜋 ∫ 𝑟𝜖̇𝑑𝑟𝑟1𝑟2 2𝜋 ∫ 𝑟𝑑𝑟𝑟1𝑟2 = 2𝜃̇ 3𝑒( 𝑟12+𝑟1𝑟2+𝑟22 𝑟1+𝑟2 ) (eq.6)
where 𝑟 is the radial coordinate. The maximum relative variation of the shear rate in the studied bubbly liquid is (𝜖̇(𝑟2) − 𝜖̇(𝑟1)) 〈𝜖̇(𝑟)〉⁄ = 0.67. The capillary number is also expected to exhibit a small variation as a function of 𝑟: 𝐶𝑎(𝑟) = 𝜇0𝜖̇(𝑟)𝑅 σ⁄ . Of course the flow of the suspending fluid is not uniform but it is natural to assume that the order of magnitude of the stress experienced by the bubble is that of the suspending fluid sheared at the average shear rate. In the following we refer to the average value:
𝐶𝑎 =𝜇0〈𝜖̇〉𝑅
𝜎 (eq.7)
The ratio of the shear stress and the average shear rate provides the value for the apparent shear viscosity of the confined bubbly liquid:
𝜇 =〈𝜏〉
〈𝜖̇〉 (eq.8)
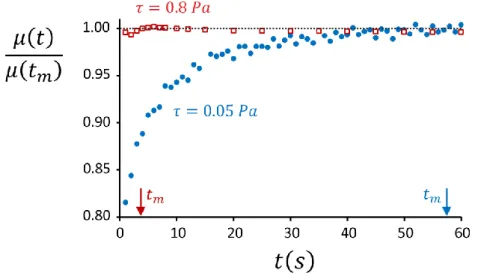
Measurements show that it takes some time for the shear viscosity to reach (possibly) a stationary value (see figure 2). This behavior is related to the transient shear-induced bubble deformation, has already observed for drops by Sibillo et al. 12. For the present study, one can consider that development of the drag force exerted by bubbles on plates requires sufficient displacement of the plates, which is expected to be of the order of the bubble radius 𝑅, and which corresponds to a time 𝑡𝑚≈ 𝑅 〈𝜖̇〉𝑒⁄ . As 〈𝜖̇〉 ≈ 〈𝜏〉 𝜇⁄ , the time 𝑡0 𝑚 is given by 𝜇0𝑅 〈𝜏〉𝑒⁄ . Estimated times 𝑡𝑚 for 𝜏 = 0.05 Pa and 𝜏 = 0.8 Pa are respectively 60s and 4s, which is consistent with evolutions reported in figure 2, showing times for which viscosity either reaches a stationary value or start to evolve due to bubble coalescence events. Indeed, for 𝑡 ≫ 𝑡𝑚 several coalescence events can make viscosity evolve (see the curve 〈𝜏〉 = 0.8 Pa for example, where a slight decrease is observed for times larger than 𝑡𝑚).
Figure 2: Typical example for the shear viscosity 𝜇 measured as a function of time (𝜙 = 0.02, 𝜆 = 1.56).
𝜇(𝑡) is divided by the value measured at time 𝑡𝑚 ≈ 𝜇0𝑅 〈𝜏〉𝑒⁄ , i.e. 𝜇(4𝑠) ≅ 4.90 Pa.s and 𝜇(60𝑠) ≅ 5.13 Pa.s for 〈𝜏〉 = 0.8 Pa and 〈𝜏〉 = 0.05 Pa respectively. For 𝑡 ≪ 𝑡𝑚 plates displacement is
not sufficient for the bubbles drag force to be fully developed. For 𝑡 ≫ 𝑡𝑚 shear viscosity may evolve
as a consequence of several coalescence events (see the slow evolution of the viscosity ratio for 〈𝜏〉 = 0.8).
5
2.3. Bubble deformations
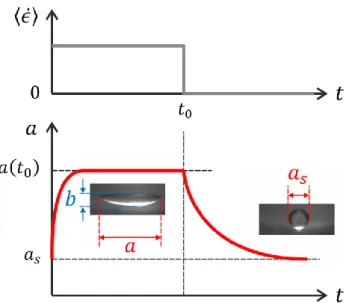
Figure 3: Measurement of bubble deformations. Top: Shear sequence applied to a single bubble. Bottom: Description of bubble shape measurements performed during the two stages of the shear
sequence.
Transparency of the upper plate allows for bubble deformations to be measured by using a camera. We performed experiments with unique bubbles subjected to the shear sequence presented in figure 3: (1) a given shear rate 〈𝜖̇〉 is imposed in order to observe the stationary motion and deformation of the bubble, then (2) we set 〈𝜖̇〉 = 0 as the bubble enters the field of vision of the camera.
For each stage the bubble geometry is characterized by the two lengths 𝑎 and 𝑏 (see figure 3). Note that stage (1) is characterized by a value of capillary number given by equation 7, and stage (2) corresponds to the bubble relaxation process from the stretched configuration 𝑎(𝑡0) to the symmetrical configuration of the bubble at rest: 𝑎 = 𝑏 = 𝑎𝑠.
3. Results
Results for the apparent shear viscosity 𝜇 are presented in figure 4 for two 𝜙 values, i.e. 0.02 and 0.075. It is shown that for all the studied 𝜆 values, 𝜇 𝜇0⁄ > 1 for 𝐶𝑎 ≲ 0.1 and 𝜇 𝜇0⁄ < 1 for 𝐶𝑎 ≳ 0.1. It is however to note that whereas the different curves 𝜇 𝜇⁄ 0= 𝑓(𝐶𝑎) gather for large 𝐶𝑎 values, strong differences are observed at small 𝐶𝑎 values. First of all, the effect of 𝜆 is not monotonic: 𝜇 𝜇0⁄ increases for 1 < 𝜆 ≲ 2 then decreases for 𝜆 ≳ 2. This behavior can be observed for both 𝜙 values. The maximum 𝜇 𝜇0⁄ value is therefore obtained for the smallest studied 𝐶𝑎 value and for 𝜆 ≈ 2: 𝜇 𝜇0⁄ ≈ 1.12 and 𝜇 𝜇⁄ 0≈ 1.5 for 𝜙 = 0.02 and 𝜙 = 0.075 respectively. It is interesting to compare those results to the reference case of unconfined bubbly liquids. We refer to the first order expression proposed by Frankel and Acrivos 6:
6 𝜇
𝜇0≅ 1 + (
1−125𝐶𝑎2
1+(65𝐶𝑎)2) 𝜙 (eq.9)
Note that in the limit of small 𝐶𝑎 values 𝜇 𝜇0⁄ ≅ 1 + 𝜙, and in the limit of large 𝐶𝑎 values 𝜇 𝜇⁄ 0≅ 1 − 5𝜙 3⁄ . Those limits have been plotted in figure 4 and they show to be close to our data only for large Ca values (for all 𝜆 values) and small Ca value in the case 𝜆 ≈ 1.
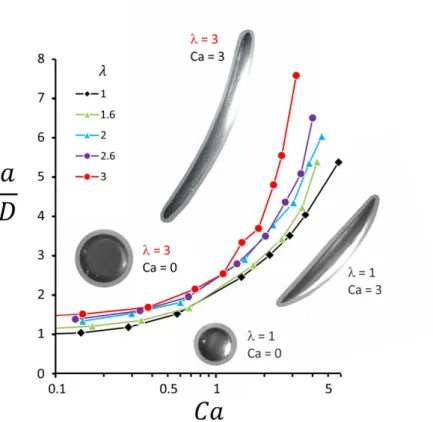
Results for bubble deformations 𝑎 𝐷⁄ induced by steady shear are presented in figure 5. Evolution of deformations as a function of the capillary number can be described as follows: (1) for 𝐶𝑎 ≲ 0.1 bubble deformation is not significant, i.e. 𝑎 𝐷⁄ ≈ 𝑎𝑠⁄ . (2) For 𝐶𝑎 ≲ 1.5 bubble 𝐷 deformations follow the same trend, i.e. an almost affine increase with the capillary number. (3) For 𝐶𝑎 ≳ 2 the confinement parameter has a significant influence on the deformation, i.e. for a given 𝐶𝑎 value, bubbles are all the more deformed that confinement is strong. Typical example for bubble relaxation process right after stopping the shear is shown in Figure 6 (Inset). The kinetics for such a process is shown to be correctly described by an exponential decay with a characteristic time 𝑡𝑐(𝜆). This behavior is reminiscent of the behavior of unconfined bubbles; this is why we plot the measured values 𝑡𝑐(𝜆) reduced by the characteristic time corresponding to unconfined bubbles, as measured by 9: 𝑡𝑐(0) ≅ 0.75 𝜇0𝐷 𝜎⁄ . Note that this reduction allows for the results obtained with different bubble sizes to be plotted on the same graph. Evolution for 𝑡𝑐(𝜆) 𝑡⁄ 𝑐(0) shows three regimes as a function of 𝜆: (1) for small 𝜆 values the relaxation time is very close to 𝑡𝑐(0). (2) The increase of 𝑡𝑐(𝜆) is moderate for 1 ≲ 𝜆 ≲ 2 . (3) A strong increase is observed for 𝜆 ≳ 2. In the latter regime, relaxation times are given by the following equation: 𝑡𝑐(𝜆) 𝑡⁄ 𝑐(0)= 1 + 5.5(𝜆 − 1.5). It is interesting to note that the reference relaxation time is increased by a factor 10 as 𝜆 = 3.
7
Figure 4: Dimensionless shear viscosity of confined bubbly liquids as a function of the capillary number with (a) 𝜙 = 0.02 and (b) 𝜙 = 0.075, for several values of the confinement parameter
𝜆 = 𝐷 𝑒⁄ . Dashed lines show bounds for unconfined bubbly liquids, i.e. 𝜇 𝜇⁄ 0≈ 1 + 𝜙 for small Ca
8
Figure 5: Bubble deformation expressed as the length 𝑎 of the bubble as seen from above (see figure 3) divided by the diameter 𝐷 of the undeformed bubble, as a function of the capillary number for several values of the confinement parameter 𝜆. Pictures show the bubbles at rest (Ca = 0) and during
stationary flow (Ca = 3).
Figure 6: (Inset) Kinetics of the relaxation process for a bubble initially stretched between two plates. The measured parameter is the length 𝑎(𝑡) as shown in figure 3, for 𝜆 = 2. Time is reduced by the
characteristic time 𝑡𝑐(𝜆) that allows fitting the exponential decay to the data: (𝑎(𝑡) − 𝑎𝑠) (𝑎(𝑡⁄ 0) − 𝑎𝑠)= 𝑒𝑥𝑝(− (𝑡 − 𝑡0) 𝑡⁄ ), where 𝑎𝑐 𝑠 is the length measured at static
9
equilibrium.
(Main figure) Characteristic time for the relaxation process of initially elongated bubbles between two plates as a function of confinement parameter 𝜆, for three values of bubble diameter 𝐷. The time is
divided by the relaxation time measured for unconfined bubbles, i.e. 𝑡𝑐(0) ≅ 0.75 𝜇0𝐷 𝜎⁄ 9. The
dashed line corresponds to the flowing equation: 𝑡𝑐(𝜆) 𝑡⁄ 𝑐(0)= 1 + 5.5(𝜆 − 1.5).
4. Discussion
Results show that the shear viscosity of confined bubbly liquids is controlled by the capillary number according to two regimes separated by the value 𝐶𝑎 ≈ 0.1. First, we focus on the regime 𝐶𝑎 ≲ 0.1, for which the bubble shape is close to the static equilibrium shape (see figure 5) described by equation 2. Our purpose is to reproduce the non-monotonic behavior of the viscosity as a function of the confinement parameter. Bubbles contribution to the stress can be estimated through their drag force. For 𝜆 ≈ 1 the bubble drag force is expected to be a Stokes-like force 13,14:
𝑓𝑆≈ 𝑘2𝜇0𝑅𝑣 (eq.10)
where 𝑣 is the relative velocity for the bubble-wall system. The constant 𝑘2 is of the order of 𝑙𝑛 (𝐷ℎ) with ℎ the thickness of the liquid layer between the bubble interface and the solid wall. Equation 10 indicates that the drag force is proportional to the average linear velocity of the plates. Note that in the present case 𝑣 = 𝑢 2⁄ . As 𝜆 increases, bubbles become flattened and a Bretherton-like 15 force has to be accounted for. The origin of this force is related to the circular rim of circumference 𝜋𝑑0 where most of dissipation occurs 14:
𝑓𝐵 = 𝑘1𝜎𝑅𝑑̃0(𝜇0𝑣
𝜎 ) 2 3⁄
(eq.11)
where the constant 𝑘1 = 8.44 has been calculated in 14. Note that those two forces cannot be easily dissociated so a composite approximation is often required 11,14,16. In the following we consider the simplest approach where the two forces are basically added up. By counting the number of bubbles, contributions of those forces to the total shear stress can be estimated as follows:
𝜏𝑆≈𝑛𝑓𝑆𝑆= 𝑘2′𝜙𝜇0〈𝜖̇〉𝜆−2 (eq.12) 𝜏𝐵 ≈𝑛𝑓𝐵 𝑆 = 𝑘1 ′𝜙𝜎 𝑅𝑑̃0 𝐶𝑎2 3⁄ 𝜆5 3⁄ (eq.13)
Naturally, shear stress occurring within liquid that surrounds the bubbles has to be accounted for. That contribution can write:
𝜏𝑙≈ (1 − 𝑘𝜙)𝜇0〈𝜖̇〉 (eq.14)
where the constant 𝑘 is expected to be close to unity. The reduced shear viscosity is obtained by dividing (𝜏𝑆+ 𝜏𝐵+ 𝜏𝑙) by 𝜇0〈𝜖̇〉: 𝜇 𝜇0= 𝜏 𝜇0〈𝜖̇〉≈ 1 + 𝜙(𝑘2 ′𝜆−2− 𝑘) + 𝑘 1′𝜙𝑑̃0(𝜆)𝐶𝑎−1 3⁄ 𝜆−5 3⁄ (eq.15)
Note that 𝑘1′ = 3𝑘1⁄ , so the expected value is 𝑘2𝜋 1′ ≈ 4 with 𝑘1 = 8.44 14. Moreover, for 𝜆 ≲ 1 the third term of equation 15 vanishes and one expects that the viscosity gets close the value
10 corresponding to unconfined bubbly liquids in the regime 𝐶𝑎 ≪ 1, i.e. 1 + 𝜙 (see figure 4). Therefore, the constant 𝑘 is related to 𝑘2′ by 𝑘 = 𝑘2′ − 1, and the expression for the relative shear viscosity becomes:
𝜇
𝜇0≈ 1 + 𝜙(1 + 𝑘2
′(𝜆−2− 1)) + 4𝜙𝑑̃
0(𝜆)𝜆−5 3⁄ 𝐶𝑎−1 3⁄ (eq.16)
Equation 16 is plotted in figure 7a as a function of 𝐶𝑎 (𝐶𝑎 ≤ 0.1) for 𝜆 values within the range [1 ; 3.5]. It can be seen that equation 16 captures correctly the experimental behavior presented in figure 4: (1) for 𝜆 ≈ 1 the curve 𝜇 𝜇⁄ 0= 𝑓(𝐶𝑎) exhibits a plateau. (2) The slope −𝑑(𝜇 𝜇⁄ ) 𝑑𝑙𝑛𝐶𝑎0 ⁄ increases strongly as 𝜆 increases up to 1.7. (3) 𝜇 𝜇⁄ values decrease for 𝜆 ≳ 1.7. A quantitative 0 agreement can be found by fitting equation 16 to our data. This is performed in figure 7b where 𝜇 𝜇⁄ is plotted as a function of 𝜆 for several 𝐶𝑎 values within the range [0.003 ; 0.1]. The unique 0 fitting parameter is 𝑘2′ = 2.7, which means that for the Stokes-like force (eq. 10), 𝑙𝑛(𝐷 ℎ⁄ ) ∼ (2𝜋 3⁄ ) × 2.7, which corresponds to ℎ~ 20 µm. This value is consistent with the assumption that film thickness is set by hydrodynamics in this regime.
For 𝐶𝑎 ≈ 1, 𝜇 𝜇⁄ was measured to reach a value that was found to not depend on 𝜆 (see 0 figures 4 and 7b), i.e. 𝜇 𝜇0⁄ ≈ 0.93 for 𝜙 = 0.075. This value is just above theoretical prediction for unconfined bubbly liquid at large 𝐶𝑎 numbers, i.e. 1 − 5𝜙 3⁄ (see figure 7b). Note that for such Ca values, confined bubbles are significantly deformed and have an elongated shape, similarly to what is observed for unconfined bubbly liquid. In fact, bubbles deform following the same trend within the range of Ca values [0.1 - 2] and initial relative deviations observed for a D⁄ as a function of λ are progressively reduced by shear, i.e. ∆(a D⁄ ) (a D⁄ ⁄ ) decreases from 1 2⁄ to 1 4⁄ as Ca increases up to 1. This is consistent with the behavior discussed above for the viscosity, i.e. viscosity values become less dependent on lambda at high Ca values. Note however that for larger 𝐶𝑎 values, i.e. 𝐶𝑎 ≳ 2, bubble elongation depends strongly on confinement: for 𝜆 = 1 the increase of 𝑎 𝐷⁄ slows down (i.e. 𝑎 𝐷⁄ increases first from 1 to 3 as Ca increases from 0 to 2, then 𝑎 𝐷⁄ increases from 3 to 5 as Ca increases from 2 to 5), which is similar to elongation measured for unconfined bubbles 9 where 𝑎 𝐷⁄ ~𝐶𝑎0.5. In contrast bubbles become strongly elongated for 𝜆 = 3, which is coherent with previous observation of the so-called string deformation of droplet during micro-confined shear flow
17,18
. Our results indicate that such deviations observed for the bubble shape as a function of confinement have only a weak effect on the shear viscosity.
11
Figure 7: Prediction for the effect of bubble confinement and capillary number on the shear viscosity of squeezed bubbly liquids. (a) Coefficient 𝑥 = (𝜇 𝜇⁄ 0− 1) 𝜙⁄ as a function of the capillary number Ca
for several values of the confinement parameter 𝜆, using equation 16 (with 𝑘2′ = 2.7). (b) Theoretical
values for the reduced shear viscosity, i.e. equation 16 (with 𝑘2′ = 2.7), plotted against experimental
data (𝜙 = 0.075) as a function of the confinement parameter 𝜆 for several values of the capillary number Ca. The dotted line corresponds to 𝜇 𝜇⁄ 0= 1 − 5𝜙 3⁄ .
5. Conclusion
We studied the impact of confinement on the shear viscosity 𝜇 of bubbly liquid with gas volume fraction 𝜙 in the semi-dilute regime. Experiments involving bubbly liquid confined between two plates have been performed for ratios 𝜆 of the bubble size to the layer thickness equal or larger than unity. The results show that, for all the studied confinement ratios lambda, the viscosity of the bubbly liquid is smaller than the viscosity of the suspending liquid for capillary numbers larger than 0.1. Measurements of bubble deformations show that this behavior is related to bubble stretching in the direction of shear induced flow. In the limit of high capillary numbers, viscosity reaches values predicted for unconfined bubbly liquids. On the other hand, our results for small capillary numbers, i.e. 𝐶𝑎 ≲ 0.01, highlight a strong difference with respect to the reference case of unconfined bubbly liquid, for which 𝜇 = 𝜇0(1 + 𝜙). Instead, we obtained 𝜇 = 𝜇0(1 + 𝑥𝜙) where 𝑥 was measured within the range 1-7, depending on both 𝐶𝑎 and 𝜆 values. Moreover, results highlight a non-monotonic variation of the viscosity as a function of confinement ratio, exhibiting a well-defined maximum value for ratio close to 1.8. This behavior has been described by considering both bulk Stokes-like forces and wall drag forces, i.e. Bretherton-like forces, for the squeezed bubbles.
12 These results could be useful as soon as bubbly liquids are involved in lubricating layers or as bubbles are transported through microchannels. Note however that for microfluidics applications bubbles are moved by liquid flow and induced shear is symmetrical with respect to the midplane. As a result, bubbles are not elongated along the flow and they don’t lose their contacts with the walls.
References
1 M. Manga, J. Castro, K. Cashman and L. Michael, Journal of Volcanology and Geothermal
Research, 1998, 87, 15–28.
2 2013, US20130139746A1.
3 A. Einstein, An Phys, 1906, 19, 289–306.
4 G. I. Taylor, Proceedings of the Royal Society A: Mathematical, Physical and Engineering
Sciences, 1932, 138, 41–48.
5 G. I. Taylor, Proceedings of the Royal Society A: Mathematical, Physical and Engineering
Sciences, 1934, 146, 501–523.
6 N. A. Frankel and A. Acrivos, J. Fluid Mech., 1970, 44, 65–78. 7 J. M. Rallison, Annual Review of Fluid Mechanics, 1984, 16, 45–66. 8 H. A. Stone, Annual Review of Fluid Mechanics, 1994, 26, 65–102.
9 A. C. Rust and M. Manga, Journal of colloid and interface science, 2002, 249, 476–480. 10 S. Guido, Current Opinion in Colloid and Interface Science, 2011, 16, 61–70.
11 P. Aussillous and D. Quéré, Europhysics Letters, 2002, 59, 370–376.
12 V. Sibillo, G. Pasquariello, M. Simeone, V. Cristini and S. Guido, Physical review letters, 2006,
97, 054502.
13 L. R. White and S. L. Carnie, J. Fluid Mech., 2012, 696, 345–373.
14 S. R. Hodges, O. E. Jensen and J. M. Rallison, Journal of Fluid Mechanics, 2004, 512, 95–131. 15 F. P. Bretherton, J. Fluid Mech., 1961, 10, 166–188.
16 M. Le Merrer, R. Lespiat, R. Hohler and S. Cohen-Addad, Soft Matter, 2015, 11, 368–381. 17 J. A. Pathak and K. B. Migler, Langmuir, 2003, 19, 8667–8674.