PHYSICAL-CHEMICAL PROPERTIES OF MILK FAT GLOBULE
MEMBRANE AT DIFFERENT STAGES OF ISOLATION
Priyanka MALIK*, Sabine DANTHINE, Aman PAUL, Christophe BLECKER Food Science and Formulations Unit, Gembloux Agro-Bio Tech, University of Liege, Passage des Deportes-2, Gembloux (5030), Belgium, Phone number- 003281622303,Email- priyanka.malik@ulg.ac.be
Corresponding author email: priyanka.malik@ulg.ac.be Abstract
Fat globules in milk are present in form of emulsion stabilized by milk fat globule membrane (MFGM) which originates in mammary gland. Buttermilk which is rich source of MFGM finds application as an ingredient in dairy and food industry (emulsions, infant formulas & low fat products) for its emulsifying and stabilizing properties which are associated to polar lipids. Phospholipids & some proteins have also shown some medicinal properties. So, MFGM received much attention in recent years due to its health-beneficial & technological properties. This work has been carried out with the objective to characterize MFGM at different stages of extraction. MFGM fractions were isolated from fresh cream and collected at different steps during processing to study its physical-chemical characterization. The fractions were characterized for their chemical composition to have an idea at which stage which components are isolated. The sample were also characterized for their surface properties which included study of mechanical properties of monolayer using Langmuir film balance, surface tension and zeta potential. Physical-chemical studies of fractions suggest that each fraction of MFGM have different chemical composition and surface properties which could be of interest for use in different food products depending on the requirement. The choice of these fractions could be done for their use as food additive/ingredient in food industry depending on the application. It may even have an extended application in pharmaceutical industry.
Key words: Composition, Milk Fat Globule Membrane, Surface properties, Valorization. INTRODUCTION
Milk fat exists as an emulsion of tiny, spherical oil globules (Jensen, 2002). The diameter of milk fat globules ranges from 0.2 to 15 μm which is surrounded by a 4 to 10 nm milk fat globule membrane (MFGM) (Danthine et al., 2000; Singh, 2006). This MFGM (2-6% of Fat globules) is the protective coat which ensures structural integrity of milk fat. It has tripartite structure. The primary monolayer surrounding the fat globule is rich in proteins and is derived from endoplasmic reticulum membrane. The secondary bilayer is rich in polar lipids and is derived from plasma membrane (Vanderghem
et al., 2010).
Over last two decades, many studies revealed composition & nutritional aspects of MFGM. Models of structure & organization have been
physical-chemical properties have also been carried out. These work mainly focused on studying the role of various components of native MFGM towards surface and techno-functional properties (Shimizu et al., 1980; Innocente et al., 1997; Karray et al., 2006; Danthine & Blecker, 2014; Kanno et al., 1991; Phan et al., 2014; Corredig and Dalgleish, 1998; Dzul-Cauich et al., 2013).
In present work MFGM fractions were collected at different stages of isolation. The effects of compositional differences of MFGM fractions on the surface properties were studied. MATERIALS AND METHODS
Milk Fat Globule membrane extraction- Scientific Bulletin. Series F. Biotechnologies, Vol. XIX, 2015
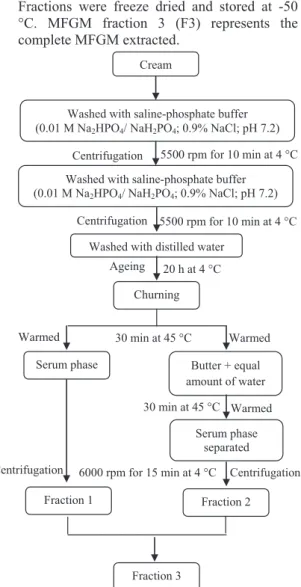
Vanderghem et al. (2008) with slight modifica-tions. A detailed scheme for extraction of MFGM is presented in Figure 1. Cream was subjected to centrifugation between washes in Avanti J-E (Beckman Coulter Inc., Belgium). Fractions were freeze dried and stored at -50 °C. MFGM fraction 3 (F3) represents the complete MFGM extracted.
Figure 1 - Scheme for extraction of MFGM fractions Determination of protein and lipid content of MFGM- The nitrogen content was estimated using Rapid N (Elementar Analysensysteme GmbH, Germany) and multiplied by 6.38 to get the protein content.
Lipid extraction was performed according to the method of Rombaut et al. (2005) with slight modifications. One g of sample was taken and washed three times with 25ml chloroform/methanol (2:1) solution (10 min handshaking and centrifugation for 5 min at 3000 rpm). The sample was subjected to centrifugation in Avanti J-E (Beckman Coulter Inc., Belgium). This supernatant was filtered (5μm filter paper) and collected in 250 ml separation funnel after every washing. Following this 40 ml 0.57% NaCl solution was added in the funnel and thorough mixed. The mixture was allowed to stand overnight and then the lower phase was collected. 40 ml chloroform was added to the funnel and after 5 hours the lower non-aqueous phase was removed. The solvent from this non-aqueous phase was evaporated by rotary vacuum evaporator RE-121 Rotavapor (BUCHI Labortechnik GmbH, Netherlands). The lipids were dissolved in 10 ml of 2:1 chloroform: methanol and stored at 4 °C.
Compression isotherm measurements- Isotherms measurements were carried out using a Langmuir film balance FW2 (Lauda, Lauda-Königshofen, Germany). Deionised water (MilliQ water; Millipore Corp., Bedford, MA, USA) was used as sub phase. The temperature of the trough was maintained at 20.0 ± 0.5 °C by external circulating water. The MFGM fractions were spread at the air water interface (80 μL, 5 mg/ ml) with a Hamilton micro syringe just at the air-water interface. A time period of 15 min was allowed for the formation of the film. The compression isotherms (Surface pressure/ Surface area) were obtained by compressing the spread monolayer at a constant rate of 90 cm2/ min.
Zeta Potential Titration curve measurements- These measurements were carried out by using Delsa nano Zeta potential analyser (Beckman Coulter, Belgium). MFGM fractions were dispersed in Milli-Q water at the rate of 0.5% and kept overnight at 4 °C before measurement. Ageing 20 h at 4 °C
Churning
Serum phase Butter + equal amount of water Washed with saline-phosphate buffer (0.01 M Na2HPO4/ NaH2PO4; 0.9% NaCl; pH 7.2)
Centrifugation
Centrifugation
5500 rpm for 10 min at 4 °C Cream
Washed with saline-phosphate buffer (0.01 M Na2HPO4/ NaH2PO4; 0.9% NaCl; pH 7.2)
Washed with distilled water
5500 rpm for 10 min at 4 °C Warmed Serum phase separated Fraction 1 Fraction 2 Fraction 3 Warmed
Centrifugation 6000 rpm for 15 min at 4 °C 30 min at 45 °C
Centrifugation 30 min at 45 °C Warmed
Zeta Potential Titration curve and isoelectric point were obtained by electrophoretic light scattering method. MFGM fractions were subjected to titration with 0.1N HCl in the pH range of 6.5 to 2.
Dynamic Surface Tension measurements- Dynamic surface tension measurements were determined by an automated drop volume tensiometer (TVT1, Lauda, Germany) at the air/water interface at 25 °C. MFGM fractions were dispersed in Milli-Q water at the rate of 0.5% and kept overnight at 4 °C before measurement.
RESULTS AND DISCUSSIONS Yield and composition of MFGM fractions The amount of cream used for extraction of MFGM was 1200g. A total of 9.70 g of MFGM was recovered, of which Fraction 1 was 4.70 g and Fraction 2 was 4.97 g.
The average percentage value of protein recorded for MFGM F1 and MFGM F2 were 44.19% and 28.76% respectively on wet basis. The average percentage value of fat recorded for MFGM F1 and MFGM F2 were 31.22% and 63.88% respectively on wet basis. These values were in accordance with the values reported in literature (Danthine et al., 2000; Dewettinck et al., 2008).
Study of monolayers
Langmuir film balance allows determination of the surface pressure as a function of surface area which reflects the packing of monolayer (lipid-protein interactions) at air-water interface.
Figure 2 shows the compression isotherms (π-A isotherm) of three fractions of MFGM. When monolayers were compressed, two transition phases were identified for MFGM F3 and one transition phase was identified for MFGM F1 and MFGM F2. Phase one appears when it
undergoes compression; the surface pressure increases until an inflection point (At1, πt1).
Upon further compression, the second transition phase is characterized by an increase in the slope in the π-A isotherm until an inflection point (At2, πt2). Finally, the horizontal break in
the isotherm can be considered as the collapse of the monolayer and is characterized by maximum surface pressure (πc). The values of
the characteristics points of the π-A isotherm are presented in table 1.
Figure 2 - Compression isotherm of a MFGM fractions monolayer
Table 1 - Characteristic points and film elasticity of the compression isotherm for MFGM fractions Characteristics F3 F2 F1 At0 (cm2/mg) 1270.15 986.13 1349.64 At1 (cm2/mg) 637.47 - 632.57 At2 (cm2/mg) 254.76 259.61 - πt1 (mN/m) 23.84 - 23.55 πt2 (mN/m) 45.75 47.34 - πc (mN/m) 62.11 63.19 52.53 Film elasticity (mN/m) 23.33 30.06 18.17 The first transition phase of MFGM F3 coincides with transition phase of MFGM F1 and second transition phase of MFGM F3 coincides with MFGM F2. These differences
-10 0 10 20 30 40 50 60 70 0 400 800 1200 1600 Surface pressure (mN/m) Area (cm²/mg) F3 F2 F1
could be attributed to the compositional differences. MFGM F1 had a higher protein content compared to MFGM F2 and MFGM F2 had a higher lipid content compared to MFGM F1.
The π-A isotherm profile of MFGM is more or less similar to previous published work. Innocente et al. (1997) reported the two transition phases for MFGM compression isotherm at surface pressure of 22 mN/ m and 48 mN/ m. Similarly Danthine and Blecker (2014) reported the two transition phases for MFGM compression isotherm at surface pressure of 28.5 mN/ m and 49 mN/ m. In our work the two transition phases for MFGM F3 compression isotherm were recorded at surface pressure of 24 mN/ m and 46 mN/ m. A little difference was observed for values of surface pressure at the transition phase. These differences observed could be attributed to the difference in the membrane composition which could certainly modify the phase behaviour of the monolayers.
The change in surface pressure per unit change in film interfacial area is termed as Film elasticity (ɛ ). Thus it measures resistance to change in film area (Graham and Phillips, 1980). F2 had a better film elasticity as compared to other fractions. A better film elasticity indicates better emulsion and foam stability. Thus compression isotherms could be used to indicate the stability behaviour of the fractions.
Zeta Potential Titration curve and Isoelectric point measurements
The stability of the dispersing particle is influenced by their surface charge. Zeta potential is an index of dispersion stability of particles. If zeta potential is high, particles are stable due to high electrostatic repulsion. On the contrary, if zeta potential is low (nearing
zero), particles have a tendency to form an aggregate which is referred to as isoelectric point (Greenwood and Kendall, 1999).
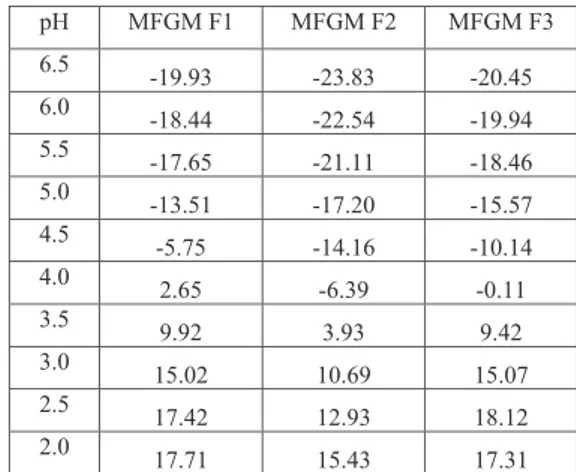
Figure 3 shows the zeta potential titration curve for the three MFGM fractions. The isoelectric pH of MFGM F1, MFGM F2 and MFGM F3 is 4.24, 3.73 and 4.06 respectively. This difference could be attributed to difference in their protein composition. All fractions were found to be stable in the pH range above 5.5 and below 3.0 (Table 2).
Figure 3 - Zeta Potential Titration curve for MFGM fraction
Table 2- Zeta potential (mV) values in pH range 6.5-2.0 pH MFGM F1 MFGM F2 MFGM F3 6.5 -19.93 -23.83 -20.45 6.0 -18.44 -22.54 -19.94 5.5 -17.65 -21.11 -18.46 5.0 -13.51 -17.20 -15.57 4.5 -5.75 -14.16 -10.14 4.0 2.65 -6.39 -0.11 3.5 9.92 3.93 9.42 3.0 15.02 10.69 15.07 2.5 17.42 12.93 18.12 2.0 17.71 15.43 17.31 -30 -20 -10 0 10 20 30 0 2 4 6 8 Zeta Potential (mV) pH F3 F2 F1
Thus, the MFGM fractions could be used in food products which are in this pH range without affecting the stability of the products. Study of Dynamic Surface Tension
The dynamic surface tension gives the surface tension at particular surface age. Surface active substances cause a lowering of surface tension. MFGM fractions were characterized by the drop volume tensiometer in the dynamic mode at 25 °C.
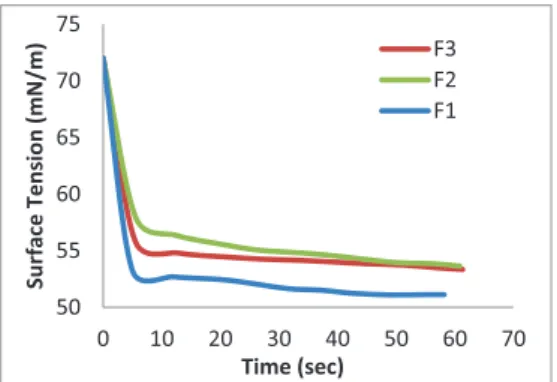
Surface tensions of MFGM F1, F2 and F3 at concentration of 5 mg MFGM/ ml at 60 sec were recorded to be 51 mN/m, 53.6 mN/ m and 53.3 mN/ m respectively (Figure 4). Surface tension of MFGM at concentration of 1 mg MFGM/ml and 13.5 mg MFGM/ml at 60 sec were reported as 57 mN/ m and 51 mN/ m respectively (Vanderghem, 2009). A slight difference in the values could be attributed to the different concentration and compositional difference of the MFGM.
Figure 4 - Dynamic surface tension curves for MFGM fractions
The differences in the adsorption kinetics curves of different MFGM fractions could be explained by the different protein and lipid composition of different fractions. Equilibrium in surface tension value was attained within 30 sec for both MFGM F1 and MFGM F2 and
within 15 sec for MFGM F3. The dynamics of adsorption has importance in determining the emulsifying stability. The time required for obtaining equilibrium in surface tension indicates the emulsifying stability of the substance.
CONCLUSIONS
Each fraction of MFGM had different chemical composition which contributed towards different surface properties. The surface properties can be used as a tool to study the techno-functional properties and the stability behavior of the MFGM fraction. Further it could be interesting to verify these results by studying the techno-functional properties of these fractions.
ACKNOWLEDGEMENTS
This research was made possible from the financial support of CURAGx, Gembloux Agro-Bio Tech, University of Liege, Belgium. REFERENCES
Corredig M., Dalgleish D.G., 1998. Characterization of the interface of an oil-in water emulsion stabilized by milk fat globule membrane. Journal of Dairy Research, 65:465-477.
Danthine S., Blecker, C., 2014. Interactions of lipases with milk fat globule membrane monolayers using a Langmuir film Balance. International Dairy Journal, 35:81-87.
Danthine S., Blecker C., Paquot M., Innocente N., Deroanne, C., 2000. Evolution des connaissances sur la membrane du globule gras du lait: synthèse bibliographique. Lait, 80:209-222.
Dewettinck K., Rombaut R., Thienpont N., LE T.T., Messens K., Van Camp J., 2008. Nutritional and technological aspects of milk fat globule membrane material. International Dairy Journal, 18:436-457. Dzul-Cauich J.G., Lobato-Calleros C.., Pérez-Orozc J.P.,
Alvarez-Ramirez J., Vernon-Carter E.J., 2013. Stability of water-in-oil-in-water multiple emulsions: influence of the interfacial properties of milk fat globule membrane. Revista Mexicana de Ingeniería Química, 12(3):425-436 50 55 60 65 70 75 0 10 20 30 40 50 60 70 Surface Tension (mN/m) Time (sec) F3 F2 F1
Graham D. E., Phillips M. C., 1980. Proteins at liquid interfaces: dilatational properties. Journal of Colloid Interface Science, 76:227-231.
Greenwood R., Kendall K., 1999. Electroacoustic studies of moderately concentrated colloidal suspensions. Journal of the European Ceramic Society, 19(4):479–488.
Innocente N., Blecker C., Deroanne C. & Paquot M, 1997. Langmuir film balance study of the surface properties of a soluble fraction of milk fat-globule membrane. Journal of Agricultural & Food Chemistry, 45: 1559-1563.
Jensen R.G., 2002. The composition of bovine milk lipids. January 1995 to December 2000. Journal of Dairy Science, 85(2):295-350.
Kanno C., Shimomura Y., Takano E., 1991. Physicochemical properties of milk fat emulsions stabilized with bovine milk fat globule membrane. Journal of Food Science, 56:1219-1223.
Karray N., Danthine S., Blecker C., Attia H., 2006. Contribution to the study of camel milk fat globule membrane. International Journal of Food Science & Nutrition, 57(6/7):382-390.
Phan T.T.Q., Le T.T., Van der Meeren P., Dewettinck, K., 2014. Comparison of emulsifying properties of milk fat globule membrane materials isolated from different dairy by-products. Journal of Dairy Science, 97:4799–4810.
Rombaut R., Camp J.Y., Dewettinck K., 2005. Analysis of phospbo- and sphingolipids in dairy products by a new HPLC method. Journal of Dairy Science. 88:482-488.
Singh H., 2006. The milk fat globule membrane – a biophysical system for food applications. Current Opinion in Colloid & Interface Science, 11:154–163. Shimizu M., Yamauchi K., Kanno C., 1980. Effect of
proteolytic digestion of milk fat globule membrane proteins on stability of the globules. Milchwissenchaft, 35:9-12.
Vanderghem C., 2009. Etudes des properties physico-chimiques de la membrane du globule gras du lait. Doctoral dissertation, Gembloux Agro Bio-Tech, University of Liege, Belgium.
Vanderghem C., Blecker C., Danthine S., Deroanne C., Haubruge E., Guillonneau F., Pauw E.D., Francis F., 2008. Proteome analysis of the bovine milk fat globule: enhancement of membrane purification. International Dairy Journal, 18:885-893.
Vanderghem C., Bodson P., Danthine S., Paquot M., Deroanne C., & Blecker C., 2010. Milk fat globule membrane and buttermilks: from composition to valorization. Biotechnology Agronomy Society Environment, 14:485-500.
Vanderghem C., Francis F., Danthine S., Deroanne C., Paquot M., De Pauw E. & Blecker C., 2011. Study of the susceptibility of the bovine milk fat globule membrane proteins to enzymatic hydrolysis & organization of some of the proteins. International Dairy Journal, 21:312-318.