Performance comparison between
JWST/MIRI+NIRCam
&
VLT/SPHERE
for exoplanet detection
Charles Hanot, Olivier Absil, Jean Surdej
ARC meeting, 11February 2010
James Webb Space Telescope (JWST)
•
Infrared-optimized 6.5 m telescope
•
Detection of first galaxies
JWST/ MIRI
•
M
id-
I
nfra
R
ed
I
nstrument (5-27µm)
•
Imager + Spectrograph
•
Equiped with coronagraphs for high dynamic imaging
JWST/ NIRCam
•
N
ear
I
nfra
R
ed
Cam
era (0.6-2.3µm + 2.4-5 µm)
•
Imager
VLT/SPHERE
•
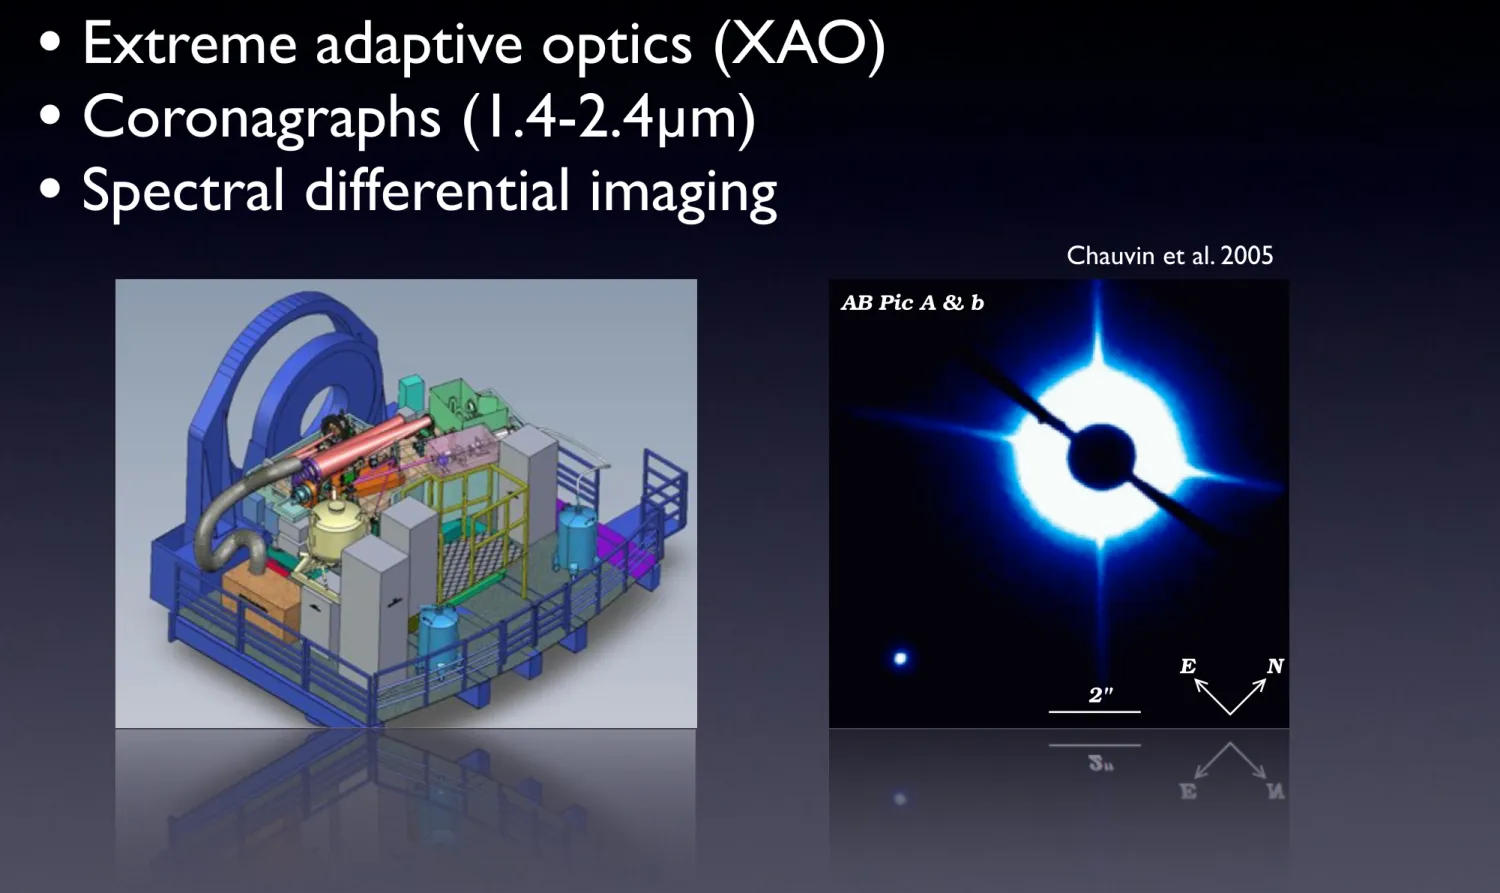
Extreme adaptive optics (XAO)
•
Coronagraphs (1.4-2.4µm)
•
Spectral differential imaging
L30 G. Chauvin et al.: A companion to AB Pic at the planet/brown dwarf boundary Table 1. Observing Log.
Name UT date Tot. exp. time Filter Camera Mode Strehl Seeing Airmass Remarks (%) (arcsec)
Classical imaging and coronagraphy
AB Pic A 17/03/2003 60 × 2 s NB1.24 S13 classical 12 0.75 1.32 science 17/03/2003 120 × 0.5 s NB1.75 S13 classical 25 0.80 1.22 science 17/03/2003 100 × 0.35 s NB2.17 S27 classical 32 0.80 1.31 science AB Pic b 17/03/2003 18 × 30 s J S13 coronagraphy 12 0.75 1.27 science 17/03/2003 5 × 30 s H S13 coronagraphy 25 0.80 1.28 science 17/03/2003 3 × 20 s Ks S27 coronagraphy 32 0.80 1.30 science
θ Ori 1 C 16/03/2003 12 × 10 s NB1.75 S13 coronagraphy 37 1.00 1.12 astrometric std AB Pic A 05/03/2004 10 × 1 s NB1.75 S13 classical 20 1.00 1.20 science
AB Pic b 05/03/2004 4 × 30 s H S13 coronagraphy 20 1.10 1.20 science
θ Ori 1 C 05/03/2004 10 × 12 s H S13 coronagraphy 38 1.10 1.15 astrometric std AB Pic A 25/09/2004 2 × 5 s H+ ND S13 classical 27 0.74 1.28 science
AB Pic b 25/09/2004 3 × 20 s H S13 coronagraphy 27 0.75 1.28 science
θ Ori 1 C 25/09/2004 4 × 0.8 s H S13 coronagraphy 24 0.85 1.15 astrometric std Spectroscopy AB Pic b 03/12/2004 16 × 300 s SHK S54 Rλ = 550 na 0.87 1.26 science HIP 33632 03/12/2004 10 × 5 s SHK S54 Rλ = 550 na 0.70 1.08 telluric std !"#$%&#!#'#( ) * +,
Fig. 1. Ks-band coronagraphic image of AB Pic A and b acquired on
17 March 2003 with an occulting mask of diameter 1.4"".
S13 camera were found on 16 March 2003, 5 March 2004 and 25 September 2004 respectively at −0.05◦,0.04◦,0.20◦ east of
the vertical with an uncertainty of 0.10◦. The pixel scale was
found to be relatively stable in time with values of 13.21 ± 0.11 mas, 13.24 ± 0.05 mas and 13.23 ± 0.09 mas.
The NACO spectroscopic observations of AB Pic b were obtained on 3 December 2004, using the low resolution (Rλ = 550) grism with the 86 mas slit, the S54 camera (54 mas/pixel) and the SHK filter covering the entire spectral range be-tween 1.39 and 2.52 µm. The telluric standard star HIP 33632 (B6V) was also observed. After substracting the sky and divid-ing by a flat field usdivid-ing eclipse (Devillard 1997), the spectra of AB Pic b and HIP 33632 were extracted and calibrated in wave-length with IRAF/DOSLIT. To calibrate the relative throughput
Table 2. Photometry of AB Pic A and b.
Component J H K
(mag) (mag) (mag)
AB Pic Aa 7.58 +− 0.03 7.09 +− 0.03 6.98 +− 0.03
AB Pic bb 16.18 +− 0.10 14.69 +− 0.10 14.14 +− 0.08 a From the 2MASS All-Sky Catalog of Point Sources (Cutri et al.
2003).
b From a and NACO measurements presented in this work.
of the atmosphere and the instrument, we divided the extracted spectrum of AB Pic b by the spectrum of HIP 33632. To re-store the continuum shape, we then multiplied by a composite spectrum of a B6IV star taken from a library of stellar spectra (Pickles 1998).
3. Companionship confirmation
To verify that AB Pic A and b were comoving together in the sky and thus physically bound, their relative positions were determined on 17 March 2003, 5 March 2004 and 25 September 2004 (see Table 3). We then took into account the proper motion of AB Pic A from the Tycho catalog Høg et al. (2000): µα = 15.9 ± 1.2 mas/yr and µδ = 46.2 ± 1.2 mas/yr,
its expected parallactic motion and the detector calibrations at each epoch (platescale and detector orientation, see Sect. 2). The expected variations in separation and position angle in the case of a bound companion and of a background station-ary object are shown in Fig. 2. The maximal orbital motion of AB Pic b from March 2003 to September 2004 is <12 mas. In the case of a stationary background object, important variations
!"##"$
!#%
!#&"
!'()#%$
Chauvin et al. 2005 jeudi 11 février 2010Context and goals
MIRI GTO: short program proposal
Well defined, well focused
Immediate scientific return
Main goals
Directly detect
the smallest possible planets at
5-50 AU from main sequence stars
Unveil
new population
of planets
Why M stars?
Most abundant stellar type
Planetary systems not well known
Planet formation/migration similar to Sun-like stars?
Currently a hot topic
RV and transit surveys starting
Prospects for super-Earths in habitable zones
Low luminosity
Fainter planets can be imaged at a given contrast
Why young main sequence stars?
“Main sequence”
Thick disks have disappeared
Planetary systems mostly formed
“Young”
Planets are still warm and luminous easier
○
Cooling models poorly constrained
Moving groups and associations
○
Nearby (typically 20 – 50 pc)
Evolutionary models
10 Myr Hot start Baraffe et al. 2003 Core accre5on Fortney et al. 2008 Fortney et al. 2008 jeudi 11 février 2010Scientific return
Detection at 11.4 µm
Age known planet temperature and mass from
models
First statistics of low-mass planets
Follow-up with MIRI
15.5 µm: model-independent temperature estimation
10.65 µm: search for ammonia
Follow-up with NIRCam at 4.6 µm
More constraints on theoretical models
Astrometric follow-up dynamical mass
determination for close planets (< 5 AU)
Illustrative result with MIRI
M0V,10pc, 12 Myr, 1h
Sample and sensitivity
Name (pc)Dist (Myr)Age typeSp V AUa MjupM AUa MjupM AUa MjupM AUa MjupM AU Mic 9.9 12 M1Ve 8.8 2 0.50 5 0.30 10 0.16 25 0.10 TWA 8A 21.0 8 M3Ve 12.2 4 0.40 11 0.25 21 0.19 53 0.16 TWA 8B 21.0 8 M5 15.2 4 0.33 11 0.23 21 0.18 53 0.17 WW PsA 23.6 12 M4 12.2 5 0.50 12 0.30 24 0.21 59 0.20 CD‐57 1054 26.3 12 M0/1 10.0 5 0.80 13 0.50 26 0.25 66 0.23 V1005 Ori 26.7 12 M0.5V 10.1 5 0.80 13 0.50 27 0.25 67 0.23 TWA 12 32.0 8 M1Ve 12.9 6 0.80 16 0.45 32 0.26 80 0.25 CPD‐66 3080B 31.4 12 M3Ve 12.7 6 0.80 16 0.42 31 0.28 79 0.27 TWA 7 38.0 8 M2Ve 11.7 8 0.90 19 0.52 38 0.30 95 0.28 GJ 4020 A 24.0 50 M0 10.2 5 2.00 12 1.10 24 0.60 60 0.50 GJ 9809 24.9 50 M0 10.9 5 2.00 12 1.10 25 0.60 62 0.50 CT Tuc 37.5 30 M0Ve 11.5 7 1.70 19 0.95 37 0.55 94 0.50
0.2”
0.5”
1.0”
2.0”
Comparison with NIRCam
MIRI
better than NIRCam for planets
<1.5’’
(~40AU)
Only
MIRI
can access planets
<0.8’’ (~20AU)
Comparison with SPHERE
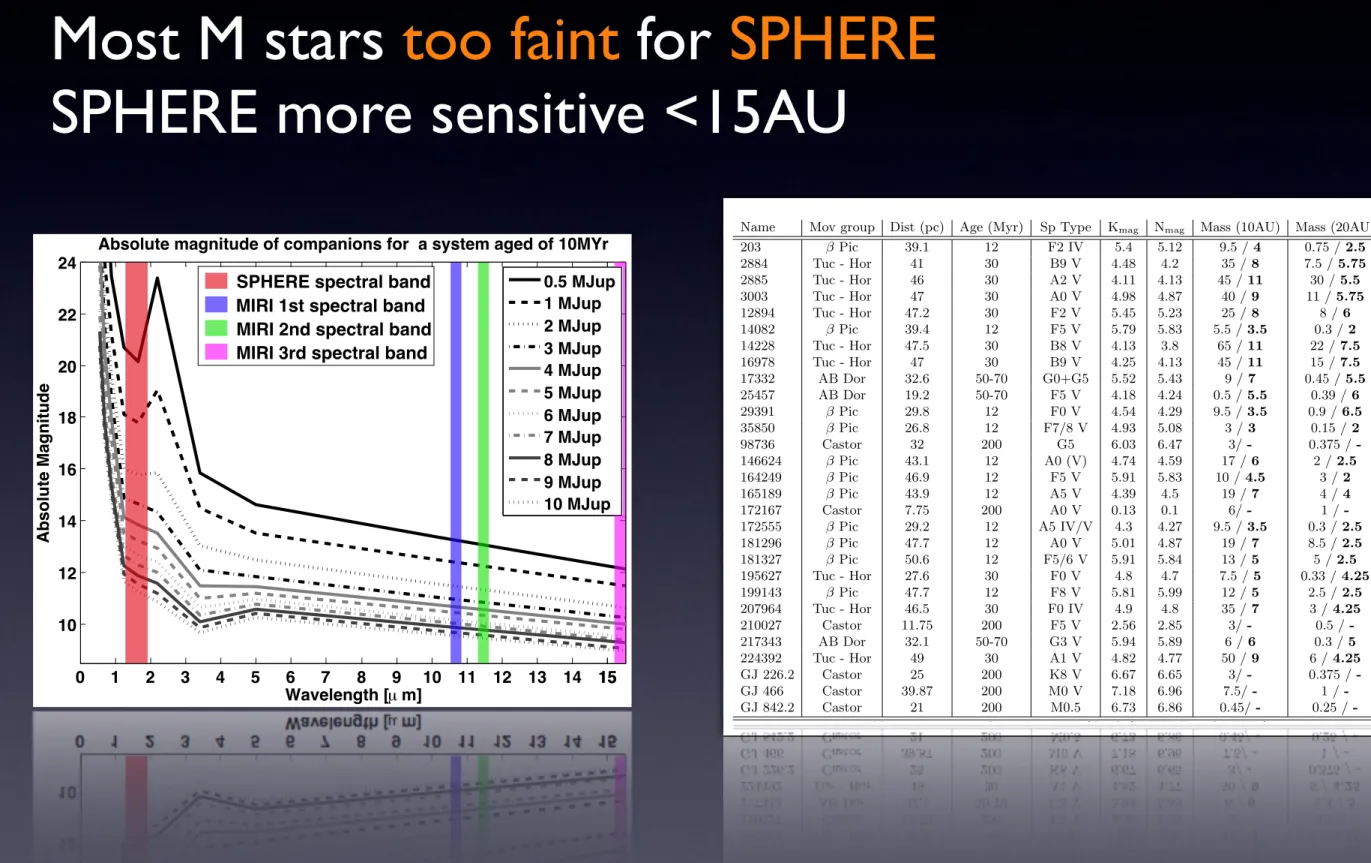
Most M stars
too faint
for
SPHERE
SPHERE more sensitive <15AU
2 C. HANOT, O. ABSIL, D. MAWET, P. RIAUD, D. DEFR`ERE AND J. SURDEJ
moving group - 12Myr, (ii) the Tucana-Horologium association - 30Myr and (iii) the AB Doradus moving group - 50Myr. The visible and near infrared magnitudes of these stars are well known. However, their magnitude in the N band is way more difficult to find. Therefore, as their spectral types and thus their effective temperatures are known, we computed their N magnitude assuming a blackbody distribution and scaling the resulting curve to mach the V and K magnitudes that are well known (see Tab. 4).
3. Exoplanetary models 0 1 2 3 4 5 6 7 8 9 10 11 12 13 14 1515 10 12 14 16 18 20 22 24 Wavelength [µ m] Absolute Magnitude
Absolute magnitude of companions for a system aged of 10MYr 0.5 MJup 1 MJup 2 MJup 3 MJup 4 MJup 5 MJup 6 MJup 7 MJup 8 MJup 9 MJup 10 MJup
SPHERE spectral band MIRI 1st spectral band MIRI 2nd spectral band MIRI 3rd spectral band
Figure 1. Absolute magnitude of companions in a system aged of 10Myr using the Baraffe et al. 2003 evolutionary models. The magnitudes for wavelengths above 5µm are obtained by computing the blackbody distribution at 15.5µm where the brightness is supposed to be an almost perfect blackbody (no features) and by interpolating the magnitudes between 5 and 15.5µm. (Hanot et al. 2009, in prep.)
4 C. HANOT, O. ABSIL, D. MAWET, P. RIAUD, D. DEFR`ERE AND J. SURDEJ
Name Mov group Dist (pc) Age (Myr) Sp Type Kmag Nmag Mass (10AU) Mass (20AU)
203 β Pic 39.1 12 F2 IV 5.4 5.12 9.5 / 4 0.75 / 2.5 2884 Tuc - Hor 41 30 B9 V 4.48 4.2 35 / 8 7.5 / 5.75 2885 Tuc - Hor 46 30 A2 V 4.11 4.13 45 / 11 30 / 5.5 3003 Tuc - Hor 47 30 A0 V 4.98 4.87 40 / 9 11 / 5.75 12894 Tuc - Hor 47.2 30 F2 V 5.45 5.23 25 / 8 8 / 6 14082 β Pic 39.4 12 F5 V 5.79 5.83 5.5 / 3.5 0.3 / 2 14228 Tuc - Hor 47.5 30 B8 V 4.13 3.8 65 / 11 22 / 7.5 16978 Tuc - Hor 47 30 B9 V 4.25 4.13 45 / 11 15 / 7.5 17332 AB Dor 32.6 50-70 G0+G5 5.52 5.43 9 / 7 0.45 / 5.5 25457 AB Dor 19.2 50-70 F5 V 4.18 4.24 0.5 / 5.5 0.39 / 6 29391 β Pic 29.8 12 F0 V 4.54 4.29 9.5 / 3.5 0.9 / 6.5 35850 β Pic 26.8 12 F7/8 V 4.93 5.08 3 / 3 0.15 / 2 98736 Castor 32 200 G5 6.03 6.47 3/ - 0.375 / -146624 β Pic 43.1 12 A0 (V) 4.74 4.59 17 / 6 2 / 2.5 164249 β Pic 46.9 12 F5 V 5.91 5.83 10 / 4.5 3 / 2 165189 β Pic 43.9 12 A5 V 4.39 4.5 19 / 7 4 / 4 172167 Castor 7.75 200 A0 V 0.13 0.1 6/ - 1 / -172555 β Pic 29.2 12 A5 IV/V 4.3 4.27 9.5 / 3.5 0.3 / 2.5 181296 β Pic 47.7 12 A0 V 5.01 4.87 19 / 7 8.5 / 2.5 181327 β Pic 50.6 12 F5/6 V 5.91 5.84 13 / 5 5 / 2.5 195627 Tuc - Hor 27.6 30 F0 V 4.8 4.7 7.5 / 5 0.33 / 4.25 199143 β Pic 47.7 12 F8 V 5.81 5.99 12 / 5 2.5 / 2.5 207964 Tuc - Hor 46.5 30 F0 IV 4.9 4.8 35 / 7 3 / 4.25 210027 Castor 11.75 200 F5 V 2.56 2.85 3/ - 0.5 / -217343 AB Dor 32.1 50-70 G3 V 5.94 5.89 6 / 6 0.3 / 5 224392 Tuc - Hor 49 30 A1 V 4.82 4.77 50 / 9 6 / 4.25 GJ 226.2 Castor 25 200 K8 V 6.67 6.65 3/ - 0.375 / -GJ 466 Castor 39.87 200 M0 V 7.18 6.96 7.5/ - 1 / -GJ 842.2 Castor 21 200 M0.5 6.73 6.86 0.45/ - 0.25 /
-Table 1. -Table summarizing the sensitivity of both SPHERE and MIRI for extra-solar planet detection for two orbital distances of the companions: 10 and 20 AU. The bold values correspond to SPHERE and the other one to MIRI. These masses are specified in Jupiter masses. Hanot et al. 2009, in prep.