HAL Id: hal-00250688
https://hal.archives-ouvertes.fr/hal-00250688
Submitted on 7 Oct 2010
HAL is a multi-disciplinary open access
archive for the deposit and dissemination of
sci-entific research documents, whether they are
pub-lished or not. The documents may come from
teaching and research institutions in France or
abroad, or from public or private research centers.
L’archive ouverte pluridisciplinaire HAL, est
destinée au dépôt et à la diffusion de documents
scientifiques de niveau recherche, publiés ou non,
émanant des établissements d’enseignement et de
recherche français ou étrangers, des laboratoires
publics ou privés.
Pseudo No Reference image quality metric using
perceptual data hiding
Alexandre Ninassi, Florent Autrusseau, Patrick Le Callet
To cite this version:
Alexandre Ninassi, Florent Autrusseau, Patrick Le Callet. Pseudo No Reference image quality metric
using perceptual data hiding. Human Vision and Electronic Imaging, Jan 2006, San Jose, United
States. pp.146-157. �hal-00250688�
Cover Page
1) Title of the paper:
Pseudo No Reference image quality metric using perceptual
data hiding
2) authors’ affiliation and address:
IRCCyN-IVC, (UMR CNRS 6597), Polytech' Nantes
Rue Christian Pauc, La Chantrerie, 44306 NANTES, France.
Tel : 02.40.68.30.52
Fax : 02.40.68.32.32
3) e_mail address:
[email protected]
4) Journal & Publisher information:
SPIE Human Vision and Electronic Imaging
http://electronicimaging.org/program/06/
5) bibtex entry:
@inproceedings{IIHMSP07,
author = {F. Autrusseau and P. Le Callet and A. Ninassi},
title = {A study of content based watermarking using an
advanced HVS model},
booktitle = {IEEE International Conference on Intelligent
Information Hiding and Multimedia Signal Processing},
year = {2007},
pages = {485-488}
}
Pseudo No Reference image quality metric using perceptual
data hiding
Alexandre Ninassi, Florent Autrusseau, Patrick Le Callet
Ecole Polytechnique de l’Universite de Nantes, IRCCyN lab., Rue Christian Pauc, La
Chantrerie, BP 50609, 44306, Nantes Cedex3, France
ABSTRACT
Image quality assessment have been extensively studied during this past few decades. It is obviously very important to provide a mean to judge an image’s quality without having to ask to human observers for a subjective image quality evaluation. Many computer softwares have been build in this aim. This is called objective quality assessment. Such metrics are usually of three kinds, they may be Full Reference (FR), Reduced Reference (RR) or No Reference (NR) metrics. We focus here on a new technique which recently appeared in quality assessment metrics: data-hiding-based image quality metric. Regarding the amount of data to be transmitted for quality assessment purpose, this latter is placed in between RR and NR metrics. A little overhead due to the embedded watermark is added to the image. A perceptually weighted watermark is embedded into the host image, and an evaluation of this watermark leads to assess the host image’s quality. In such context, the watermark robustness is crucial. The watermark must resist to most attacks, but it must also be degraded along with the image distortion. Our work is compared to existing metrics in terms of the correlation (et de RMSE ?) with subjective assessment and in terms of data overhead induced by the mark.
1. INTRODUCTION
The main goal of image quality assessment is to find an automatic metric which provides computed quality scores well correlated with the ones given by human observers. Image quality metrics can be divided in three categories:
- full reference metrics (FR) for which the original image and the distorted image are required,
- reduced reference metrics (RR) for which a description of the original image into some parameters and the distorted image are both required,
- and no reference (NR) metrics which only require the distorted image.
Only RR and NR metrics are convenient for QoS monitoring since transmitting the whole reference image is not realistic at all. Ideally for such applications, NR metrics are the best choices since no extra data is added to the bit stream. But these metrics are quite complex to develop since the only way to access the original image is through distortions. As an alternative way of implementing a NR metric, we propose an objective quality metric based on data hiding. Such technique can be considered as NR metric, but it is quite abusive since watermark imply little overhead. On the other hand, this is not really a RR metric since neither content description is transmitted. In fact, it is just based on the idea that the embedded data is affected in the same way that the initial content. Thus, assessing the embedded data quality corresponds to assessing the host image’s quality.
Recently, embedding techniques have been used for several purposes: finger printing, multimedia indexing, context base retrieval, etc. A more recent application has been the use of embedding techniques to estimate video quality at the receiver [1, 2, 3, 4, 5].
An embedding system with watermarking purposes has to satisfy two main constraints: - Invisibility : the mark should not affect the perceptual quality.
- Robustness : the mark cannot be altered by malicious (an attempt to alter the mark) or unintentional (compression, transmission) operations.
Using the embedding system with the purpose of estimating the quality of the host media changes the importance of these constraints. Invisibility, for example, is a very important constraint. Robustness, on the other hand, is not so important. In fact, if the mark is too robust, the extracted mark will not be affected until
the video is already very degraded. Besides that, increasing the robustness generally increases the visibility of the mark. If the mark is too fragile, the extracted mark will be lost for small distortions making it difficult to differentiate between medium or highly degraded videos. We would like our mark to be semi-fragile and degrade at around the same rate as the host media.
One of the most advanced work in that topic have been proposed by FARIAS et al. [1, 2] for video. In their work, a two-dimensional binary mark is embedded in the DCT domain. A spread-spectrum technique is employed to hide the mark, by using a set of uncorrelated pseudo-random noise (PN) matrices (one per each frame) which are later multiplied by the reference mark (the same for the whole video). Unfortunately, embedding marks into images or video may introduce undesired distortions or artifacts degrading the perceived quality. The visibility and annoyance of these artifacts depend on several factors like the domain where the mark is being inserted, the embedding algorithm, and the strength of the mark. To tackle this issue, Farias have included the design of the system a psychophysical experiment to evaluate the visibility and annoyance of the artifacts caused by the embedding algorithm. The results show that the choice of either mark image does not affect the visibility and annoyance of the embedding impairments significantly. The annoyance and psychometric functions vary considerably depending on the physical characteristics of the particular video. According to us, this is mainly due to the masking effect that varies with content.To avoid such empirical approach and take benefit from recent models of masking effect, we propose in this paper an embedding method based on a psychovisual model that allows to control analytically the mark visibility. We exploit this technique to assess quality of still color images and we compare quality metric performances with classical metric of the literature.
This paper is decomposed as follows. Section 2 is devoted to the watermarking technique, the watermark embedding and detection processes are both presented. The quality assessment metric is presented in section 3, where the choice of the frequency sub-bands as well as the watermark size are argued. Finally, some results are given in section 4, where comparisons with other existing techniques are shown.
2. THE WATERMARKING TECHNIQUE
We opted for a strictly localized frequency content watermark embedding. To fulfill the optimal perceptual constraint, we adapt the watermark strength using a visual mask established from highly sophisticated human visual system model. This visual mask provides quantization noise visibility thresholds for each spatial image site. This perceptual model takes into account very advanced features of the Human Visual System (HVS), fully identified from psychophysics.
2.1. Perceptual mask
Like in most approaches, we use a subband decomposition defined by analytic filters for luminance supposed to describe the different channels of the human vision system and so the visual filtering. Previous study have been conducted in our lab in order to characterize this decomposition, the experiments were based on the measurement of the masking effect between two complex narrow band limited signals. For still images, we need to use four radial frequency channels, one low-pass called I with radial selectivity 0 cy/deg to 1.5 cy/deg and three bandpass called II, III, IV with radial selectivity respectively 1.5 cy/deg to 5.7 cy/deg, 5.7 cy/deg to 14.1 cy/deg, 14.1 cy/deg to 28.2 cy/deg. The three bandpass are decomposed into angular sectors associated with orientation selectivity. The angular selectivity is 45deg for subband II and 30deg for subbands III and IV. The masking effect model is based on the visibility produced by quantization of the content of a particularly subband rather than the visibility of any increments or any white gaussian noises. Previously, we have shown that perception of quantization noise on Lij at location (m,n) is directly dependent on the ratio between Lij and the average luminance at this location. This latter is computed from the subbands having a lower radial frequency. This ratio is therefore a local contrast Cij given by :
Ci,j(m, n) = Lij(m, n) !i−1 k=0 !Card(l) l=0 Lk,l(m, n) (1)
Psychovisual tests performed on the different visual channels have shown that local contrasts must be always uniformly quantized in order to achieve a just noticeable quantization law, the quantization step being dependent
of the visual subband considered. Inter-channels luminance masking effect is partially taken in account by this model, the model fails for masking effect along directional adjacency. So we have completed this model with further experiments and it has been successfully implemented in a visual coding scheme.In a watermarking context the model is very useful since it provides the maximum luminance variation that can be applied for each (i,j) sub-band and for each (m,n) pixel position without providing visible artifacts. We can define a spatial mask given by
∆Li,j(m, n) = ∆Ci,j× Li,j(m, n) (2)
∆Ci,jare the quantization thresholds measured from psychophysics experiments for each i,j sub-band and
Li,j(m, n) is the local mean luminance for the i,j sub-band and for each (m,n) position.
2.2. Watermark embedding
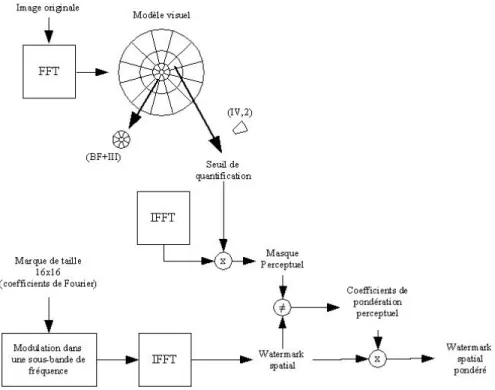
A frequency domain watermark (noise) restricted into a single visual sub-band is then built and its spatial representation is computed. Finally, this spatial watermark with limited frequency content is scaled according to its corresponding visual mask.
As mentioned in the introduction, our aim in this work is to provide a perceptually optimized watermarking scheme able to resist to most attacks and especially to geometrical distortions. The watermark amplitude must be weighted according to the visual mask. Although the visual mask is spatially defined, the Fourier transform linearity allows to use the same weighting coefficient independently in spatial or Fourier domain. A Fourier coefficients watermark is then built and modulated onto a frequency carrier. Finally a perceptual weighting coefficient Ki,j is computed from the watermark’s spatial domain representation and the sub-bands dependent
visual mask. Ki,j is given in equation 3
Ki,j= argminm,n " |∆LWi,j(m, n) S(m, n) | # (3)
where ∆Li,j(m, n) represents the previously defined visual mask and WS(m, n) depicts the watermark’s spatial
representation before weighting process by factor Ki,jfor each (m, n) spatial position. Figure 1 summarizes both
Figure 1. Watermark embedding technique
2.3. Watermark detection
Regarding to the embedding process, the extraction technique is straightforward, the cross-correlation function computed between the watermark and the extracted marked and possibly attacked Fourier coefficients. A correlation peak will prove the watermark presence in these coefficients.
The main advantages of the method are:
- control of the mark visibility : in our case watermark is invisible
- mark is independent of the content. For image quality assessment, only watermarked image is transmitted. The detection process performs a cross-correlation between the stored watermark and the Fourier coefficients surrounding the known frequency carrier extracted from the marked image. This cross-correlation values are then compared to a detection threshold in order to certify the watermark presence in the modified coefficients. The only needed data for the retrieval procedure are the original watermark, and its frequency carrier.
3. THE QUALITY METRIC
The proposed watermarking techniques allows to embed mark in different frequency and orientation range. For quality assessment purpose, we have elected to embed several marks.
To be efficient, a quality metric cannot be limited to evaluate distortions on a part only of the frequential information of an image. This is the reason why, in our metric we will insert marks both in the averages and the high frequencies of the image. For each mark, the watermarking scheme presented previously will be used. We will pick on several subbands of our perceptual subband decomposition (DCP) so that our metric will have several mesuring points on the frequential content of the source image.
The mark insertion, using the technique presented previously, modifies the original image in an invisible way for an observer, however the contents of the image are definitely modified. It is not possible to calculate the
visual masks once and for all, and then to insert all the marks. The insertion of a mark in a given subband of our perceptual subband decomposition will modify the visual masks of all the higher subbands. So as to guarantee the invisibility of the multi-mark insertion, we must calculate the visual mask at the right time (i.e. after dependent insertion).
For this study, we embed 8 watermarks :
a. 6 watermarks in high frequencies (one mark in each subband) b. 2 watermarks in middle frequencies into two different subbands
Figure 2. Spectrum of a multi-marked image (avion)
After applying an image processing (compression scheme or filtering), we measure for each mark the inter correlation (cf. figure 3)between the original mark and the corresponding coefficient of the watermarked image. Therefore, we get 8 values of inter correlation (Max). The quality score is obtained in two steps : first, we compute the mean Mhf of the cross-correlation obtained with the high frequency marks, and the mean Mmf of the cross-correlation obtained with the middle frequency marks. Then, quality score is given by the mean of Mhf and Mmf.
(a) Mark(1) from Figure 2 (b) Mark(2) from Figure 2 Figure 3. Inter correlation example of a MF (a) and a HF (b) mark
The quality score Q obtained lies between 0 and 1. Whatever the quality metric we want to test against subjective scores resulting from psychovisual experiments, the use of a psychometric function is necessary. This function will make it possible to make the mapping between objective quality scores Q and subjective quality scores MOS (Mean Observer Score). This way of doing is approved and recommended by VQEG (Video Quality Experts Group)∗. The psychometric function used in our case is the function with 3 parameters given by the
equation:
M OSp = b1
1 + e−b2∗(Q−b3), (4)
in which MOSp is the predicted MOS, Q is the quality score given by the metric, and b1, b2 and b3 are the parameters of the psychometric function.
When the MOSp are calculated, it is then possible to evaluate the metric efficency against subjective scores. Before finding the final combination of the intercorrelation values, we tested various combinations:
• Q1 : the mean of the 8 values HF and MF.
• Q2 : the mean of the mean Mhf (6 HF values) and Mmf (2 MF values).
• Q3(α) : a combinaison of the mean Mhf (6 HF values) and Mmf (2 MF values)†
Distortions Q1 Q2 Q3(α) All database RMSE 0,840 0,784 0,784
CC 0,739 0,777 0,777 All color database RMSE 0,860 0,791 0,791 CC 0,722 0,771 0,771 Jpeg2000 RMSE 0,955 0,955 0,955 CC 0,743 0,774 0,774 Jpeg RMSE 0,687 0,688 0,688 CC 0,824 0,823 0,823 Blur RMSE 0,828 0,828 0,828 CC 0,926 0,926 0,926
Table 1. Comparison between the different combinations
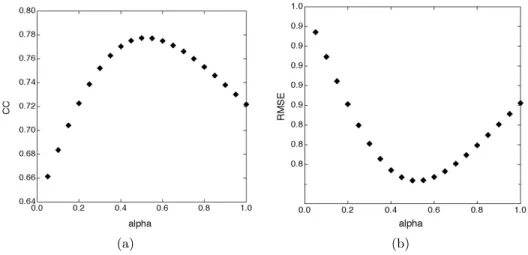
We observe that Q2 and Q3(α) have the same value. In the table above we find the best value of Q3(α), which minimizes the RMSE (Root Mean Square Error) and which maximizes the CC (Correlation Coefficient) ((cf figure ??). This value is obtained for α = 0, 5, what explains the equality between Q2 and Q3(α).
If we compare Q1 and Q2, we can notice that Q2 is much better on all the database, as well in term of minimization of the RMSE, as in term of maximization of the CC. Besides, we can do the same observation on the subsets of images corresponding to the images colors and the Jpeg2000 attacks. For the subsets of images corresponding to Jpeg and Blur attacks, the results of Q1 and Q2 are appreciably the same. This is why we chose the combination Q2 for the computation of the quality score in our metric.
In order to optimize the data detection, several watermark sizes have been tested. In our case, we needed to find a right robustness level. As we said before, for the quality assessment, the watermark must not be too robust or too fragile. The detection reliability is closely related to the watermark length. Too small watermarks usually cause important false detection results, whereas the reliability increases with the watermark size. We tested the watermarking detection reliability with severals images, each underwent typical attacks for eight different
∗http://www.its.bldrdoc.gov/vqeg/projects/rrnr-tv/RRNR-tv _draft_v1_7g.doc †The combinaison is : Q(α) = α ∗ Mhf + (1 − α) ∗ Mmf, with α lies between 0 and 1.
(a) (b) Figure 4. CC and RMSE variation according to α for Q3(α)
watermark lengths. Square shaped watermarks of size: 6 × 6, 8 × 8, 12 × 12, 16 × 16, 20 × 20, 24 × 24, 28 × 28 and 32 × 32 were independently embedded into each images’ spectrums, several distortions were applied and the detection process was performed. It appears that for a watermark size above 16 ×16 (256 coefficients), the scheme’s robustness sensibly decreases for most attacks. It also appear that for a watermark size under 8 ×8 (64 coefficients), the scheme’s robustness sensibly are really too low for most attacks. Once a single watermark size defined, we then tested the detection capabilities of our algorithm for multiple watermark embedding, and we choosed a 8 ×8 watermark size for MF and a 10 ×10 watermark size for the HF.
4. RESULTS
We have built a database in order to compare the criterion performance with human judgements. We used 170 images from 3 different processing : Jpeg, Jpeg 2000 and Blurring, and from 10 originals images. These algorithms have the advantage to generate very different type of distortions. Subjective evaluations were made in normalized conditions at viewing distance of 6 times the screen height using a DSIS (Double Stimulus Impairment Scale) method with 5 categories with 15 observers. Distortions for each processing and each image have been optimised in order to cover uniformly the subjective scale. We propose to compare metric performance with 4 others metrics of the literature. Two of them are NR metric, one concerning Jpeg [6] and the other Jpeg2000 [7]. The other two are RR metric supposed to be generic [8, 9]. In order to map score given by the metrics with subjective score, we use a the psychometric function (equation 4)define by VQEG.To qualify performance of image quality criterion, we calculate RMSE for accuracy testing (subjective score between 1 and 5); correlation coefficient CC for monotonicity testing. Results are shown in next table.
First of all, we will compare the evolution of the MOS and MOSp according to the different images (cf figure 5 and figure 6).
We decided to show this evolution for the Jpeg and Jpeg2000 distortions because they are representative compression methods of what we find in the literature.
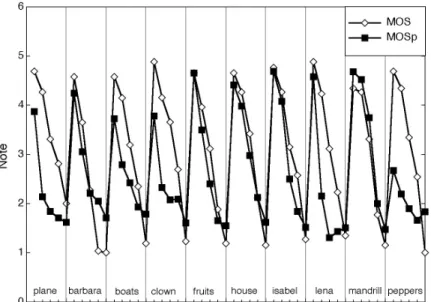
On these curves (figure 5 and appears 6), we can see for each image in abscissa the MOS value and the MOSp value in ordinate. For each original image, we will have 5 degraded versions ordered by level of increasing degradation, the degraded images are gathered according to their image orginale. For example, on the figure 5, the first 5 abscissa correspond to 5 versions of the image avion, each version being degraded by an increasingly significant Jpeg2000 compression.
We can observe on these 2 curves, that overall MOSp follows the MOS, which is a good thing. It is also noticed that all the images do not give the same results. Images like fruit, house, isabe and mandr give excellent results where the MOSp and the MOS practically merge. On the other hand, we observed that on images like
avion and piment the results are definitely worse, even if the tendency of evolution is respected. It remains the images barbara, clown, boats and lena where the results are relatively good.
So the contents of the image have a significant effect on the effectiveness of our metric. It is noted that the images containing many textures and contours (thus much of HF) are evaluated much better than the images containing many uniform zones and few textures and contours (like piment).
Figure 5. MOS and MOSp according to Jpeg2000 distortions
Figure 6. MOS and MOSp according to Jpeg distortions
with a set of points forming a line of equation MOS = MOSp.
4.1. All database
On the whole database, we notice that our metric and that Canrnec RR metric are worth according to the 3 indicators. On the other hand the Wang RR metric are far behind according to the 3 indicators. However we cannot really say that our metric is worth that RR of Carnec in the absolute, because the Carnec RR metric was carried out to evaluate images colors, but in the database there are 20 monochromic images corresponding to the Lumi attacks. What we can say here, it is that our metric with the advantage of not needing no a priori on distortions, it works on color images as well as on monochromic images.
Metrics RMSE CC Inlier Ratio Our metric 0,784 0,777 54,71% Carnec RR 0,807 0,762 55,29% Wang RR 1,122 0,434 30,00%
Table 2. Comparison between different quality metrics on all the database.
We notice on graphics in the figure 7, that the set of points of our metric and that Carnec RR metric are the nearest approach to the line MOS = MOSp.
(a) Proposed metric prediction (b) Carnec metric prediction
(c) RR Wang metric prediction
4.2. Jpeg distortions
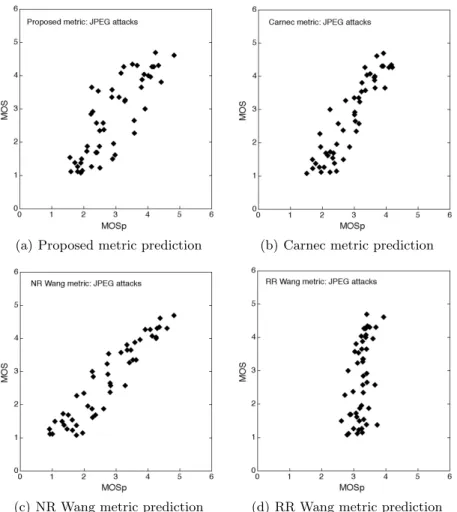
On the subset of images resulting from Jpeg distortions, the comparison will be done with an additional metric which is Wang NR metric specialized in the evaluation of images having undergone Jpeg compression distortions.
(a) Proposed metric prediction (b) Carnec metric prediction
(c) NR Wang metric prediction (d) RR Wang metric prediction Figure 8. MOS according to MOSp for Jpeg distortions.
We can notice that this time it is the NR metric of Wang which is at the head with excellent result on all the indicators. We will find in second position the Carnec RR metric with good results. Then our metric with still correct results comes. Once again the RR metric of Wang is in last position. It is interesting to note that a NR metric exceeds the RR metric, but it should be emphasized that this NR metric is based on a priori significant on distortions. It should be emphasized here that our metric can be regarded as pseudo NR, and that it is not based on a priori on distortions.
Metrics RMSE CC Inlier Ratio Our metric 0,688 0,823 54,00% Carnec RR 0,585 0,911 66,00% Wang RR 1,169 0,470 30,00% Wang NR 0,396 0,940 78,00%
We notice on graphics in the figure 8, that the set of points of our metric, the one of the Carnec RR metric, and especially the one of the Wang NR metric are the nearest approach to the line MOS = MOSp.
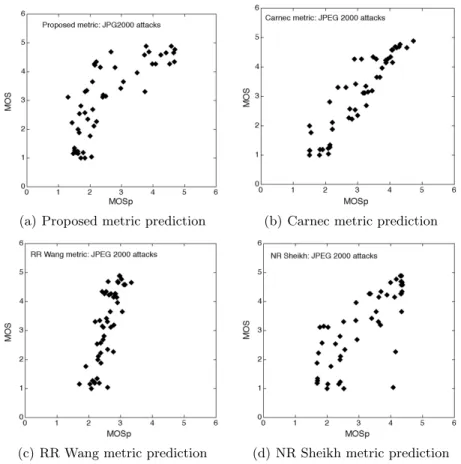
4.3. Jpeg2000 distortions
On the subset of images resulting from Jpeg2000 distortions, the comparison will be done with an additional metric which is the Sheikh NR metric specialized in the evaluation of images having undergone Jpeg2000 com-pression distortions.
Metrics RMSE CC Inlier Ratio Our metric 0,955 0,774 46,00% Carnec RR 0,560 0,921 64,00% Wang RR 1,170 0,799 30,00% Sheikh NR 0,822 0,771 56,00%
Table 4. Comparison between different quality metrics on Jpeg2000 distortions.
It is noticed that for this type of distortions, the Carnec RR metric is effective since it obtains the best values for the 3 indicators. Then, the second position is shared. Our metric and the Sheikh NR metric are rather close. The Sheikh NR metric obtains a better RMSE and better Inlier Ratio, but our metric obtains a better CC. The Wang RR metric obtains the second better CC, but obtains a bad Inlier Ratio and a bad RMSE. It is difficult to decide between the last 3 metric. From the graphics of the figure 9 we would tend to privilege our metric and that Sheikh NR compared to the Wang RR metric.
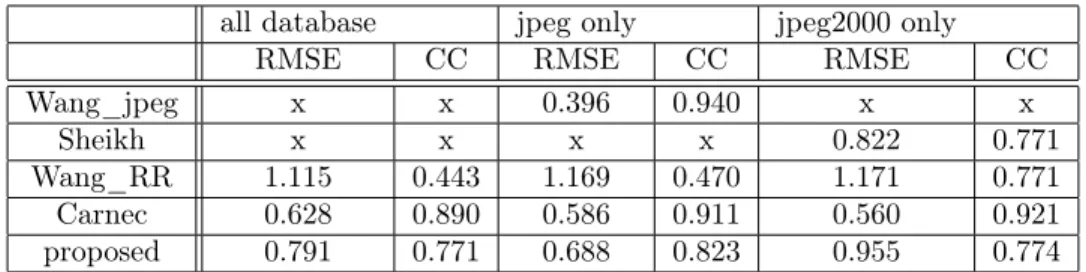
Table 5. RMSE and CC results
all database jpeg only jpeg2000 only RMSE CC RMSE CC RMSE CC Wang_jpeg x x 0.396 0.940 x x
Sheikh x x x x 0.822 0.771 Wang_RR 1.115 0.443 1.169 0.470 1.171 0.771 Carnec 0.628 0.890 0.586 0.911 0.560 0.921 proposed 0.791 0.771 0.688 0.823 0.955 0.774
Carnec metric is the best in all cases (except for Jpeg where wang_jpeg provides excellent results). Concerning the proposed metric, results seems equivalent to others (except Carnec) for Jpeg2000, correct for Jpeg. If we consider all the database, the metric is much more robust than Wang_RR. So it constitutes a good alternative to RR metric.
5. CONCLUSION
We proposed here a new image quality assessment metric exploiting the data hiding principle. The watermarking technique exploits an advanced HVS model in order to ensure both the mark’s invisibility and its robustness. In this application, the watermark have to be quite robust in order to be retrived after strong image distortions. The quality metric performances are compared to other standard metrics, and a correlation factor with the predicted visual quality (subjective assessment) is given.
(a) Proposed metric prediction (b) Carnec metric prediction
(c) RR Wang metric prediction (d) NR Sheikh metric prediction Figure 9. MOS according to MOSp for Jpeg2000 distortions.
References
[1] M. Farias, M. Carli, J. Foley, and S. Mitra, “Detectability and annoyanceof artifacts in watermarked digital videos,” in EUSIPCO’2002, Proc. XI European Signal Processing Conference (EUSIPCO), Toulouse, France, 2002.
[2] M. Farias, M. Carli, and S. Mitra, “Video quality objective metric using data hiding,” in MMSP’2002, Proc. IEEE Workshop on Multimedia Signal Processing (MMSP) 3, pp. 464–467, 2002.
[3] M. Farias, S. Mitra, M. Carli, and A. Neri, “A comparison between anobjective quality measure and the mean annoyance values of watermarked videos,” in ICIP’2002, in Proc. IEEE Intl. Conf. on Image Processing, Rochester, NY, USA 3, pp. 469–472, 2002.
[4] O. Sugimoto, R. Kawada, M. Wada, and S. Matsumoto, “Objective measurementscheme for perceived picture quality degradation caused by mpeg encoding without any reference pictures,” in SPIE Electronic Imaging, in Proc. SPIE Human Vision and Electronic Imaging, SanJose, CA, USA 4310, pp. 923–939, 1998.
[5] M. Holliman and M. Young, “Watermarking for automatic quality monitoring,” in SPIE Electronic Imaging, Proc. SPIE Security and Watermarking of Multimedia Contents, San Jose, CA, USA 4675, 2002.
[6] Z. Wang, H. R. Sheikh, and A. C. Bovik, “No-reference perceptual qualityassessment of jpegcompressed images,” in ICIP’2002, IEEE International Conference on ImageProcessing, 2002.
[7] H. R. Sheikh, A. C. Bovik, and L. K. Cormack, “No-reference quality assessment using natural scene statistics: Jpeg2000,” IEEE Transactions on ImageProcessing , 2002.
[8] Z. Wang and E. P. Simoncelli, “Reduced-reference imagequality assessment using a wavelet-domain natural image statisticmodel,” in EUSIPCO’2002, Proc. XI European Signal Processing Conference (EUSIPCO), Toulouse, France, 2002.
[9] M. Carnec, P. L. Callet, and D. Barba, “A new image quality assessment method with reduced reference,” in SPIE VCIP, VCIP 2003, 2003.