HAL Id: hal-00324052
https://hal.archives-ouvertes.fr/hal-00324052
Submitted on 23 Sep 2008HAL is a multi-disciplinary open access archive for the deposit and dissemination of sci-entific research documents, whether they are pub-lished or not. The documents may come from teaching and research institutions in France or abroad, or from public or private research centers.
L’archive ouverte pluridisciplinaire HAL, est destinée au dépôt et à la diffusion de documents scientifiques de niveau recherche, publiés ou non, émanant des établissements d’enseignement et de recherche français ou étrangers, des laboratoires publics ou privés.
Using disparity for quality assessment of stereoscopic
images
Alexandre Benoit, Patrick Le Callet, Patrizio Campisi, Romain Cousseau
To cite this version:
Alexandre Benoit, Patrick Le Callet, Patrizio Campisi, Romain Cousseau. Using disparity for quality assessment of stereoscopic images. IEEE International Conference on Image Processing, ICIP 2008, Oct 2008, San Diego, United States. �hal-00324052�
USING DISPARITY FOR QUALITY ASSESSMENT OF STEREOSCOPIC IMAGES
Alexandre Benoit
+, Patrick Le Callet
+, Patrizio Campisi
*, Romain Cousseau
++IRCCyN, Ecole polytechnique de l’Université de Nantes, Rue Ch. Pauc, la chantrerie, 44306 Nantes Cedex 3, Nantes, France
phone: +33.2.40.68.30.47, fax: +33. 2.40.68.32.32 e-mail: alexandre.benoit@univ-nantes.fr , Patrick.Lecallet@univ-nantes.fr
*Dipartimento di Elettronica Applicata, Università degli Studi di Roma “Roma Tre”, Via della Vasca Navale 84, 00146 Roma, Italy
phone: +39.06.55177064, fax: +39.06.55177026, e-mail: campisi@uniroma3.it
ABSTRACT
3DTV has been widely studied these last years from a tech-nical point of view but the related quality evaluations does not follow this enthusiasm.
This article reviews the quality assessment for 3DTV. Com-pared to 2D quality measure, the third dimension adds sever-al new problems and qusever-ality assessment becomes a complex issue. Nevertheless, efforts made for 2D content quality es-timation can be used for an extension to 3D. In this paper we propose a first attempt to adapt such 2D metrics to 3D con-tent and add the contribution of a measure of the distortion on the disparity map for stereoscopic image pairs. This 3D metric performances has been evaluated with subjective tests.
Index Terms quality assessment, 3D, 2D metrics,
dispar-ity distortion
1. INTRODUCTION
The aim of the paper is to review the quality assessment issue for 3D visualisation and present an attempt to assess 3D im-age quality. 3D imaging is a wide research area in which en-thusiastic research efforts have been recently revealed in [1]. From John Logie Baird who introduced the first version of stereo TV, many approaches have been developed [2]: stereo-scopic vision with glasses, auto stereostereo-scopic displays, holo-graphic systems. In parallel, methods for 3D scene represent-ation [3] and data content broadcasting [4] have been widely studied.
Nevertheless, even if technology solutions are now available, the issue of stereo images quality evaluation has to be invest-igated in depth. Indeed, contrary to the 2D imaging com-munity, no 3D quality metric has already been developed. Several new problems appear when dealing with 3D which are also linked to human factor such as accommodation prob-lems and 3D artefacts perception [5]. However, requirements for perceptual quality evaluations have already been identi-fied [6] opening a way to investigate 3D quality metrics. Up to now, few objective quality metrics have been pro-posed, the task is difficult and the idea should be to involve 2D metrics. For example in [7] a method which uses 2D quality metric for the quality assessment of stereo images is
proposed. We present in this work an improvement of this method by taking into account the disparity map between ste-reoscopic image pairs.
The paper is presented as the following: section 2 presents a review of quality issue in 3D. Section 3 presents the subject-ive tests on which this work is based. Section 4 and 5 present respectively the objective quality metric we propose and the related results.
2. QUALITY ISSUE IN 3D
3D quality measure constitutes a real challenge for several reasons. First, from a technical point of view, many ap-proaches have been developed. From stereo vision using glasses which requires stereo image pairs to multivue auto-stereoscopic displays which use multiple views of a visual scene or a 2D image plus related pixel depth, it is difficult to built an objective metric able to cope with all these formats. Second, from a visual point of view, 3D perception involves new critical points which have to be taken into account. We can draw a short list of the psychovisual measures that this new scene representation should include:
. Image quality from an imagine coding point of view: arte-facts such as blockiness, blurring, jerkiness and ghosting are caused by the algorithm involved in the image coding pro-cess (spatial filtering, temporal low pass filtering and resolu-tion reducresolu-tion).
. Depth precision: as the depth of the image can be rendered using different technologies and data formats, depth repres-entation and coding impact on the visual perception.
. Field of view: can the observer move his head freely and perceive behind the boundaries of the objects without per-ceiving artefacts.
. Human factors: in addition to the image quality evaluation from a technology point of view, we can address another problem which is linked to human perception. We can distin-guish several factors, general problems such as depth percep-tion, accommodation problems but also physiological differ-ences between people which induces different perception (age, inter-pupillary distance etc.). All these factors are diffi-cult to integrate but they yield to visual discomfort, perceived 3D distortions, etc. For example, when evaluating image quality for stereo images, observers can give good scores to 3D scenes representation even if one of the images perceived
by one eye is highly disturbed. The visual system has indeed a tendency to compensate the lower quality perceived by an eye by the quality of the other eye perception. Nevertheless eye fatigue phenomena can be observed in such case. As a consequence, image quality assessors must take such factors into account in order to really evaluate the user experience. This brief overview shows the wide research area for quality metric design that still waits to be investigated. Nevertheless, in a first step, all the parameters can not be taken into ac-count. It is necessary to first, choose a technology and focus on a limited set of factors. Such evaluation task started re-cently for example in [8] where the impact of the compres-sion of the depth information for 2D plus depth visual scene coding on auto stereoscopic displays has been studied. The preference of the observers in regard of the compression method and related bit rates are investigated. Also, in [7] is presented the beginning of a metric design based on subject-ive measures that allows 3D image quality assessment. The aim of this work is to analyse the relevancy of 2D quality metrics applied to stereo content. Different metrics where evaluated for stereoscopic vision with glasses. Nevertheless, introducing 2D quality metrics in a 3D context is a real chal-lenge when attempting to integrate depth information. We propose an attempt for such factor integration by involving a quality metric on disparity maps between views. Then sever-al questions appears from the choice of the qusever-ality measure operator to the fusion if its result in the original metric. This first attempt is still limited to stereo vision with glasses, an extension to 2D plus depth for auto stereoscopic displays is expected in future research.
3. SUBJECTIVE STEREO QUALITY ASSESS-MENT
In [7] we proposed a methodology for subjective assess-ment of stereo images by using well established 2D image quality objective metrics. Specifically, we focused on the quality assessment when either compression (JPEG and JPEG2000) or blurring were applied symmetrically to the stereo pair.
We have applied these distortions on six different con-tents. The test was performed in a controlled environment as recommended in ITU BT 500-11, following SAMVIQ [9] protocol by using displays with active liquid crystal shutter glasses. SAMVIQ is a methodology for subjective test of multimedia applications using computer displays, whose ap-plication can be extended to embrace the full format televi-sion environment as well. The method proposed by SAM-VIQ specification makes possible to combine quality evalu-ation capabilities and ability to discriminate similar levels of quality, using an implicit comparison process. The proposed approach is based on a random access process to play se-quence files. Observers can start and stop the evaluation process as they wish and can follow their own paces in rat-ing, modifying grades, repeating play out when needed. Therefore, SAMVIQ can be defined as a multi stimuli con-tinuous quality scale method using explicit and hidden
refer-ences. It provides an absolute measure of the subjective quality of distorted sequences which can be compared dir-ectly with the reference. As the assessors can dirdir-ectly com-pare the impaired sequences among themselves and against the reference, they can grade them accordingly. This feature permits a high degree of resolution in the grades given to the systems. Further, there is no continuous sequential presenta-tion of items as in double-stimulus-continuous-quality-scale (DSCQS) method: this characteristic reduces possible errors due to a lack of concentration, thus offering higher reliabil-ity. Nevertheless, since each sequence can be played and as-sessed as many times as the observer wants, it is time con-suming and less conditions can be tested during a session.
Seventeen observers originally took part to the test. Only three of them were discarded because the correlations between their individual scores and the mean opinion score were lower than a threshold (0.85). All the other observers had correlation values higher than the threshold.
The Difference Mean Opinion Score (DMOS) for the i-th image is computed as the difference between the MOS for the hidden reference MOS and the one relative to the im-hr age i, MOSi
i hr i
D M OS = M OS − M OS . Subjective experiments lead to ninety DMOS values.
4. OBJECTIVE STEREO QUALITY ASSESS-MENT
In this Section a new metric for objective quality assess-ment is proposed. Specifically, in Section 4.1, we revise the approach proposed in [7] for the quality assessment of 3D images, where 2D metrics are applied separately to the left and right image of the stereo pair and then properly fused. In Section 4.2, we present a new metric which makes use of the depth information of the stereo pair.
4.1 Using 2D objective metrics In [7] is presented a metric dedicated to stereo vision us-ing glasses. In this work, four 2D quality metrics have been evaluated in 3D context including Structural SIMilarity (SSIM) and C4. All these metrics were applied separately on each eye and fusion methods were investigated. The correla-tion between DMOS and each of the objective metrics for each of considered distortions are given after a “mapping” operation in order to evaluate the performances of the met-rics. Specifically, mapping refers to the application of non linear function as recommended by VQEG [10] in order to map metrics scores into subjective score space. For each condition, parameters of the mapping function have been optimized. It appeared that the most effective fusion was the average of both left and right eye measure.
4.2 3D quality metrics using depth information and 2D objective met-rics
In this Section, we propose more refined metrics for the quality assessment of 3D images which stem from the ones used in [7]. However, since the metrics used in [7] suffer from the drawback that no information related to the 3D nature of the images are taken into account, we resort to take into account also the disparity map and to fuse it with the scores coming from the metrics employed in the previous method. Indeed, as well know [1, 11], the sense of stereovi-sion can be artificially induced by presenting two different images of the same scene, shifted one with respect to the oth-er, thus mimicking two different viewpoints, namely the left and the right image of the stereo pair, to the left and the right eye. The difference in the viewpoints generates disparity in the images. More in details, given two corresponding points in the left and the right image of a stereo pair the vector between the two points is called disparity. In general dispar-ity can be used to reproduce one of the two images of the ste-reo pairs having the other one. In this paper, we do not intend to study the impact of the choice of the disparity computation algorithm and chose the one described in [12].
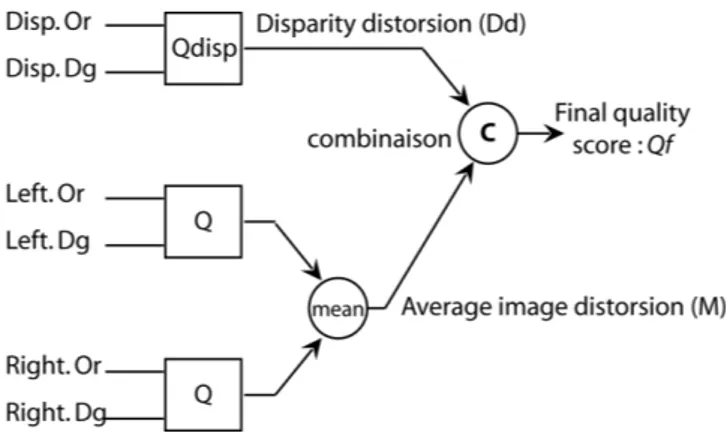
Figure 1 shows an overview of such a system.
Fig. 1: quality estimation of stereo pairs using original Left and Right views (Left.Or, Right.Or) compared with the degraded versions (Left.Dg, Right.Dg) and the related original disparity map compared to the degraded disparity map (Disp.Or and Disp.Dg).
On this figure, the distortion is measured independently between both eyes with metric Q, this metric being either SSIM or C4. These two measures are averaged in order to get the global 2D image distortion measure M. In parallel, the disparity distortion measure Dd is computed using correla-tion coefficient between the original disparity maps and the corresponding disparity maps processed after image degrada-tion (cf. Fig. 2). As disparity maps are not natural images, us-ing psychovisual based distortion metrics is non-sens, however simpler distortion methods such as correlation coef-ficient are better appropriate.
The final objective quality measure Qf is obtained after the fusion of the disparity and the averaged left and right image distortion measures. Two linear combinations have been
tested and we add a third method which only includes the disparity distortion measure Dd as it was done for M in [7]:
Qf1=M.D ½ ; Qf2=M.(1+D) ; Qf3=D
Fig. 2: original disparity map (left) and disparity map after JP-G2000 compression
5. RESULTS
We computed these quality metrics on stereo pairs when JPEG and JPEG2000 compression are performed as de-scribed in [7], using the same database. Nevertheless, con-trary to [7] where the metrics were evaluated independently on JPG and JPG2000 compressions and finally fused to get the performance on both compressions, here, we evaluate the performance of the metrics on JPG and JPEG200 compres-sions at the same time. As a consequence, we consider simul-taneously a larger spectrum of possible distortions. Results are presented on table I. We compare the correlation coeffi-cient CC obtained with the original SSIM and C4 method ap-plied to M [7] with the proposed method and related combin-ation's. After mapping, more indicators become available such as Mean Square Errors (RMSE on a scale of 100) and the number of out layers (OR) which allow in-depth perform-ance analysis.
Table I: metrics performances synthesis before mapping SSIM SSIM-Qf1 SSIM-Qf2 C4 C4 Qf1 C4 Qf2 SSIM-Qf3 CC 0,869 0,902 0,899 0,872 0,932 0,943 0,823 RMS E 10,43 10,43 10,55 11,91 8,82 8,1 13,8 OR 2 2 2 2 1 1 3
Significant performance increases can be observed with the proposed new metrics. Combinations Qf1, Qf2 always give
better results than the original metric. More precisely, Qf1 is
more efficient with SSIM method and Qf2 is more accurate
with C4 metric. In parallel, Qf3 shows that, as the original
method, using only either M or Dd is not sufficient and gives lower results.
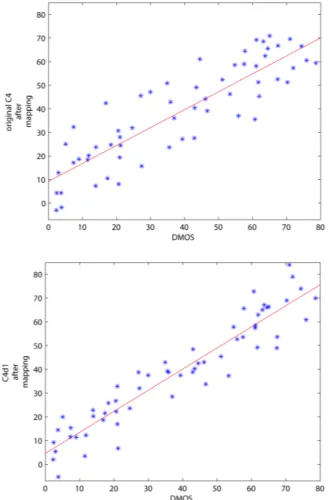
Moreover, with the proposed combinations, the number of outlayers remains constant or is reduced with C4 metric. We can also see that MSE remains stable with SSIM but is sig-nificantly reduced with C4 metric. This can be observed on
figure 3 where couples of points (DMOS, Mapped objective score) for C4 metric are shown for the original method and the new C4 with combination. On this figure, we can see the correlation coefficient increase and the RMSE reduction with the proposed new method.
Figure 3 - Couples of points (DMOS, Mapped MOS) for JPEG + JPEG2000/C4 with the original method (top) and the proposed C4/
Qf2 metric (bottom)
6. CONCLUSION
In this paper was emphasised the need of metrics for quality assessment in stereovision. An extension of the metric presented in [7] which involves the measure of the disparity map distortion was proposed. A significant metric perform-ance enhperform-ancement was observed when using linear combina-tions of the disparity map distortion and the measure of the 2D image quality on both eyes. Future work will attempt to evaluate the influence of the choice of the disparity map computation algorithm and the extension of the metric to oth-er display technologies.
7. ACKNOWLEDGMENT
This work was supported by FuturIm@ge project within the Media and Networks competitive pole from the French Pays de la Loire region.
8. REFERENCES
[1] IEEE Signal Processing Magazine, November 2007 [2] Benzie, P.; Watson, J.; Surman, P.; Rakkolainen, I.; Hopf, K.; Urey, H.; Sainov, V.; von Kopylow, C.; A Survey of 3DTV Displays: Techniques and Technologies , IEEE Trans-actions on Circuits and Systems for Video Technology, Volume 17, Issue 11, Nov. 2007 Page(s):1647 - 1658, DOI 10.1109/TCSVT.2007.905377
[3] Alatan, A.A.; Yemez, Y.; Gudukbay, U.; Zabulis, X.; Muller, K.; Erdem, C.E.; Weigel, C.; Smolic, A.; Scene Representation Technologies for 3DTV A Survey , IEEE Transactions on Circuits and Systems for Video Technology, Volume 17, Issue 11, Nov. 2007 Page(s):1587 - 1605, DOI 10.1109/TCSVT.2007.909974
[4] Smolic, A.; Mueller, K.; Stefanoski, N.; Ostermann, J.; Gotchev, A.; Akar, G.B.; Triantafyllidis, G.; Koz, A.; Cod-ing Algorithms for 3DTV A Survey , IEEE Transactions on Circuits and Systems for Video Technology, Volume 17, Issue 11, Nov. 2007 Page(s):1606 - 1621, DOI 10.1109/TC-SVT.2007.909972
[5] Lambooij M.T.M.; IJsselsteijn W.A.; Heynderickx I.; Visual Discomfort in stereoscopic Displays: A Review , SPIE-IS&T, Volume 6490, 64900I-1, January 2007
[6] Meesters, L.M.J.; IJsselsteijn, W.A.; Seuntiens, P.J.H., A survey of perceptual evaluations and requirements of three-dimensional TV , IEEE Transactions on Circuits and Sys-tems for Video Technology, Volume 14, Issue 3, March 2004 Page(s): 381 - 391, DOI 10.1109/TCSVT.2004.823398 [7] P. Campisi, P. Le Callet, and E. Marini, Stereoscopic im-ages quality assessment, European Signal Processing Con-ference (EUSIPCO) 2007, September 2007, Poznan, Poland. [8] Fehn C.; 3D TV Broadcasting , chapter from 3D Video-communication, pages: 23-38, Jan. 2006, DOI 10.1002/0470022736.ch2
[9] EBU Project Group B/VIM Video In Multimedia. SAM-VIQ: Subjective Assessment Methodology for Video Quality. May 2003.
[10] VQEG, Video Quality Expert Group, www.it-s.bldrdoc.gov/vqeg
[11] 3D Videocommunication. Algorithms, concepts and real-time systems in human centered communication , Ed-ited by O. Schreer, P. Kauff, t. Sikora, WILEY 2005.
[12] Felzenszwalb P.F.; Huttenlocher D.P.; Efficient Belief Propagation for Early Vision , International Journal of Com-puter Vision, Vol. 70, No. 1, October 2006.