OATAO is an open access repository that collects the work of Toulouse
researchers and makes it freely available over the web where possible
Any correspondence concerning this service should be sent
to the repository administrator:
[email protected]
This is an author’s version published in:
http://oatao.univ-toulouse.fr/21459
To cite this version:
Kim, Bunthern and Azzaro-Pantel, Catherine and David,
Maria and Maussion, Pascal Life Cycle Assessment for a
Solar Energy System Based on Reuse Components for
developing countries. (2019) Journal of Cleaner Production
(208). 1459-1468. ISSN 0959-6526
Official URL:
https://doi.org/10.1016/j.jclepro.2018.10.169
List of figures
Fig. 1: Architecture of the electrification system. ... 5
Fig. 2: Example of pico-hydro system in rural Cambodia. ... 5
Fig. 3: Solar PV system using conventional solution. ... 5
Fig. 4: Proposed PV system containing some second life components . ... 5
Fig. 5: Load profile of a single village in Chiangria, Thailand, [23] [24] ... 7
Fig. 6: System boundary of life cycle assessment. ... 7
Fig. 7: Normalized impacts in different midpoint categories for conventional solution, at 80 % and 95 % secondary lead in batteries. ... 12
Fig. 8: Normalized impacts in different midpoint categories for the reuse solution. ... 13
Fig. 9: Normalized impacts - comparison of the conventional (Conv.) and the reuse solutions. ... 13
Fig. 10: Comparison of influence of parameters (by -10% to +10% changes) to the impact results. ... 15
List of Tables
Table 1: Characteristics of lead-acid batteries [25] ... 8Table 2: Parameters of system components ... 8
Table 3: Component sizing of the conventional and reuse systems ... 9
Table 4: Transportation mode and distance ... 9
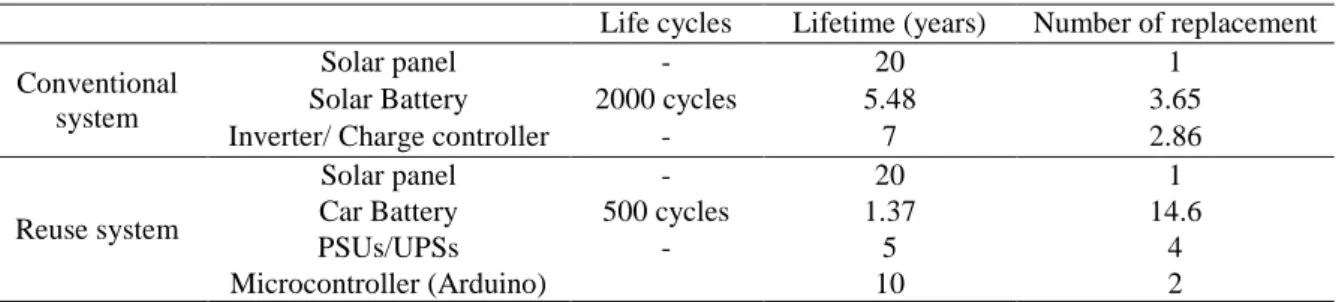
Table 5: Component service time and replacement... 10
Table 6: EcoInvent database in SIMAPRO ... 10
Table 7: Material composition (by percentage of mass) of lead-acid batteries from various sources. . 10
Table 8: Material composition of lead-acid battery by average percentage of mass. ... 11
Table 9: Energy requirement in battery manufacturing process ... 11
Table 10: Parameter influence on the environmental impact in the reuse system ... 14
Table 11: Influence of transportation distance changes on the environmental impact for both solutions ... 14
Life Cycle Assessment for a Solar Energy System Based on Reuse
Components for developing countries
Bunthern KIM, Catherine AZZARO-PANTEL, Maria PIETRZAK-DAVID, Pascal MAUSSION LAPLACE, LGC, Université de Toulouse, CNRS, INP, UPS, Toulouse, France
ABSTRACT
In many developing countries, the lack of electricity in rural areas is still a key issue for millions of people. The reuse of discarded components in renewable energy systems, based on the frugal innovation concept, has been identified as a solution for rural electrification in countries where renewable resource is plentiful. Specific emphasis is paid in this work to the application of reuse from an engineering viewpoint for a Renewable Energy System, including a “solar” element, composed of solar Photovoltaic (PV) panels and of modified Power Supply Units (PSUs), a “hydro” part and an energy storage system with used car batteries. The scientific objective of this work is to evaluate the environmental impact of this solution, considering only the solar element, as compared to a conventional system consisting of photovoltaic panels, lead-acid batteries, a charge controller and an inverter for small village consumption. For this purpose, Life Cycle Assessment (LCA) has been selected as a methodological framework and both solutions have been described and sized. The results have shown that in the reuse scenario, the impact of PSUs, Uninterruptable Power Supply Units (UPSs) and a microcontroller kit remains very low (0.12% of total impact) while PV modules contribute significantly (66% of total impact). Nevertheless, the consequences of reusing lead-acid batteries are still significant due to the combination of several effects: their weight, reduced efficiency and the need for frequent replacement. A 40% reduction of the environmental burden obtained by the reuse solution is clearly due to the absence of battery production impacts in the case of reuse. A sensitivity analysis has been performed to determine the impact of parameters such as component efficiency, lifetime and transportation distance on environmental impacts. The efficiency of repurposed PSUs and UPSs is the most significant parameter on the environmental impact categories in the reuse solution.
KEYWORDS
Life cycle assessment, sensitivity analysis, second life applications, battery reuse, power supply reuse
NOMENCLATURE
AC: Alternative Current, form of the voltage and currents delivered on the residential grid
Ah: Ampere x Hour is the classical unit for battery capacity
ATX : Advanced Technology Extended
Ebat : Daily energy to store in the batteries
EoL: End-of-Life
EPV,STC : Daily energy produced by photovoltaic (PV) module at standard test condition
EV: electric vehicle
LCA: Life Cycle Assessment
MDOD: Maximum Depth Of Discharge (of rechargeable battery)
MPPT: Maximum Power Point Tracking (control)
PCB: Printed Circuit Board
PFC: Power Factor Correction
PSUs: Computer Power Supply Units
PV: Photovoltaic
UEEE: Used Electrical and Electronic Equipment
SLI batteries: Starting, Lighting, and Ignition batteries (mainly used in automobiles)
UPSs: Uninterruptable Power Supply Units
VRLA: Valve-Regulated Lead-Acid battery
WEEE: Waste Electrical and Electronic Equipment (also called e-waste)
INTRODUCTION
Having access to affordable and reliable energy services is fundamental to reducing poverty and improving health, increasing productivity, enhancing competitiveness and promoting economic growth (International Energy Agency, 2011) While developed countries have secured access to plentiful sources of energy to drive their development, many developing countries lack sufficient and effective access to energy. According to the International Energy Agency (International Energy Agency, 2017) in 2016, 1.1 billion people (1,000 millions) globally are without access to electricity. The majority of the people in these countries live in remote rural areas. The extension of centralized grid electricity lines to rural areas faces significant challenges including high construction costs of transmission lines and transmission losses. In these conditions, it is nigh on impossible for utilities to be profitable which is largely due to the low energy consumption of rural households and insufficient population densities (Henriques and Louis, 2010) As these projects require long-term planning, they are unable to address the present challenges and effects from the use of traditional fuels by rural populations. In contrast to centralized systems, distributed energy micro-generation technologies can contribute significantly to providing energy access to the rural poor. These systems can have a lower life cycle cost and provide a range of technologies to meet specific end-use applications in developing communities more appropriately. The potential of Renewable Energy Technologies (RET) to power rural development has been understood for many decades. Because renewable energy is regionally diverse, choosing the appropriate system generally depends on the local availability of renewable energy resources and the characteristics of the local demand for electricity. Although photovoltaic lighting systems have paved the way in many rural areas around the world, other renewable energy sources –wind, small hydropower, and biomass gasification and combustion– have also been considered (Blenkinsopp et al., 2013). Yet several barriers still hamper the adoption of RETs, e.g., the lack of adequate infrastructure and technical skills, knowledge on the management, operation and regulation of RETs and substantial investment costs.
Owing to the rapid expansion of technological development, innovation and consumer demand, there has been a vast improvement in some electronic equipment that also results in shorter electronic product lifespans, and more electrical and electronic equipment waste (WEEE, or e-waste) (Liu et al., 2017). According to the United Nations University’s (UNU) global e-waste monitor (Baldé et al.,2015), the global quantity of e-waste generated in 2014 was around 41.8 million tons. This amount is expected to grow to 49.8 million tons in 2018, with an annual growth rate of 4 to 5%. The growth is beginning to reach disastrous proportions and raises serious environmental concern over the end-of-life (EoL) of WEEE. The presence of hazardous substances in obsolete electronic devices leads to the release of these substances and their by-products during recycling and disposal. This is even more problematic when e-waste is exported to developing countries since recycling and disposal takes place without safety facilities. For the time being EoL management relies mainly on conventional waste collection and processing techniques for material recovery (Parajuly et al.,2016); other EoL options including reuse, refurbishment, and remanufacturing have also proven increasingly relevant for e-products (Parajuly and Wenzel, 2017) due to the growing interest in circular economy.
This work focuses on the application of WEEE reuse in a stand-alone renewable energy system as a solution for electrification in rural areas in some developing countries. Based on the frugal innovation concept, this solution has hardly been addressed from an engineering viewpoint and has received less attention compared to End-Of-Life options such as recycling and recovery. Specific attention is given to systems with solar, hydro or wind energy. This choice is motivated by the outcomes of many international reports such as (United Nations, 2017 ) in a global survey regarding the energy access in the Least Developed Countries or in (COP21, 2015) where many developing countries listed their objectives for greenhouse gas reduction for the COP21 and their Intended Nationally Determined Contribution (INDC). It is clearly highlighted in these references that wind, hydro and solar will be the
transition energy sources. Such a solution helps slowing and closing up the resource loops which leads to a more circular business economy. It could also reduce the damage from e-waste which is growing and provide an intermediate, affordable and sustainable solution to energy access for rural communities at a reduced cost. The evaluation of the environmental impacts of this solution based on reuse components compared to a solution based on new elements is the baseline of this paper.
It must be emphasized that reuse is always considered superior to materials and energy recovery in the waste hierarchy, a concept that also applies to WEEE (Lu et al., 2017). Parts or components that have not undergone excessive deterioration can be reused as components for reassembly with savings in energy, emissions, production cost, and extraction of new raw materials. Reuse can be defined as the trading of second-hand products which are not yet at the end of their life cycle.
Used electrical and electronic equipment (UEEE) is often shipped to other countries where demands for more affordable products exist. Devices in good working order are sold and the rest becomes waste. Despite the huge quantity of electronic waste worldwide, very few papers have investigated a possible second-life of electronic components which are still in good working condition. The feasibility of reusing electric motors in consumer products at a huge saving has been studied in (Klausner et al., 1998). Some works have focused on the second life application of electric vehicle (EV) batteries due to the current growth of the electric vehicle industry. The environmental impact of smart phone repurposing as compared to traditional refurbishing using life cycle assessment has been investigated in (Zink et al. 2014). An alternative to optimized dismantling and recycling has been successively studied by the same research team in (Schofield et al., 2013) where the basic idea is to transform a part of an ATX (Advanced Technology Extended) compliant power supply, the active PFC front-end stage, into a new converter on a new PCB, dedicated to Maximum Power Point Tracking (MPPT) control for photovoltaic generators. Battery charger is investigated in [Rogers et al., 2013] with two different MPPT algorithms while cell phone charging is targeted in (Rogers et al. 2014).
The factors to be taken into consideration in evaluating a reuse solution can be categorized as technological, economic, or environmental. This paper aims to evaluate the techno-environmental aspect (thus excluding economics) of such a system when compared to a conventional system based on newly made components. The scope of this study is limited to the solar power sector for which the technological aspects have been studied and tested for feasibility. The paper is divided into four sections: the solar PV system that will be considered for a reuse scenario is presented in Section 1, then the assumptions and principles of the Life Cycle Assessment (LCA) methodology that has been used as a tool for evaluating the impact scores for both the proposed solution and the conventional one are presented in Section 2. The most significant results of the impact assessment study are analyzed in Section 3. A sensitivity analysis is then carried out in Section 4 to assess the effects of the assumptions and of possible variations in the collected data on the results.
1. REUSE-BASED SYSTEM ALTERNATIVE
The complete system (see Fig. 1) that will be considered as the “reuse” alternative includes: − a “solar” catagory, composed of solar PV panels and modified power supply units (PSUs) − a “hydro” catagory composed of modified uninterruptable power supply units (UPSs) and a
three phase induction machine (IM) turned into a single phase generator − an energy storage system composed of used car batteries
Fig. 1: Architecture of the electrification system. An isolated solar-hydro hybrid generation system with battery storage to supply a small rural village
Fig. 2: Example of pico-hydro system in rural Cambodia
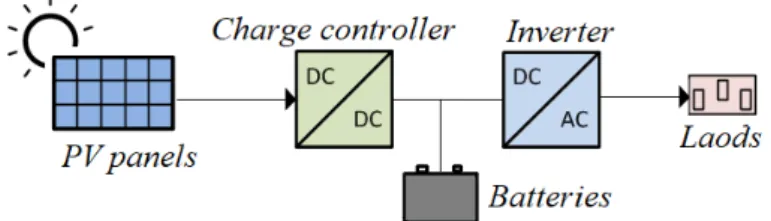
Fig. 2 shows an example of a typical pico-hydro generation system installed in Cambodia. Cheap microcontrollers (based on Arduino products worth only a few dollars) with a few interface components are added for control purposes. As aforementioned, only the “solar” elements are considered in this work. The conventional PV system, suitable for small village consumption, consists of photovoltaic panels, lead-acid batteries, a charge controller and an inverter (see Fig.3). The electric power converted from sunlight by photovoltaic panels charges the battery via the charge controller. The inverter converts the DC voltage from the battery into an AC voltage needed by the village households.
Fig. 3: Solar PV system using a conventional set-up
Conventional isolated generation system based on a photovoltaic generator. The main components are power converter (charge controller and inverter) and storage batteries
Fig. 4: Proposed PV system containing some second life components
In the proposed photovoltaic generator system, used power supply units are repurposed to replace charge controller, used UPS units to replace inverter and used SLI batteries to replace the typical deep cycle batteries
In the proposed reuse solution (Fig. 4), various components are replaced by second-life ones: the charge controller is replaced by modified PSUs, the inverter by modified UPSs and used SLI batteries replace the conventional storage batteries. The optimal power transfer from PV to batteries will be achieved by PC power supply units with small changes to connect the microcontroller and DC/DC converter of the power supply. In order to optimize the energy extraction from the sun, the MPPT control is implemented in an Arduino Due microcontroller. Deep cycle lead-acid batteries which are suitable for stationary storage applications are part and parcel of the classical solution. They are replaced here by local used automobile batteries (cheap and available almost everywhere in the world). The financial aspects deserve to be studied in more detail, but here is a glimpse of the scale of
economy. As an example of prices in Cambodia, re-used PSUs are found for less than $5 while brand new ones cost $20. A lead-acid reused car battery (12V, 60Ah) costs $10 at the corner shop in Phnom Penh which gives a price per kWh of $14. A brand new car battery costs between $50 and $70 for the same capacity, which leads to prices per kWh ranging between $71 and $100. Besides, deep cycle solar batteries are far more expensive, between $100 and $170 the capacities of which are between 1kWh and 2kWh. Consequently, the price per kWh is respectively 100$ and $85. These different prices per kWh make the re-use solution a good candidate for rural electrification at a very affordable price, even if the lifespan of the re-used batteries is expected to be lower than those of new solar batteries. As a comparison, (Ambrose et al., 2014) points out that the energy price with second-life electric vehicles would vary between $18 and $140 as strong variability in the costs of repurposing is expected.
An uninterruptible power supply (UPS) unit, previously used to supply a PC can be readily modified to replace the inverter of the conventional solution. Since the power of individual UPSs and PSUs will certainly be limited to a few hundred watts, the association of multiple units could be further investigated to increase system power. This local solution should not only reduce the environmental impact, but could also be viewed at the same time as simple and favourable for local production or business and ensure sufficient production. The technological challenges facing second-life application of the system components by other discarded devices with little or no modification process have been addressed and tested in previous works. The second life of a classical three phase induction machine was presented in (Kim et al., 2016) while the other part of the system built with other re-used equipment in Fig.1. is detailed in (Chrin et al., 2016).
2. LCA METHODOLOGY FRAMEWORK FOR IMPACT ASSESSMENT
There are many different procedures and methods to assess the environmental issues or impacts such as Environmental Impact Assessment, Material Flow Analysis, Material Intensity per Unit Service, Risk Assessment (RA) and Life Cycle Assessment (LCA). LCA is viewed as a standardized, mature, systems-oriented analytical tool assessing potential impacts of products or services using a life cycle perspective. The ISO 14040 and 14044 standards provide general guidance to perform LCA. These reasons motivated the choice of LCA as a systemic environmental assessment method in this study.
LCA involves the definition of goal and scope, inventory analysis, impact assessment and
interpretation. The inventory step was performed for each stage of the product life cycle using the EcoInvent database (Swiss Centre for Life Cycle Inventories, 2009) and additional information available in the dedicated literature. The environmental impacts were evaluated in the third stage: for each stage in the life cycle inventory (LCI), the IMPACT 2002+ approach was selected as the impact assessment method. IMPACT 2002+ (IMPact Assessment of Chemical Toxics) proposes a feasible implementation of a combined midpoint/damage approach, linking all types of life cycle inventory results via 14 midpoint categories to four damage categories (Jolliet et al., 2003). The Life Cycle Assessment software package SimaPro 7.3 (PRé Sustainability, 2013) is used to carry out the inventory and subsequently apply the life cycle impact methodologies.
2.1. Functional unit
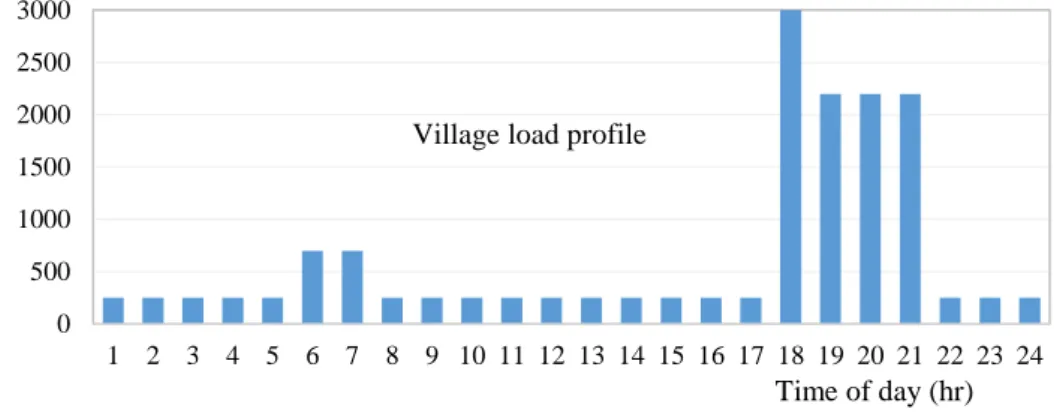
The aim of this study is to perform a comparative life cycle assessment of a PV system based on newly made parts and one based on used components as presented in Fig. 3 and Fig. 4. Since the original objective of this frugal innovation is the electrification of remote villages in Southeast Asian countries, the functional unit is defined to satisfy the daily energy needs of a rural village over a period of 20 years. The load profile of a typical small village in Thailand (Nipon Ketjoy, 2005) was chosen for this case study (Fig. 5); the energy needs are very similar in other countries as it can be seen in
(Nayak and Nayak, 2016) for a village in Rajasthan. The typical electrical devices found in village households include fluorescent lamps, a television, a tape player, a refrigerator and an electric fan.
Fig. 5: Load profile of a single village in Chiangria, Thailand, (Nipon Ketjoy, 2005), (Nayak and Nayak, 2016) This graph illustrates hourly load consumption on a typical day in a rural village in Thailand.
2.2. System
boundaries
The definition of the system boundaries is of crucial importance as it defines the stages and processes included in the LCA study. In the conventional solution, each component was manufactured for single use in the renewable energy production system (Fig. 6-a). For this reason, each phase of the lifecycle of the system components, including production, transportation, use and disposal, is taken into account.
Fig. 6: System boundary of life cycle assessment.
(a) For newly made components from both conventional and reuse solutions, each stage of their lifecycle is taken into account; (b) For second use components (reuse solution), only reuse stages which include transportation
and refurbishing are assessed
In the reuse scenario, components can be divided into two categories: newly made and used. PV modules and the Arduino controller are purchased as brand new and do not come from any recycling process or second-hand market. The impact of each lifecycle phase is taken into consideration. The used items are repurposed PSUs, repurposed UPSs and car batteries (Fig. 6-b). They are collected in the neighbourhood and transported to their new location for testing and repurposing where the system is intended to be installed. The inventories related to the second-life application of components are included in the system boundary whereas the impacts of their production, original usage, and end-of-life stages are excluded since they had already been produced for their first end-of-life.
2.3. Sizing of the two solutions
0 500 1000 1500 2000 2500 3000 1 2 3 4 5 6 7 8 9 10 11 12 13 14 15 16 17 18 19 20 21 22 23 24 P ow er c on su m pt ion ( W ) Time of day (hr) Village load profile
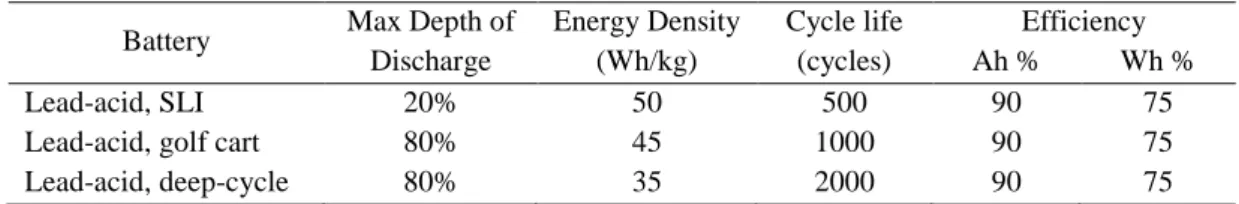
The sizing of PV system components was carried out based on the load profile with the considered functional unit. Polycrystalline PV modules with 15% efficiency were chosen due to their availability and low cost. The inverter is sized for the peak power of the village load profile. The battery capacity was chosen to provide enough storage to undergo the load through the night until sunrise. Furthermore, the batteries were sized for 2 days of storage in order to take into account the periods when little or no sunlight is available, thus providing reasonable assurance regarding the reliability of the system. The characteristics of different types of lead-acid batteries are listed in Table 1.
Table 1: Characteristics of lead-acid batteries (Masters, 2004)
Battery Max Depth of Discharge Energy Density (Wh/kg) Cycle life (cycles) Efficiency Ah % Wh % Lead-acid, SLI 20% 50 500 90 75
Lead-acid, golf cart 80% 45 1000 90 75 Lead-acid, deep-cycle 80% 35 2000 90 75
The PV module is usually rated using its peak power under standard test conditions (STC). The rated daily energy of PV panels is expressed by Eq.1 where Ebat is the energy needed to charge the battery.
The conversion efficiency accounts for charge controller efficiency, dirt on the PV surface, mismatched modules and temperature variations. Module mismatch and dirt factors can easily cause the array output to drop by a few percent. Using a conservative ambient temperature value of 35°C and the hours of sunshine in the worst month in Cambodia, the loss due to temperature can be found. The final conversion efficiency of the PV module is determined by addressing losses due to PV module temperature, charge controller efficiency, module mismatch and dirt, as follows:
𝐸𝐸𝑃𝑃𝑃𝑃,𝑆𝑆𝑆𝑆𝑆𝑆 = 𝑆𝑆𝐶𝐶𝐶𝐶𝐶𝐶𝐶𝐶𝐶𝐶𝐶𝐶𝐶𝐶𝐶𝐶𝐶𝐶 𝐸𝐸𝐸𝐸𝐸𝐸𝐶𝐶𝐸𝐸𝐶𝐶𝐶𝐶𝐶𝐶𝐸𝐸𝐸𝐸𝐸𝐸𝑏𝑏𝑏𝑏𝑏𝑏 (1)
In the conventional solution, the efficiency of both inverter and charge controller is assumed to be 90%. The efficiency of the modified power supply unit and modified UPS in the reuse case are assumed to be 10% less due to ageing and inappropriate use. The SLI battery is optimized to produce the high short-duration currents required to start an internal combustion engine and is not intended for a deep-cycle application. The parameters of the used SLI batteries are also in Table 1. Their efficiencies are assumed to be 5% lower than the typical value. The power density of the PSUs based on the collected samples is about 500W/Kg and about 120W/Kg for UPSs (excluding the mass of the battery). The parameter assumptions and component sizing are listed in Tables 2 and 3.
Table 2: Parameters of system components
Parameters Efficiency MDOD* Life cycle Conventional
system
Inverter 90%
Charge controller 90 %
Lead-acid Battery 24 V 75 % 80% 2000 cycles Solar panel Polycrystalline 15 %
Reuse system
PSUs, UPSs 80 %
Car battery 24 V 70 % 20 % 500 cycles Solar panel Polycrystalline 15 %
Table 3: Component sizing of the conventional and reuse systems Size Mass Conventional system Inverter 3333 W 24.67 Kg Charge controller 7326 W 24.67 Kg Solar panel 48.84 m2 586 Kg Battery 1794 Ah 1230 Kg (35 Wh/Kg) Reuse system PSUs 9936 W 19.87 Kg UPSs 3750 W 31.25 Kg Solar panel 66.24 m2 795 Kg Car Battery 8073 Ah 3875 Kg Arduino board 100x50 mm2 PCB 45g (5g microprocessor)
As expected, the component sizing in the reuse solution may be over-dimensioned compared to the conventional system due to the derating of component efficiency and technological differences. The most significant increase is observed in the battery capacity as a result of the technological difference between solar and SLI batteries.
2.4. Transportation and replacements
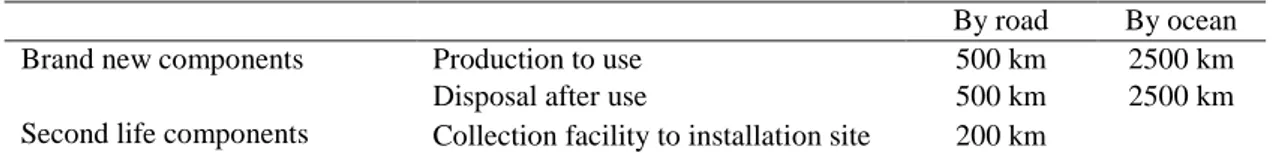
The minor changes which need to be made between the PSU and UPS structures involve removing some components and welding some pieces by adding a few components. The used car batteries need to be tested to determine their state when selecting the ones that are still in good condition. Although these processes require energy and some additional components, this is presumed to be significant less than to produce a new power supply unit or new batteries. In this case, only the impact of transportation from the waste collection facility to the installation site is taken into account. When no precise information is available, manufacturing and recycling are assumed to have been done in China which is usually the case for South-Asian countries, to estimate the impact of transportation. (Ma et al., 2018) explains that China is the biggest car battery producer which makes this assumption feasible. An average distance of 200km by truck is assumed to transport the components from the collection facility in the city to the installation site in the countryside. Distances and transportation modes are given in Table 4.
Table 4: Transportation mode and distance
By road By ocean Brand new components Production to use 500 km 2500 km Disposal after use 500 km 2500 km Second life components Collection facility to installation site 200 km
PV modules are the most reliable components (International Energy Agency, 2002). They have an expected lifetime of over 20 years which is chosen as the total time span for this comparative LCA. Other components for which lifetimes are shorter need to be replaced several times along the system lifespan. Brand new inverter and charge controller are assumed to be replaced every 7 years. A lifetime of 5 years is assumed for the second life of UPSs and PSUs. The battery lifetimes are determined by their number of charge/discharge cycles (see Table 5).
Table 5: Component service time and replacement
Life cycles Lifetime (years) Number of replacement Conventional
system
Solar panel - 20 1
Solar Battery 2000 cycles 5.48 3.65 Inverter/ Charge controller - 7 2.86
Reuse system
Solar panel - 20 1
Car Battery 500 cycles 1.37 14.6
PSUs/UPSs - 5 4
Microcontroller (Arduino) 10 2
2.5. Life cycle inventories
Most of the inventory data are taken from the EcoInvent database (Table 6). Since the database for inverters is only available in a few power ratings, data extrapolation has been applied to evaluate the impacts of the actual reuse power electronics. Detailed data for charge controllers have not been found in literature. However, there are articles which used the same embodied energy for inverter as well as for charge controller. (Rydh and Sanden, 2005) and (Alsema, E. 2000) used values of 1 MJ/W for both components, estimated over the size of the electronic devices, not over the size of the facility. For this reason, the environmental impact of both elements is also assumed to be identical as per power unit.
Table 6: EcoInvent database in SIMAPRO EcoInvent 2.2 database Inverter, charge controller Inverter, 2500W, at plant/RER
PV panels Photovoltaic panel, multi-Si, at plant/RER
Arduino controller Printed wiring board, surface mounted, solder mix, at plant/GLO Integrated circuit, IC, logic type, at plant/GLO
Transportation Truck 16t (road)
Transport, barge/RER (ocean)
RER shortcut represents Europe, GLO stands for global and represents activities which are considered to be an average valid for all countries in the world
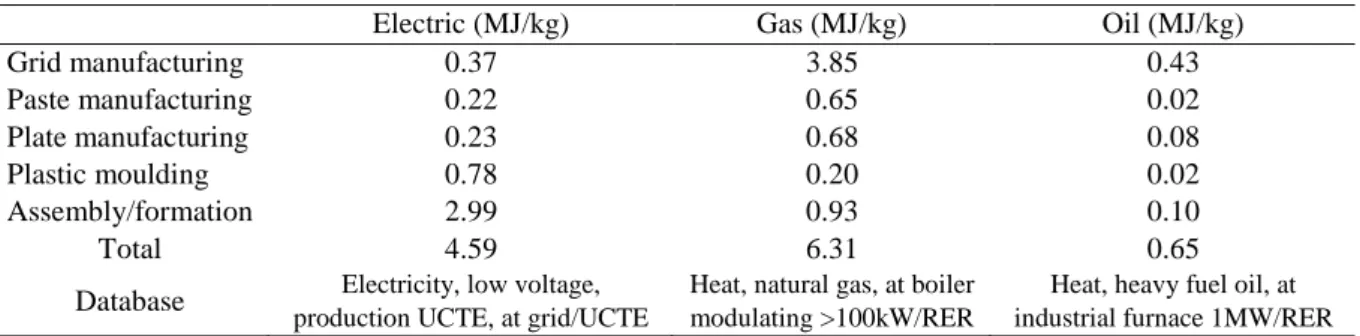
The life cycle inventory data for storage lead-acid batteries were collected from various literature sources for their material production stages and assembly process. The material composition of several lead-acid batteries is given in Table 7. The average percentages of the composition and the Ecoinvent data used to model it is given in Table 8. Some materials have not yet been included due to their very small quantity and their low impact factor (microcontroller for example). The EcoInvent database provides the necessary inventory data for the extraction and production stages of each material. The amount of energy required for the assembly processes of the battery, which includes grid manufacturing, paste and plate manufacturing, plastic mouldings and final assembly, is based on (Spanos et al., 2015) (Table 9).
Table 7: Material composition (by percentage of mass) of lead-acid batteries from various sources.
(1) (2) (3) (4) (5) Lead 71 64.5 60.7 66.2 61.2 Sulphuric acid 6.3 10.5 10.3 20(4) 9.6 Water (unsalted) 10.8 17 16.9 - 13.3 Polypropylene (case) 7.5 7 6.7 7.5 8.2 Fibreglass mat separator - 3 0.02 4.9 - Tin 0.4 - - - -
(1): Exide's Absolytes GX model; (Spanos et al., 2015)
(2) average of industrial and EV batteries; (Sullivan and Gaines, 2012) (3) Tubular lead-acid; (4) Acid + water; (Rantik, 1999)
Table 8: Material composition of lead-acid battery by average percentage of mass. Material composition Percentage of battery mass Database Lead 65.3 Lead, primary, at plant/GLO Sulphuric acid 9.2 Sulphuric acid, liquid, at plant/RER Water (unsalted) 14.86 Water, deionised, at plant/CH
Polypropylene (case) 7.15 Polypropylene, granulate, at plant/RER Fibreglass mat separator 2.3 Glass fibre, at plant/RER
Tin 0.4 Tin, at regional storage/RER CH = Switzerland.
Lead-acid batteries are usually recycled after their useful life time. More than 90% of lead and lead oxide are assumed to be recycled (Gaines and Singh, 1995). Primary lead is produced directly from mined lead ore. Secondary lead is produced from scrap lead products which have already been recycled. According to (Sullivan and Gaines, 2012), a typical new battery contains between 60% and 80% secondary lead and plastic. A 100% value was assumed for both collection and recycled rates for the recovered lead-acid batteries. A ratio of 20/80 for primary/secondary lead is used for lead production. The recycling process of the battery is based on the ‘secondary lead’ datasets in the EcoInvent database.
Table 9: Energy requirement in battery manufacturing process
Electric (MJ/kg) Gas (MJ/kg) Oil (MJ/kg)
Grid manufacturing 0.37 3.85 0.43 Paste manufacturing 0.22 0.65 0.02 Plate manufacturing 0.23 0.68 0.08 Plastic moulding 0.78 0.20 0.02 Assembly/formation 2.99 0.93 0.10 Total 4.59 6.31 0.65
Database Electricity, low voltage, production UCTE, at grid/UCTE
Heat, natural gas, at boiler modulating >100kW/RER
Heat, heavy fuel oil, at industrial furnace 1MW/RER
3. IMPACT ASSESSMENT RESULTS FOR BOTH SYSTEMS
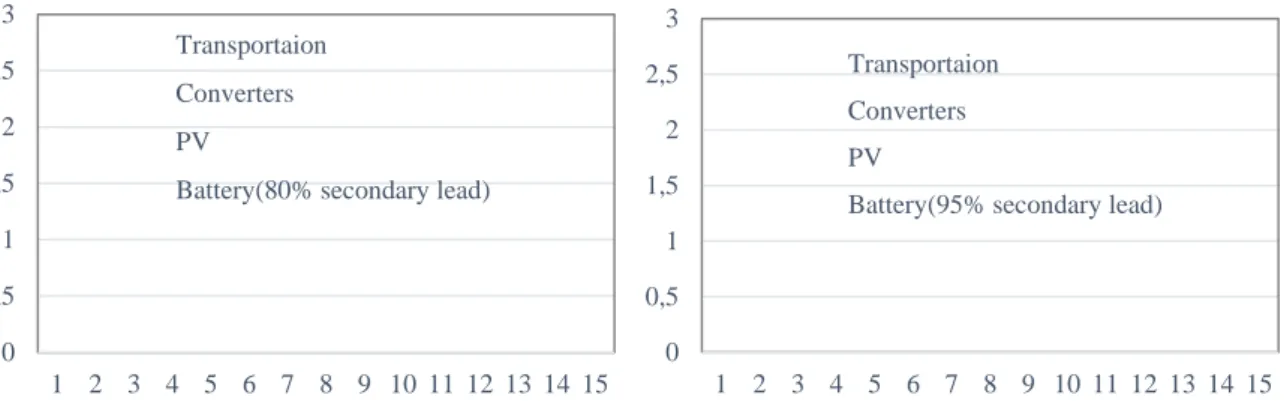
As aforementioned, the IMPACT 2002+ method involving a combined midpoint/damage approach was adopted for the analysis of the environmental impact. The assessment that was performed with the “endpoint” methods can be easily interpreted, but may be inaccurate. The “midpoint” methods lead to more accurate results (Welz et al., 2011) IMPACT 2002+ reports characterization factors for 15 midpoint categories (Jolliet et al., 2003). This impact category assessment was carried out with normalized values to illustrate the relative impacts between different scenarios. The normalization is performed by dividing the impact by the respective normalization factors which are detailed in (Humbert et al., 2012) for Western Europe.
Fig. 7: Normalized impacts in different midpoint categories for conventional solution, at 80 % and 95 % secondary lead in batteries
(1: Carcinogens, 2: Non-carcinogens, 3: Respiratory inorganics, 4: Ionizing radiation, 5: Ozone layer depletion, 6: Respiratory organics, 7: Aquatic ecotoxicity, 8: Terrestrial ecotoxicity, 9: Terrestrial acidification /nutrification, 10: Land occupation, 11: Aquatic acidification, 12: Aquatic eutrophication, 13: Global warming, 14: Non-renewable energy, 15: Mineral extraction)
3.1. Impact assessment result for the classical solution with new components
In the conventional scenario, the impact assessment was evaluated for two different rates of lead recycling for lead-acid batteries in order to illustrate the recycling effect on life cycle impacts (Fig. 7) since batteries contribute to the most significant burden in both cases. Not surprisingly, the impacts are slightly better with the 95% recycling rate which is closer to reality than with the 80% scenario, due to the maturity of the closed loop supply chain of lead acid batteries. It is important to notice that recycling processes are almost inexistent in developing countries on a large scale. As a consequence, batteries are often discarded “on site”, which pollutes.
The effect of the converters is relatively insignificant (7-8%). While PV modules share some portion of the impact (24-29%), batteries clearly contribute the most to the overall life cycle impact of the system (47-55% of total impact), due to the large quantity of chemicals they contain.
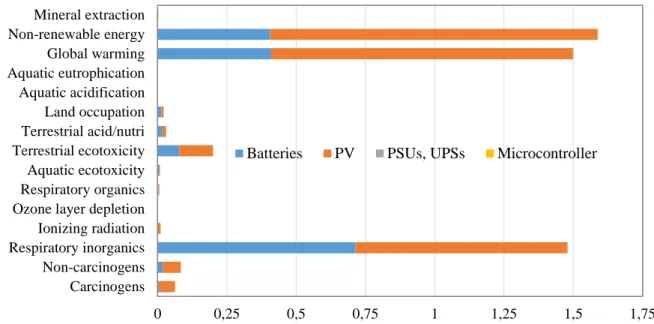
3.2. Impact assessment for the reuse solution
The assessment result for the reuse scenario is illustrated in Fig. 8. Once again, the impact associated to PSUs/UPSs and a microcontroller kit remains very small (0.12%), however the PV modules contribute the most (66%). Nevertheless, the impact of reusing lead-acid batteries is still significant due to a number of factors (33%), notably their weight, reduced efficiency and the need for frequent replacement. While the inventories of battery reuse only include transportation, due to the short service life of batteries, they need to be replaced almost every year, thus contributing significantly to the environmental damage.
0 0,5 1 1,5 2 2,5 3 1 2 3 4 5 6 7 8 9 10 11 12 13 14 15 Transportaion Converters PV
Battery(80% secondary lead)
0 0,5 1 1,5 2 2,5 3 1 2 3 4 5 6 7 8 9 10 11 12 13 14 15 Transportaion Converters PV
Fig. 8: Normalized impacts in different midpoint categories for the reuse solution
The comparison of the environmental impacts of both cases (new and reused solutions) presented in Fig. 9 shows a 40% reduction in environmental damage obtained by the reuse solution. It could be due to the absence of battery production in the case of reuse. As illustrated in Figure 7, batteries contributed the most to the overall environmental damage for the conventional solution. In the reuse case, this damage is significantly reduced but remains the highest. As expected, the microcontroller has no impact.
The reuse of PSU and UPS units from PCs as power converters also contributes to this gain but only marginally compared to the lead-acid battery. Of course, the environmental impact of the PV panels will be difficult to reduce as they are produced specifically for the targeted application (electrification) and they cannot be repurposed or reused like the other elements.
Fig. 9: Normalized impact comparison of the conventional (Conv.) and the reuse solutions
0 0,25 0,5 0,75 1 1,25 1,5 1,75
Carcinogens Non-carcinogens Respiratory inorganics Ionizing radiation Ozone layer depletion Respiratory organics Aquatic ecotoxicity Terrestrial ecotoxicity Terrestrial acid/nutri Land occupation Aquatic acidification Aquatic eutrophication Global warming Non-renewable energy Mineral extraction
Batteries PV PSUs, UPSs Microcontroller
0 0,5 1 1,5 2 2,5 3
Carcinogens Non-carcinogens Respiratory inorganics Ionizing radiation Ozone layer depletion Respiratory organics Aquatic ecotoxicity Terrestrial ecotoxicity Terrestrial acid/nutri Land occupation Aquatic acidification Aquatic eutrophication Global warming Non-renewable energy Mineral extraction
4. SENSITIVITY ANALYSIS OF IMPACT ASSESSMENT
4.1. Sensitivity analysis
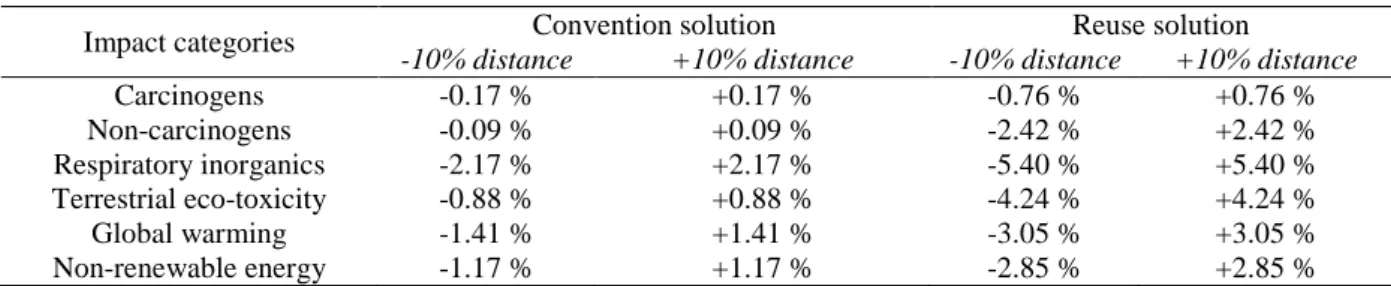
The positive results for reuse are partly based on certain assumptions, interpolations or extrapolations due to the lack of data in the databases or in related literature. They could still be mitigated in an actual situation due to ageing or to the differences in component characteristics. To test the reliability of the results, a sensitivity analysis was performed by varying the assumed parameters and observing the associated effects on the results. Some parameters which have a relatively low contribution to the results were not considered e.g. microcontroller. While keeping conventional system parameters as references, those selected for the sensitivity analysis on reuse include the efficiency of repurposed PSUs and repurposed UPSs (reuse solution), the efficiency of acid batteries (reuse solution), lead-acid battery lifetime (reuse solution), and distance of transportation. The changing of these parameters leads to a 10% variation around the initial value; the overall impact of the reuse solution is illustrated in Tables 10 and 11. Only the most significant results were assessed in term of normalised values.
Table 10: Parameter influence on the environmental impact in the reuse system
Impact categories PSUs/UPSs efficiency Battery efficiency Battery life time
-10% +10% -10% +10% -10% +10% Carcinogens +29.52 % -20.33 % + 15.57 % -11.68 % + 0.72 % -0.59 % Non-carcinogens +26.90 % -18.73 % + 12.93 % -9.70 % + 2.45 % -2.00 % Respiratory inorganics +22.69 % -16.2 % + 8.6 % -6.45 % + 5.36 % -4.38 % Terrestrial ecotoxicity +24.15 % -17.08 % + 10.11 % -7.58 % + 4.33 % -3.55 % Global warming +26.12 % -18.27 % + 12.09 % -9.07 % + 3.03 % -2.48 % Non-renewable energy +26.40 % -18.44 % + 12.38 % -9.29 % + 2.84 % -2.32 %
Table 11: Influence of transportation distance changes on the environmental impact for both solutions Impact categories Convention solution Reuse solution
-10% distance +10% distance -10% distance +10% distance
Carcinogens -0.17 % +0.17 % -0.76 % +0.76 % Non-carcinogens -0.09 % +0.09 % -2.42 % +2.42 % Respiratory inorganics -2.17 % +2.17 % -5.40 % +5.40 % Terrestrial eco-toxicity -0.88 % +0.88 % -4.24 % +4.24 % Global warming -1.41 % +1.41 % -3.05 % +3.05 % Non-renewable energy -1.17 % +1.17 % -2.85 % +2.85 %
PSUs/UPSs efficiency has a marked effect whatever the impact category; a range of [-10;+10]% variation leads to a maximum range of [-18.7;2.9]% of the environmental impact. The effect is twice that of battery efficiency, and around 8 times higher than the effect of battery lifetime.
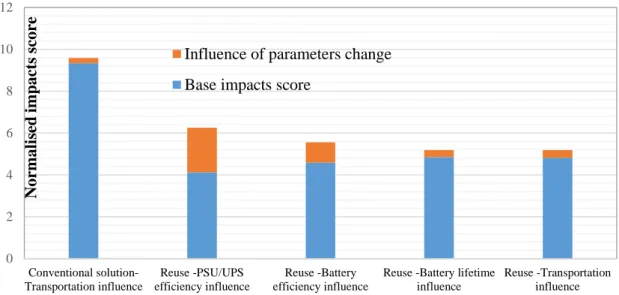
The distances used for calculating the effect of transportation are based on estimated values assuming that all new components are manufactured in China and the systems are installed in Cambodia. The influence of the corresponding parameters is not very significant when compared to the observed impact. Yet, unsurprisingly, a more marked influence is observed in the reuse scenario as transportation directly determines the impacts associated with second-life components. The influence of the parameters on the overall normalized environmental impacts is illustrated in Fig. 10. The efficiencies of the power converter and the batteries are the most sensitive parameters and this demonstrates that the assumptions have a significant influence on the results. Nevertheless, this sensitivity analysis confirms that the conclusions remain unchanged, i.e., the reuse solution is better for the environment.
Fig. 10: Comparison of influence of parameters (by -10% to +10% changes) to the impact results. This graph illustrates the influence of different parameters on the impact results in reuse or conventional systems. The blue bar represents the lowest impact score (when a parameter is decreased or increased by 10%). The orange bar represents the impact between decreasing a parameter by 10% and increasing it by 10%
4.2. Discussion of results
While the influence of transportation and the batteries’ life-cycle has little impact on the results, these parameters could vary widely depending on multiple factors. For instance, the distance of transportation can dramatically (> 10%) change according to the country and location of the production plant. However, since this affects both cases in the same way, its global influence is not significant. This result was also confirmed by (Rantik, 1999) which presents a comprehensive study of 5 battery technologies for electric vehicles but not for energy storage in small islanded systems for villages.
Battery lifetime could also greatly affect the result as batteries have a significant impact percentage. Depending on the initial state-of-health, the technology and usage conditions, battery lifetime can vary widely. The operating temperature can also reduce its useful lifetime. Fortunately, most of the developing countries (except in mountainous regions) do not face large temperature variations such as in Europe or North America. Although battery capacity increases at high temperature, its lifespan can be estimated to be shortened by 50% for every 10˚C above the optimum 25˚C operating temperature (Masters, 2004). This shortened life time effect increases the impact in both cases, but most significantly those of the conventional solution which involves the production of new batteries. As stated in (Dutt, 2013) battery life under photovoltaic current profile will be considerably higher than when tested with a current wind profile. This may be due to the higher current variations in the wind. For automotive batteries, wet lead-acid batteries rather than VRLA batteries are commonly used because of their ability to deliver high current intensity for starting. Absorbed glass mat (AGM) VRLA batteries can provide a high current but at a considerably higher cost. Despite its cost, this type of battery is more tolerant to deep discharge, thus providing more life cycles compared to the classic flooded lead-acid batteries. The increase in SLI battery lifespan as a result of the change in technology helps to further decrease the effect of the reuse scenario. In the present cases, our results are still justified, and are, in fact, more conservative. However, this could change if the technology of storage batteries significantly improves while that of SLI batteries remains constant over time. For example, by doubling the lifespan of the battery in the conventional solution, the impact results of both scenarios became very similar. Although this situation is unlikely, the result remains slightly positive for our original reuse solution.
0 2 4 6 8 10 12 Conventional solution-Transportation influence Reuse -PSU/UPS efficiency influence Reuse -Battery efficiency influence
Reuse -Battery lifetime influence Reuse -Transportation influence N o rm a li sed i m p a ct s sco re
Influence of parameters change Base impacts score
CONCLUSION
An innovative solution for rural electrification in developing countries based on reusing waste components in a solar PV system has been presented in this paper with a specific focus on the application of reuse from an engineering viewpoint. The objective of this work was to quantify the reduction of the environment impact, in particular climate change, involved in this innovation, which tackles the “bottom of the pyramid”. Remote villages in Southeast Asian countries have been used to illustrate this. Life Cycle Assessment (LCA) has been used to evaluate the environmental impact of the reuse solution compared to a more conventional system.
In the reuse scenario, the impact associated to PSUs/UPSs and the microcontroller kit remains very low (0.12% of impact percentage), while PV modules contribute significantly (66%). Nevertheless, the impact of reusing lead-acid batteries is still significant due to their weight, reduced efficiency and the need for frequent replacement. A 40% reduction of the environmental burden obtained by the reuse solution is clearly due to the absence of battery production in the case of reuse. The reliability of this result, which is based on some assumptions due to the lack of precise case studies, has been further verified with a global sensitivity analysis of several critical variables: component efficiency, lifetime and transportation on the environment. The efficiency of repurposed PSUs and repurposed UPSs is the most significant parameter on the environmental impact categories in the reuse solution.
The reuse strategy could now be applied to the hydro-component of the system thus widening the scope of the proposed solution. Amongst other challenges, such a solution still requires the cooperation of all the different stakeholders in the product lifecycle as well as a proactive improvement from product designers (Atlason et al., 2017). The factors that could drive such a solution would include not only the technological and environmental aspects, but also the economic ones. Economic considerations that still need to be addressed are probably the main decisive force required to implement such a reuse-based system.
REFERENCES
International Energy Agency (IEA), 2011. Energy for all, Financing access for the poor. In. World energy outlook.
International Energy Agency (IEA), 2017. Energy Access Outlook 2017, URL http://www.iea.org/access2017/
Henriques, J. and Louis, G.; 2010. Comparative Life Cycle Costing of electric grid extension and photovoltaic micro-generation for rural electrification: Case Study in Namawanga, Kenya. 31st Annual Conference of the American Society for Engineering Management. Lean and Green: Building a Sustainable Future Through Engineering Management
Blenkinsopp, T.; Coles, S.R; Kirwan, K.; 2013. Renewable energy for rural communities in Maharashtra. In. India. Energy Policy, Volume 60, pp 192-199.
Liu, Z.; Tang, J.; Li, B.; Wang, Z. 2017. Trade-off between remanufacturing and recycling of WEEE and the environmental implication under the Chinese Fund Policy. J. Clean. Prod., 167, pp 97–109. Baldé, C.P., Wang, F., Kuehr, R., Huisman, J. 2015. The global e-waste monitor – 2014. United
Nations University, IAS – SCYCLE, Bonn, Germany. URL
http://i.unu.edu/media/unu.edu/news/52624/UNU-1stGlobal-E-Waste-Monitor-2014-small.pdf
Parajuly, K., Habib, K., Cimpan, C., Liu, G., Wenzel, H., 2016. End-of-life resource recovery from emerging electronic products -a case study of robotic vacuum cleaners. In. J. Clean. Prod. 137, pp 652-666.
Parajuly, K., and Wenzel, H., 2017. Potential for circular economy in household WEEE management. In. J. Clean. Prod. 151, 272-285.
The Least Developed Countries Report 2017, Transformational energy access. United Nations Conference on Trade and Development, United Nations Publication (UNCTAD/LDC/2017). URL http://unctad.org/en/PublicationsLibrary/ldcr2017_en.pdf
Intended Nationally Determined Contribution (INDCs), as communicated by Parties for the COP21. URL http://www4.unfccc.int/submissions/indc/Submission%20Pages/submissions.aspx
Lu, B.; Yang, J.; Ijomah, W.; Wu, W.; Zlamparet, G. 2017. Perspectives on reuse of WEEE in China: Lessons from the EU. In. Resour. Conserv. Recycl.
Klausner, M.; Grimm, W. M. and Hendrickson, C. 1998. Reuse of Electric Motors in Consumer Products. In. Journal of Industrial Ecology, 2: 89–102.
Zink, T.; Maker, F.; Geyer, R. et al. 2014. Comparative life cycle assessment of smartphone reuse: repurposing vs. refurbishment. In. Int. J. Life Cycle Assess 19: 1099.
Schofield, D.M.K.; Abuzed, S.; Foster, M.P.; Stone, D.A.; Rogers, D.J. Green, J.E. 2013. Second life of computer power supplies in PV battery charging applications. In. 15th European Conference on Power Electronics and Applications (EPE).
Rogers, D.; Green, J.; Foster, M.; Stone, D.; Schofield, D.; Abuzed, S.; Buckley, A. 2013. Repurposing of ATX computer power supplies for PV applications in developing countries. In. International Conference on Renewable Energy Research and Applications (ICRERA).
Rogers, D.; Green, J.E.; Foster, M.P.; Stone, D.A.; Schofield, D.; Buckley, A.; Abuzed, S. 2014. ATX power supply derived MPPT converter for cell phone charging applications in the developing world. In. 7th IET International Conference on Power Electronics, Machines and Drives.
Ambrose, H.; Gershenson, D.; Gershenson, A. and Kammen, D. 2014. Driving rural energy access: a second-life application for electric-vehicle batteries. In. Environmental Research Letters, 9.
Kim, B.; Pietrzak-David, M.; Dagues, D.; Maussion, P.; Azzaro-Pantel, P. and Bun, L.; 2016. Second life of power supply unit as charge controller in PV system and environmental benefit assessment. 42nd Annual Conference of the IEEE Industrial Electronics Society, pp. 1967-1972.
Chrin, P.; Pietrzak-David, M. and Maussion, P. 2016. Renewable electricity production with some wasted second-life components. In. 25th IEEE International Symposium on Industrial Electronics, pp. 574-579.
Swiss Centre for Life Cycle Inventories, 2009. Database ecoinvent v2.2. Ecoinvent Centre. URL http://www.ecoinvent.org/database/
Jolliet, O.; Margni, M.; Charles, R. and Humbert, S. 2003. IMPACT 2002+: a new life cycle impact assessment methodology. In. Int. J. LCA, vol. 6, pp.324-330.
PRé Sustainability, Netherlands 2013. SimaPro 7.3. URL https://www.pre-sustainability.com/
Nipon Ketjoy, 2005. Photovoltaic Hybrid Systems for Rural Electrification in the Mekong Countries.
Dr.-Ing
Thesis,University of Kassel
.Nayak, C.K. and Nayak, M.R. 2016. Optimal size and cost analysis of standalone PV system with battery energy storage using IHSA. International Conference on Signal Processing, Communication, Power and Embedded System (SCOPES)
Masters, G.M. 2004. In. Renewable and Efficient Electric Power Systems. John Wiley & Sons, Inc.,. Ma, J.; Stringer, D.; Zhang, Y. and Kim, S. 2018. The Breakneck Rise of China’s Colossus of Electric-Car Batteries, In. Bloomberg Business, Bloomerg NEF.
International Energy Agency, 2002. Reliability Study of Grid Connected PV Systems: Field Experience and Recommended Design Practice. In. Report IEA-PVPS T7-08: 2002.
Rydh, C. and Sanden, B. 2005. Energy analysis of batteries in photovoltaic systems. Part I: performance and energy requirements. Energy Conversion and Management 46 (11–12).
Alsema, E. 2000. Energy pay-back time and CO2 emissions of PV systems. In. Progress in Photovoltaics: Research and Applications 8 (1), 17–25.
Spanos, C.; Turney, D. E.; Fthenakis, V. 2015. Life-cycle analysis of flow-assisted nickel zinc-, manganese dioxide and valve-regulated lead-acid batteries designed for demand-charge reduction. In. Renewable and Sustainable Energy Reviews, Volume 43, pp 478-494.
Sullivan, J.L.; Gaines, L. 2012. Status of life cycle inventories for batteries. In. Energy Conversion and Management, Volume 58.
Rantik, M. 1999. Life cycle assessment of five batteries for electric vehicles under different charging regimes. In. KFB-Meddelande 1999:28–Kommunikationsforsknings–beredningen, Stockholm.
Stavros E. Daniel, Costas P. Pappis, Theodore G. Voutsinas. 2003. Applying life cycle inventory to reverse supply chains: a case study of lead recovery from batteries. In. Resources, Conservation and Recycling, Volume 37, Issue 4, pp 251-281.
Rydh, C. J. 1999. Environmental assessment of vanadium redox and lead-acid batteries for stationary energy storage. In. Journal of Power Sources, Volume 80, Issues 1–2, pp 21-29.
Gaines, L.; Singh, M. 1995. Energy and environmental impacts of electric vehicle battery production and recycling. In. Total life cycle conference and exposition. Vienna, Austria: SAE.
Welz, T.; Hischier, R.; Hilty, L. M. 2011. Environmental impacts of lighting technologies - Life cycle assessment and sensitivity analysis. In. Environ Impact Assess Rev; 31: pp 334–343.
Humbert, S.; De Schryver, A.; Bengoa, X.; Margni, M.; Jolliet, O. 2012. IMPACT 2002+: User Guide, draft for version Q2.21; Quantis, Switzerland.
Dutt, D. 2013. Life Cycle Analysis and Recycling Techniques of Batteries used in Renewable Energy Applications. In. International Conference on New Concepts in Smart Cities: Fostering Public and Private Alliances (SmartMILE), pp 1-7.
Atlason, R.S.; Giacalone, D.; Parajuly, K. 2017. Product design in the circular economy: Users' perception of end-of-life scenarios for electrical and electronic appliances. In. J. Clean. Prod. 168, pp 1059-1069.