To cite this version : Maussion, Pascal and Picot, Antoine and
Chabert, Marie and Malec, David Lifespan and Aging Modeling
Methods for Insulation Systems in Electrical Machines: a Survey.
(2015) In: , IEEE, 2nd IEEE Workshop on Electrical Machines Design,
Control and Diagnostics, Turin, March 2015, WEMDCD’15, 26 March
2015 - 27 March 2015 (Turin, Italy)
To link to this article : doi:
10.1109/WEMDCD.2015.7194541
URL :
http://dx.doi.org/10.1109/WEMDCD.2015.7194541
O
pen
A
rchive
T
OULOUSE
A
rchive
O
uverte (
OATAO
)
OATAO is an open access repository that collects the work of Toulouse researchers and
makes it freely available over the web where possible.
This is an author-deposited version published in :
http://oatao.univ-toulouse.fr/
Eprints ID : 14326
Any correspondance concerning this service should be sent to the repository
administrator:
[email protected]
Abstract-- This paper deals primarily with modeling lifespan and, to a lesser degree, aging in insulation systems of electrical machines. The different aging processes involved, including partial discharges, are described. Previous works, in conjunction with the current study, are described and lead to the conclusion that there is no single method, even with accelerated lifetime tests, able to provide lifetime models taking into account all the stress factors in a simple way. Consequently, the principles of different regression methods are described (design of experiments, response surface, multi-linear and robust regression) and applied with a limited number of experiments, thus reducing experimental cost. Several types of insulation material were tested in order to confidently recommend one in particular.
Index Terms-- AC machines, Aging, Accelerated Aging, Condition monitoring, Design of Experiments, Electric machines, Insulation testing, Lifetime estimation, Modelling, Pulse width modulated inverters.
I. NOMENCLATURE
Ei Effect of factor number i
Eij Effect of interaction between factor i and j yi Experimental value at experiment number i Fi Normalized level of factor i, could be +1, -1 or
any value between -1 and +1 M Average experimental value L Lifespan in minutes
T Temperature in °C
V Voltage in V
F Frequency in Hz
n
N Number of experiments Number of samples = number of repetitions II.INTRODUCTION
The monitoring of stator insulation is becoming more and more widespread both in high-voltage and low-voltage machines. It is particularly important as it helps to improve the reliability of systems. 1It can save time and money by
avoiding unplanned maintenance and extending lifespan. It
P.Maussion, A. Picot and D. Malec are with Université de Toulouse, LAPLACE (Laboratory for PLAsma and Conversion of Energy), Toulouse, F-31000, France, (e-mail: [email protected], [email protected], [email protected]).
M. Chabert is with Univerfsité de Toulouse, IRIT (Institut de Recherche en Informatique de Toulouse), Toulouse, F-31000, France, (e-mail: [email protected]).
improves safety for staff, public and equipment, by decreasing the risk of accidents or fire. Any number of stresses can cause the premature failure of a component in electrical machines: thermal, mechanical, electrical and environmental stresses and it is important to narrow down the most likely causes of failure. Few papers deal with condition monitoring of electrical machines such as [1] where an extensive review of motor failure is extracted from the literature. Notably, faults in low-voltage induction machines are mainly bearings faults. But the rising proportion of electric energy in embedded systems means an increase in the dc bus voltage. As a consequence, stator windings could be the place for partial discharges (PD), even in low-voltage machines and especially for random-wound stators.
PD off-line and on-line detection has been extensively described in [2] for low voltage machines and in [3] for high-voltage machines, particularly in the petrochemical industry. PD detection, with a pioneer work in [4], is currently being carried out thanks to high-frequency measurement and acquisition devices (up to Ghz) and wideband frequency response sensors. Nevertheless, the resulting damage evaluation and the corresponding remaining life expectancy remains an issue. Some PD aging or lifetime models will be presented in the following sections. For the past few years, the objectives of our work have been to provide useful guidelines for experimental insulation lifespan modeling with Accelerated Lifetime Tests (ALT), whatever the degradation phenomenon involved, with or without PD. Once a model is obtained, our final aim is to derive the actual lifetime for prognosis. This paper is organized as follows: Part III presents partial discharges, part IV provides a comprehensive presentation of Accelerated Lifetime Tests in electrical engineering and their use for PD characterization. Principles of different regression methods are recalled in part V. Part VI focuses on our test benches and part VII on our results through models and their validation tests.
III.PARTIAL DISCHARGES
The number of low voltage motors fed by inverters has greatly increased since the mid80’s when these inverters became both more efficient and cheaper. New stresses have emerged related to high dV/dt inverters (typically higher than 1kV/µs), such as surge voltages occurring either at the motor terminals or in the motor windings.
Lifespan and Aging Modeling Methods for
Insulation Systems in Electrical Machines:
a Survey
Fig . 1. Typical parameters influencing the electrical stress in a motor winding fed by an inverter
The over-voltage occurring at the motor terminals might be due to an impedance mismatch between the feeding cable and the windings to the rise in the high voltage rate of the inverter switches. This over-voltage can theoretically reach 2Ubus, i.e. more than 1kV when using a 540V DC bus. If the motor works in a regenerative brake mode, the DC bus voltage increases and the corresponding over-voltage at the motor terminals can be consequently higher than 2Ub.
An over-voltage also occurs within the windings themselves. As the voltage propagation is not instantaneous in the winding (speed is inversely proportional to the square root of the product LC where L and C are the linear inductance and capacitance of the winding), the voltage distribution in the windings is far from homogeneous. In other words, during the first 100ns or first µs (depending on the size of the stator) following the voltage application, the first turns are electrically energized but not the last ones.
Fig. 2. Typical PD between neighbouring turns in a PWM fed motor[2]
Consequently, over-voltages are induced in the winding, especially in the first turns of form-wound motors. In the case of a random-wound stator in which each turn could be placed randomly against any other turn of the coil, this over-voltage may take place between phase/phase and winding/ground insulations (enamel, varnish, ground insulation films, etc.). The electric stress at both motor terminals and within the windings depends on different factors which are summarized in Fig. 1. This problem is related to air, either in the embedded or open voids existing in the insulation system, which, when these over-voltages take place, can be exposed to voltages sufficiently high to initiate a PD activity (i.e. higher than the Paschen’s values
[5]). An example of a PD phenomenon occurring in the stator fed by a PWM (Pulse Width Modulation) inverter [4] and a resulting breakdown between turns are given in Fig. 2. The effects of these discharges are:
• delamination, erosion, etc. because of the ion-induced surface degradation,
• increase in the local temperature which may reach the melting point of the insulator,
• increase of the chemical degradation of the insulator by creating aggressive
substances
like nitric acid, ozone, etc.• transformation into a total discharge (arc) when the insulator is completely destroyed by the PD.
Unfortunately, classical Electrical Insulation Systems (EIS) of such low voltage motors (Polyether, Polyetherimide, Polyamide-imide, Polyimide, Polyethylene terephthalate, Epoxide, etc.) are not able to support such PD activity and their lifetime is significantly reduced. In the ‘more electrical aircrafts’, numerous motors will be supplied by PWM converters, it is therefore necessary to study the reliability of such motors, taking into account their extreme environmental working conditions. As a consequence, PD may be induced within the EIS in existing air gaps [6] or defects which appear with aging [7]:
• low pressure in non-pressurized areas which leads to low partial discharge inception voltages (PDIV), • thermal cycles able to create delamination in the EIS
which may initiate PD,
• humidity cycles able to modify the PD activity and bring pollution into the EIS.
For all these reasons, extensively listed in numerous papers, PD is an issue of great scientific and industrial importance, but very difficult to tackle. [8] pinpoints that the correct interpretation of PD tests can only be performed if periodic measurements are achieved. Several conditions must be fulfilled regarding the uniformity of test conditions such as temperature, humidity, load level, supply voltage, test instrument and measurement procedure. Any change between two results will certainly lead to misinterpretation. The following section presents off-line tests, where stress parameters are controlled in order to derive reliable conclusion.
IV.ACCELERATEDLIFETIMETESTS A. ALT principles and applications
Accelerated Lifetime Tests (ALTs) are commonly used in testing procedures, in product design and for evaluating the reliability of components, devices or systems. Units are tested at higher than usual levels of stress, such as temperature, voltage, current, pressure, frequency, etc. depending on the device under test. Stress levels must remain lower than maximum values in order to avoid irrelevant degradation mechanisms. ALTs accelerate the degradation phenomena, save time and money, especially when the expected lifespan of the components is in the range of years. The testing conditions should lead to the same degradation phenomena as during normal service and that the models obtained must fit to experimental data. Otherwise, some acceleration factors should be included in the aging models.
In recent literature, ALT for electronic engineering have been applied to the estimation of lifetime models for Lithium-ion battery cells or LiFePO4/C battery system for wind power applications to estimate the correlation of electrical and mechanical properties of LV nuclear power plant cables, to compare different power cycling strategies to test power devices. Accelerated aging procedures are described in [9] for assessing correlations between electrical and mechanical properties of LV power plant cables in the very specific domain of nuclear power. In that case, stress factors are the temperature and gamma radiation levels and degradations are evaluated through different lab tests such as dielectric spectroscopy, tensile testing and density measurements. One conclusion of this paper is that sequential aging (different stresses one after the other) could be inefficient for the purpose of simulating the ageing of service insulation. On the contrary, it was found that simultaneous aging has significant effects on material properties.
As LEDs are gradually taking over as preferred lighting systems, their lifespan is also of the utmost importance, particularly for economic reasons. In [10], three different life models are derived from ALT under step-varying forward current (with load cycles), considered here as the most influential stress factor. This work compares the effects of constant and non-constant current stress applied to 8 LEDs at once. Similarly to our work which is described below, the errors between model predictions and experiments are reduced for large lifespans.
Of course, battery lifetime is a very important issue, both for embedded systems such as electric vehicles and for stationary energy storage in some wind power plants for example. Battery energy storage systems can provide promising solutions for smoothing the power produced by wind power plants and by extension, for any fluctuating renewable energy source. Recent papers tackle the lifetime estimation through modeling after accelerated tests. Li-ion batteries are tested in [11] under different stress conditions (temperature, depth of discharge (DOD) cycle and state-of-charge (SOC). These three factors have three levels each
leading to 33 = 27 possible cases which all had to be tested for a reduced set of three battery cells in a serial connection. However, in order to reduce the experimental cost, all the experiments were carried out at an average SOC level of 50%, consequently only 9 experiments were necessary but the validity of the model is thereby reduced. Finally, the derived models are only two-dimensional as time and temperature are involved. Model coefficients are obtained by a classical curve fitting method and model validity are tested under specific mission profiles with very good agreement.
Indeed, very few papers deal with insulation system lifespan modeling and/or the tests required for this. Nevertheless, with the increasing electrical power in embedded systems for various applications such as energy generation, traction, air conditioning, etc., the challenges of partial discharge detection or withstanding is of paramount importance.
B. PD and ALT
For inverter-fed rotating machines, the International Standard Commission (IEC) published specific standards [12] and [13], respectively considering type I machines, supposed to operate without any partial discharge and type II that can cope with moderate levels of PD. Type II are defined in [14], as “insulation system of stator/rotor windings of single or polyphase AC machines which are subjected to repetitive impulse voltages, such as pulse width modulation (PWM) converters and expected to withstand partial discharge activity during service”. Additionally, [14] upgrades IEC 60034-18-41, from a technical specification to a standard, with a new value: Impulse Rated Voltage (IRV); this value will be printed on the machine plate. These documents describe the required tests to qualify a material with regard to this norm, with several test voltages chosen so as to produce mean times to failure in the range from 100h to 3000h. [13] provides lifetime formulas between voltage and frequency in steady state. Despite its well-documented influence, temperature is not taken into account. Combining the frequency and voltage- dependent aging formulae leads to the general expression (1) which can easily be plotted as lines in a Log-Log representation. !"#$"% !&#$&' ())& "* + ' (,,& "* (1)
Lf2u2 is the lifetime at frequency f2 and voltage U2, respectively with f1 and U1 and n is the voltage endurance coefficient, i.e. the slope of the graph of log (applied voltage) vs log (time to failure) at 50/60 Hz. This model form with L as a power of V and F was chosen in section VI of this paper.
The characteristics of the test signals are important as described in [16]. Sinusoidal and square waveform supplies are compared in terms of PD generation in MV machines. In these experiments, 5 enameled twisted pairs with a single contact point are tested under 3.5kV with different
waveforms, different frequencies and different rise times. PD is recorded with a ultra-high frequency test bench to explain their influence on insulation endurance. An original and interesting analysis compares the different test signals not only with respect to lifespan (in minutes) but also by counting the number of pulses to breakdown, i.e. taking into account the signal frequency. Surprisingly, low frequency test signals induce a higher degradation due to PD. Besides, [16] shows that PD intensity in low-voltage and medium-voltage inverter-fed machines is not directly related to frequency, even with impulsive voltage test signals, but that rise time has much more influence. Aging or lifespan tests have to be designed accordingly and in order to adapt to in-service conditions.
Regarding temperature, [17] specifies the general ageing conditions and procedures to be used for deriving thermal endurance characteristics and provides help in using the detailed instructions and guidelines in the other parts of the standard [18]. This part of IEC 60216 gives guidance on the choice of the test criteria for the determination of thermal endurance characteristics. It includes a list of existing published procedures which is non-exhaustive. This model form for Log (L) as an inverse power of T was chosen section V of this paper.
Finally, it is important to notice that population size is an issue. In [19] particularly, the effect of “small” sample size is investigated. However 80 units is still significantly more than in real-life conditions for stator insulation aging effects and PD.Turn-to-turn isolation is monitored in [20] [21] through the off-line measure of the variation in the winding turn-to-turn capacitance and of the Partial Discharge Inception Voltage (PDIV). Different twisted enameled wire pairs are tested along 10 thermal cycles lasting 24 hours at 280°C, according to the standard EN 60172. Turn-to-turn capacitance and PDIV measurements are performed before and after each thermal aging cycle. There is an obvious correlation between an increased capacitance and a reduction of the PDIV between aging cycles. This could lead to a new health indicator provided that a reliable and easy to obtain link is found between the two quantities.
Based on the same principle that winding capacitor variations should be in relationship with degradation, [22] [23] suggest monitoring machine health by evaluating its high frequency properties. Additional capacitors are put in parallel with the machine windings in order to emulate insulation degradation. The measurement method involves a voltage step excitation of the machine by the switching of the inverter. Insulation health indicator of the three phases of the machine is derived after signal processing of the phase currents even with current sensor bandwidths limited to hundreds of Khz and with only two phase current sensors. Experimental validation tests are achieved on two test machines (5.5kW and 1.4MW) with different insulation systems. The influence of moisture is evaluated as negligible and the authors recommend using the same temperature throughout the test as it may influence the results.
V.REGRESSION METHODS FOR LIFESPAN MODELING
A. General considerations
Lifespan modeling is a complex task due to the large number of phenomena and factors involved. Developing a lifespan model based on physics is not an easy task and often focuses on a single factor. Different expressions have been proposed in the literature such as the Arrhenius law [24] for one factor or the Eyring model [25] in the case of multiple factors. Empirical and physical models have been developed to relate the insulation aging mechanism or lifespan with applied stress factors [26][25][27]. However, these models are restrictive since they take into account only one aging factor as in the case of the Arrhenius law, or two factors as in the case of Crine’s electrothermal model. As in practice insulation lifespan is sensitive to numerous factors and their interactions, these models should include several parameters related to the studied material. Nevertheless, these models generally require complex experimental setups in order to estimate the physical properties of the studied materials and the required tuning constants. They are obtained in labs on samples and, so far, this protocol seems inappropriate concerning parts of stators. No comprehensive method has been proposed to take into account all the stress factors and their interactions in a single batch of experiments.
An alternative way to address this problem is to develop lifespan models based on experimental measurements, i.e. mathematical models that fit the experimental data. This methodology is called regression. The choice of the lifespan forms and factors remains critical for the model to be accurate. Physical knowledge of involved phenomena may help to choose the appropriate form and factors. For example, a log-based relationship for frequency and voltage and an exponential form for temperature are widely used in the literature [28][29][18] .The accuracy of the model also depends on the choice of experimental measurements (range, levels). The average insulator lifespan under normal operating conditions is of several thousand hours therefore carrying out full ageing tests would be far too expensive. B. Organized experiments
The Design of Experiments method (DoE) is a systematic and efficient method to organize the experiments in order to optimize a process or to estimate a model [30]. Recent literature provides a large number of papers using DoE for various item optimization e.g., machine rotor or inverter in PV systems. DoE helps to reduce the cogging torque and operating torque ripple in [31] [32] through Finite Element Analysis (FEA). Besides, [33] aims at optimizing the reliability in inverters for photovoltaic systems. An inverter is designed several times in order to increase the reliability, with a desired mean time between failures of 12 years. DoE is sometimes combined with other optimization methods. Transformers are optimized in [34] with regard to the iron and copper mass thanks to a multi-objective design which associates a pattern search optimization technique and the Taguchi methodology. Design of Experiments (DOE) is combined with
Differential Evolution (DE) algorithm objective design optimization of ferrite with fractional-slot concentrated windings the sequential subspace optimization met in [36] to improve the optimization permanent-magnet transverse flux mac magnetic composite core. But one of th and simple associations is based on D Surface methodology. [37] uses both fo hybrid magnetic planetary geared per magnet for electric vehicle applicatio option, optimization or modeling, the m DoE is to maximize the model accuracy the number of experiments. This meth interesting when a large number of fac Coupling effects between the different fa into account and the most influential identified. The principle of DoE is to a each factor and to organize the experim different configurations such that each equitably distributed over these confi factors, the total number of experiments n=mk. The levels are normalized betwe relation to the real constraint values. Tab technique in a very simple case of two with two levels. Level -1 is for the low for the high one. The average response of experiments is denoted M. For each e response yi is measured. It is interesting
level of the interaction between the computed as the product of the factor leve
TABLE I
Example of an experimental plan for the 2 factors and 2 levels eac Experience Number M F1 F2 I12 1 1 -1 -1 +1 2 1 -1 +1 -1 3 1 +1 -1 -1 4 1 +1 +1 +1
In this case, the mathematical m response Y with the different factors is exp
-./01232014340124 where Ej denotes the effect of factor Fj a effect of interaction Iij. According to eq.
interaction affects the average lifespan, pr level value. A linear lifespan model is from the lifespan measurements on the ex of each factor which can be seen as the factor domain. In practice, the effect vect computed as in (3):
5%6728-s for the multi-magnet machines s in [35]. DoE and thod are presented efficiency of a chine with a soft he most promising oE and Response or the design of a rmanent brushless on. Whatever the main objective of while minimizing hod is especially tors are involved. actors can be taken l factors can be assign m levels to ments according to h factor level is igurations. For k is then defined as een -1 and +1 in ble I illustrates this factors F1 and F2 constraint and +1 f the system for all experiment i, the g to note that the 2 factors I12 is els.
DoE method with ch Reponse Y y1 y2 y3 y4 odel relating the pressed as in (2):
4924 (2)
and Eij denotes the
(2) each factor or roportionally to its indeed computed xtreme constraints boundaries of the tor 5 % :;# <=>? is (3)
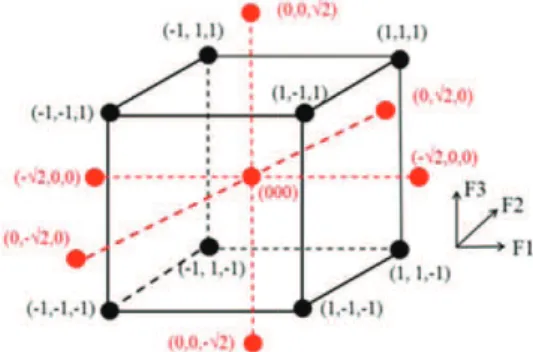
with @ % :;# A&# A"# B&"> the l vector of the average measure tested configurations. DoE pro estimation if the hypothesis of the response, the factors and th Response Surface Method (RSM non-linear relationships betwee quadratic effects of the mai organizes the experiments t However, RSM needs more ex more effects are taken into design of RSM is the Centra depicted in Fig. 3 for three dif be seen as DoE configurations extra points at the center (leve the factors’ domain (red poin model orthogonality and to reu the extra levels are chosen equa is evaluated on 5 levels: C7D4E
Fig. 3. Central composite design for 3
The factor effect vector Ê i according to (4) with X the difference is the computation o no longer a square matrix.
5%F
:
6G8672It has been proven in [3 improves the DoE lifespan insulation but at the cost o experiments. As for an opti already been used for modeli model of the temperature ris achieved thanks to this method Experiments involving speed a for a second-order fitted mo between the model and the ex the temperature rise. A com solved with DoE and geneti squeeze film haptic tactile f models exist for a few special the force generated on the user'
evel matrix and -%:HI> the ed lifespan for the different ovides an appropriate model a linear relationship between heir interactions is valid. The M) extends the DoE model to en factors by considering the in factors [38]. RSM also to minimize their number. xperiments than DoE because account. The most popular al Composite Design (CCD) fferent factors. The CCD can (black points in Fig .4. plus l 0) and at the boundaries of nts). In order to ensure the use the previous DoE points, al to +/- D4 [39]. Each factor
72E JE 02E 0D4K.
3 different factors
is computed similarly to DoE e configuration matrix. The of X pseudo-inverse since it is
>
2 86G8- (4)
39] [40] that RSM actually n modelling of electrical of doubling the number of imization option, DoE has ing different phenomena. A se in induction machines is d combined with RSM [41]. and load as factors in a CCD odel with good correlation xperimental results regarding mplex modeling problem is ic algorithm in [42] for a feedback actuator. As FEM cases, an empirical model of 's finger is given.
C. Random experiments
When experiment organization is no possible, Multiple Linear Regression (ML flexible methodology than DoE or R modeling [43]. The MLR method estima of a linear model relating the response Y a explanatory variables from n experim randomly chosen. The only cond experiments are their number, which mu the number of explanatory variables (n> must be independent. Contrary to DoE models involve true factor values instead general case, the model can be expressed a
L % M NO O
P @O0 Q whereFR@OSOT&''U denotes the explanatory v denotes the model parameters and u deno The model parameter vector β can be e experiments by the ordinary least squa parameter vector estimates NV to be deri (6):
NV % :@?P @W&> P @?P L
In our case, Y denotes the vector insulation lifespan logarithms. X denotes associated factors or explanatory Considering a very general model, variables can be the logarithm of the elect (log(V), log(F)), an exponential form o (exp( bT)) as well as quadratic forms o and/or interactions between these variab MLR method does not impose a particula contrarily to the DoE and RSM method advantage of the MLR method is that an can be selected from performance compa models on a test set. The model can (constant and linear terms), linear (constant, linear, and interaction t (constant, linear, interaction, and square quadratic (constant and squared terms influence of the explanatory variable ran performance can also be studied.
Indeed a single model can hardly repr of the studied material under mild to ex conditions. For instance, we can alterna study to the shortest, highest and mediu appropriate choice of the factor ranges associated performance. It is then pos regression on particular ranges independ the MLR framework provides a more syst solve this problem by considering regression [44]. Regression model perform the accuracy of the measurements perf experiments. Ordinary least squares estim models are highly sensitive to so- called
ot required or not LR) offers a more RSM for lifespan ates the parameter and the p so-called ments that can be ditions regarding ust be higher than >p), and that they and RSM, MLR d of levels. In the as (5):
(5) variables, RNOSOT&''U otes the error term. estimated from the ares method. The ived as follows in (6) of the measured s the matrix of the variable values. the explanatory trical stress factors of the temperature of these variables bles. However, the ar model structure, ds. Thus, the first appropriate model arison of different n be either linear with interactions terms), quadratic ed terms) or pure s). Moreover the nges on the model resent the behavior xtreme operational atively restrict the um lifespan by an and compare the ssible to perform dently. Moreover, tematic solution to multiple-regime mance depends on formed during the mates for regression d outliers. Outliers
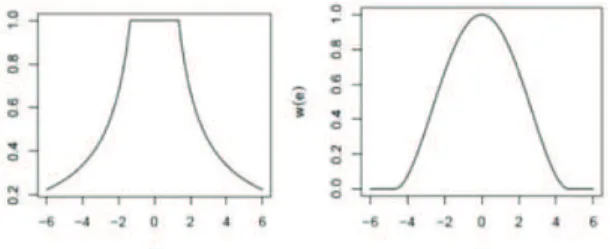
can occur in practice for many measurements, measurements running under the assumed sp mode that is not totally und outlier can be defined as a data +5% tail area of the k assumed However, the MLR method can point, leading to so-called rob principle of robust regression weighting function on high va minimize the impact of outl examples of Huber (on the left weighting functions.
Fig. 4. Huber (on the left) and bisquare
Robust regression has been data plotted on a computer-gen Robust regression algorithm Ordinary Least Squares (OLS) particularly effective in s contiguous failures. However, p to infer the lifetime statist operating conditions. In the c regression of the lifetime with the robust methods have be approach for the lifespan mo pairs in [47]. The performance least squares than with robus regression is not appropriate f Moreover, in the particu measurements are available configuration, outliers can als basic statistical consideration variance on a given experimen Suppression of outliers leads robust regression in this case measurements by their median leading to equivalent perform MLR method is far more flexib the experiments can be rando models for particular factor ran other hand, DoE and SRM models with fewer experiments D. Significance tests
Multilinear regression prov significance analysis and app assessment [49]. Covariate sta checked by an F-test of the ove individual parameters. The P va
reasons including inaccurate from a process that is not pecifications, and/or a failure derstood. Quantitatively, an a point which falls outside the
sampling distribution. n be modified to address this bust regression methods. The n is to iteratively apply a ariance residuals in order to liers [45]. Figure 4 shows t) and bisquare (on the right)
e (on the right) weighting function
n used for fitting failure-time nerated probability plot [46]. ms performed better than ) in most data sets and were situations involving early probability plots are intended tical distribution in given context of direct multilinear h respect to multiple factors, een compared to the OLS odeling of insulated twisted remains better with ordinary st regression. Indeed, robust for small sample sizes [48]. ular case where several for the same experiment so be identified using some ns (regarding measurement nt for instance) and removed. to better performance than e. Replacing such groups of ns is also a robust alternative mance. As a conclusion, the ble than DoE and RSM since omly chosen and appropriate nges can be selected. On the outperform more accurate s.
vides a framework for factor propriateness of the model atistical significance can be erall fit, followed by t-tests of alue measures the correlation
between a given covariate and the response. In the case where interactions are taken into account, some particular tools are also available [50]. Goodness of fit can be measured using residual analysis and hypothesis testing. The R-squared of the regression, equal to the fraction of the variation of the response that is predicted by the covariates, provides a quantitative measure of the appropriateness. Moreover the significance of each factor effect (or interaction effect) must be evaluated. ANalysis Of VAriance (ANOVA) [51][40] is a good candidate to check whether the model coefficients are significant or not. ANOVA is a widely used statistical model able to separate in two parts (the random and systematic factors), the total variability found within a data set into two components Prior to using ANOVA, two conditions must be verified:
• data must be normally distributed for each factor, which can be achieved using a Shapiro-Wilk test [52], • the different data must be independent.
Variance Vi due to the specific factor i is compared to
the variance of the whole experimental data set, called residual variance Vr. A factor is not significant if its
variance Vi is very close to Vr. On the other hand, variance V1 of a significant factor is higher than the residual variance
Vr. The ratio Fexp=Vi/Vr is computed and tested using a
Fisher-Snedecor test. The effect of factor i is considered as statistically significant if Fexp is greater than Flim. Threshold Flim could be found in the table of upper critical values of
the F-distribution depending on the degree of freedom of the data and the test significance level (generally 5%).
VI.TEST BENCHES
Two test benches have been successively used in our lab in recent years. Kapton films as in Fig. 5 were submitted to sinusoidal voltage with or without DC part, for different temperatures and frequencies on a first test bench.
Fig. 5. Kapton films under tests Fig. 6. Tested 90µm coated steel plate (15cm x 9cm) with polyesterimide (PEI)
This first study validated the DoE potential for lifespan modeling. DC voltage was found to have no significant effect on lifespan. Then, coated steel plates (15cm x 9cm) with 90µm polyesterimide (PEI - thermal class: 180°C) as in Fig. 6 were tested in [53] in a climatic chamber.
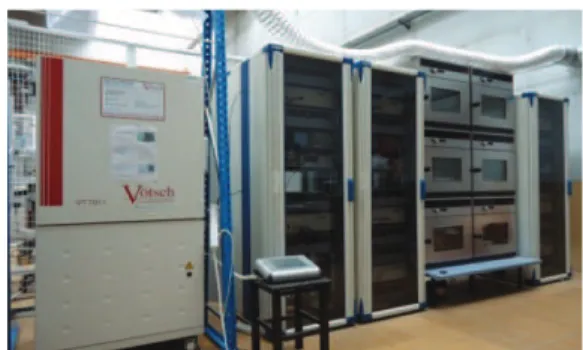
Fig. 7. The experimental setup for accelerated aging tests, climatic chambers and power electronic
Fig.8. Twisted pairs EDERFIL
C200 Fig. 9. experimental arrangement of the twisted pairs in the climatic chamber
A second test bench Fig. 7 produces square-wave high voltage (with 10kV/ms as rise time) for two-level DoE. The studied factors are voltage amplitude, frequency and temperature. Tested samples were placed in a climatic chamber with full temperature control. The same equipment supplied twisted pairs covered with a double varnish of Poly-Ether-Imide (PEI) and Poly-Amide-Imide (PAI) with a thermal class of 200°C (Ederfil C200, 0.5mm diameter), as shown in Fig. 8 and Fig. 9 in [40][39]. These twisted pairs are manufactured according to the American National Standard (ANSI/NEMA MW 1000-2003, Rev. 3, 2007).
V.RESULTS
A. Different Models
According to DoE, experiments are organized in a specific matrix, first part of Table III, named DoE. It involves eight combinations of the three stress factors with two levels each, i.e. 28 experiments. The number of required experiments is minimized and model accuracy increases. The expected lifespan model is expressed in (7): Log(L)DoE = M + EV.Log(10V) + EF.Log(F) + ET.exp(-bT) +
IVF.Log(10V).Log(F) + IVTLog(10V).exp(-bT) + IFT.Log(F).exp(-bT) + IVFT.Log(10V).Log(F).exp(-bT)
(7) Note that the model form between Log(L) and, Log(V), Log(F) and exp(-bT), were chosen in agreement with IEC 60013 standard [13] for V and F and IEC 60216-1 standard for T [17].
The Response surface (RS) method extends the DoE model and improves its accuracy with quadratic terms. The lifespan model becomes (8):
Log(L)RS = Log(L)DoE + IVVLog(10V)2 + IFFLog(F)2 +
Therefore, three additional levels are required. The design configuration was specified according to Central Composite Design defined by:
a complete 23 DoE design,
two axial points on each factor axis at a distance µ from the center, i.e. two extra levels (± µ),
n0 central points, i.e. all the factors at 0 level,
n0 and µ values are 4 and √2 respectively, so that the
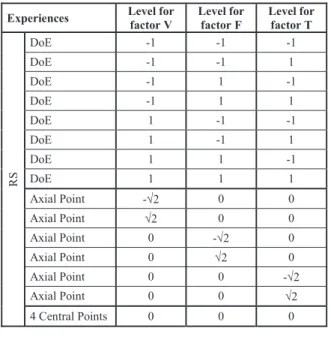
obtained design is orthogonal. Thus, the total number of required experiments is 18. Table II displays the different configurations of the experiments required by DoE and RS methods. Factor levels are defined in Table III.
TABLEII
Levels of the Stress Constraints Required for DoE and RS Experiences Level for
factor V Level for factor F Level for factor T R S DoE -1 -1 -1 DoE -1 -1 1 DoE -1 1 -1 DoE -1 1 1 DoE 1 -1 -1 DoE 1 -1 1 DoE 1 1 -1 DoE 1 1 1 Axial Point -√2 0 0 Axial Point √2 0 0 Axial Point 0 -√2 0 Axial Point 0 √2 0 Axial Point 0 0 -√2 Axial Point 0 0 √2 4 Central Points 0 0 0 TABLEIII
Normalized Levels of the Stress Factors Levels Log(10V) (kV) Log(F) (kHz) Exp(-bT) (°C)
-√2 Log(10*1) Log(5) Exp(55b) -1 Log(10*1.174) Log(5.872) Exp(34.82b)
0 Log(10*1.73) Log(8.7) Exp(26.7b) +1 Log(10*2.554) Log(12.77) Exp(-119.74b) +√2 Log(10*3) Log(15) Exp(-180b)
B.
B. DoE results
The first lifespan model is derived from only 8 experiments according to the DoE method. The model is applied on 24 extra experiments included in a validation set. The estimated parameters (average lifespan M, factor effects and interaction effects) are given in Fig. 11.a. Comparison between measured and predicted lifespans could be seen in Fig. 11.b. The most influential factors are easily identified: voltage and temperature. Additionally, their interaction is the most influential with respect to the
other interactions. Calculations have been made with different criteria: average value of the 6 lifespans in an experiment, median value or according to Weibull distribution. Some of the measured lifespans are far from the average value. They could be considered as outliers, i.e. values out of the expected range susceptible to cause a bias in the model. Moreover, they have a significant influence on the mean value because the population is very small. Medians are preferred as they are more robust to extreme values than averages [54]. Relative errors between predicted and measured responses in the test set range from 0.8% to 234% with an average value of 31%. For example, the test of a model based on the average values rather than the medians leads to an average error of 38%, min error of 1.3% and maximum of 324%.
Fig. 11a. DoE model: estimation of factor and interaction effects
Fig. 11b. DoE model: comparison measured /estimated lifespans
C. RS model
The factor effects obtained by the DoE model reflect reality regarding the high influence of voltage and temperature. However, the model seems to be insufficient since some test points present significant errors (>100%). The model is thus extended by adding quadratic terms, leading to the RS model. The training set consists of 18 experiments and results are in Fig. 12.a and Fig.12.b.
Fig. 12a. RS model: estimation of factor and interaction effects
Fig. 12b. RS model: comparison measured / estimated
In addition to the high effects of V, T and their interaction, the RS model reveals a significant contribution of the quadratic term T2. The maximum and average relative errors computed on the test set decreases to 53% and 25% respectively. In this case, they remain higher with the average values compared to those of the medians Thus, this model is more accurate since it takes more significant effects into account and leads to lower errors. Moreover, our results fit those of “Table 1–Influence of features of the
converter drive voltage on acceleration of ageing of components of Type II insulation systems” in [13], where it is stated that fundamental frequency is less influential than the voltage. But it is important to notice that the highest relative errors are for the shortest lifespans which are not our main interest. For example, if the test set includes only lifespans longer than 3mn, minimum, average and maximum errors become respectively 0.4%, 5% and 18%. D. MLR results
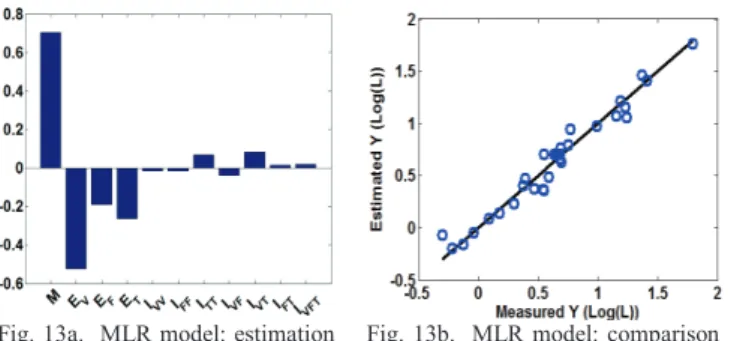
Fig 13.a and Fig.13.b present the results obtained with Multi Linear Regression. The relative errors between the model outputs and the validation test range from 0.15% to 193%, with an average error of 22%, which are of the same order of magnitude than those of the DoE or RSM.
Fig. 13a. MLR model: estimation of factor and interaction effects
Fig. 13b. MLR model: comparison measured / estimated lifespans
VIII.CONCLUSION
The problem of lifespan modelling for insulation systems of electrical machines was adressed in this paper. Three different insulation materials were tested, kapton films, polyesterimide films and enameled twisted pairs. It was shown that several regression methods are able to provide satisfying multiconstraint models. DoE and RSM are the most accurate with a limited experimental cost, while multi linear regression is more flexible as it does not require organised experiments.
Future work will take into account rise time rather than frequency, pressure and temperature cycling. As a consequence, the number of factors will dramatically increase and DoE will be a very useful method. Nevertheless, several points remain an issue. Results have been given for lifetime but aging modelling is still pending. As PWM inverters can involve more than 3 levels, multi level contraints could be included in the scope of the study. Finally, parts of real stators should be tested rather than samples, but the very limited number of specimen remains a challenging problem.
IX.REFERENCES
[1] P.J. Tavner, “Review of condition monitoring of rotating electrical machines”, IET Electric Power Applications, vol. 2, no. 4, pp. 215-247, 2008
[2] T. Billard, T. Lebey and F. Fresnet, “Partial discharge in electric motor fed by a PWM inverter: off-line and on-line detection”, IEEE Trans. Dielectrics and Electrical Insulation, vol. 21, no.3, pp. 1235– 1242, June 2014
[3] L.A. Renforth, R. Armstrong, D. Clark, S. Goodfellow and P.S.
Hamer, “High-Voltage Rotating Machines: A New Technique for Remote Partial Discharge Monitoring of the Stator Insulation Condition”, IEEE Industry Applications Magazine, vol. 20, no. 6, pp. 79 – 89, 2014
[4] D. Fabiani, A. Cavallini and G.C. Montanari, “A UHF Technique for Advanced PD Measurements on Inverter-Fed Motors”, IEEE Trans. Power Electronics, vol. 23, no. 5, pp. 2546-2556, 2008 [5] F. Paschen, « Sur la différence de potentiel nécessaire à la
formation d'arc électrique dans de l'air, de l'hydrogène et du gaz carbonique sous différentes pressions » (trad. Über die zum Funkenübergang in Luft, Wasserstoffand Kohlensäure bei verschiedenen Drücken erforderliche Potentialdifferenz), Wied. Annales de physique, vol.37, 1889, pp. 69-96
[6] E. Sili, F. Koliatene, J.P. Cambronne, “Pressure and temperature effects on the paschen curve”, in Proc. 2011 Electrical Insulation and Dielectric Phenomena Conf., pp. 464 – 467
[7] M.Q. Nguyen, D. Malec, D. Mary, P. Werynski, B. Gornicka, L. Therese, and P. Guillot, “Silica nanofilled varnish designed for electrical insulation of low voltage inverter-fed motors”, IEEE Trans. Dielectric and Electric Insulation, vol. 17, no. 5, pp. 1349-1356, 2010
[8] M.F. Cabanas, J.G. Norniella, M.G. Melero, C.H. Rojas, J.M. Cano, F. Pedrayes and G.A. Orcajo, “Detection of stator winding insulation failures: On-line and off-line tests”, in Proc. 2013 IEEE Electrical Machines Design Control and Diagnosis Workshop, pp. 210–219
[9] L. Verardi, D. Fabiani and G.C. Montanari, “The influence of accelerated aging procedures on the correlation of electrical and mechanical properties of LV nuclear power plant cables”, in Proc. Electrical Insulation and Dielectric Phenomena Conf., pp. 506 – 509
[10] A. Albertini, G. Mazzanti, L. Peretto and R. Tinarelli, “Development of a Life Model for Light Emitting Diodes Stressed by Forward Current”, IEEE Trans. on Reliability, vol. 63, no. 2, pp. 523-53, 2014
[11] M. Swierczynski, D. Stroe, A-I. Stan and R. Teodorescu, “The lifetime of the LiFePO4/C battery energy storage system when used for smoothing of the wind power plant variations”, in Proc. 2013 IEEE Industrial Electronics Conf., pp. 6825 - 6830
[12] Qualification and type tests for Type I electrical insulation systems used in rotating electrical machines when fed from voltage converters, IEC 60034-18-CD International Standard, 2012. [13] Qualification and acceptance tests for partial discharge resistant
electrical insulation systems (Type II) used in rotating electrical machines when fed from voltage converters, IEC 60034-18-42 TS, International Standard, 2008.
[14] A. Cavallini, G.C. Montanari and L. Fornasari, “The evolution of IEC 60034-18-41 from technical specification to standard: Perspectives for manufacturers and end users”, in Proc. 2012 IEEE Power Modulator and High Voltage Conf., pp. 160-164
[15] P. Wang, A. Cavallini and G.C. Montanari, “Endurance testing of rotating machines insulation systems: Do sinusoidal and square voltage waveforms provide comparable results? “, in Proc. 2013 IEEE Solid Dielectrics Conf., pp. 310-313
[16] P. Wang, G.C. Montanari, and A. Cavallini, “Partial Discharge Phenomenology and Induced Aging Behavior in Rotating Machines Controlled by Power Electronics”, IEEE Trans. on Industrial Electronics, vol. 61, no. 12, pp. 7105-7112, 2014
[17] Electrical insulating materials–Thermal endurance properties–Part 1: Ageing procedures and evaluation of test results, IEC 60216-1 International Standard, 2013
[18] Determination of thermal endurance properties of electrical insulating materials–Choice of test criteria, IEC 60216-2 2005-08, part 2, IEC International Standard, 2005
[19] M. Haiming and W.Q. Meeker, “Strategy for Planning Accelerated Life Tests With Small Sample Sizes”, IEEE Trans. on Reliability, vol. 59, no. 4, pp. 610-619, 2010
[20] S. Savin, S. Ait-Amar, D. Roger and G. Velu, “Aging effects on the AC motor windings: A correlation between the variation of turn-to-turn capacitance and the PDIV”, in Proc. 2011 Electrical Insulation and Dielectric Phenomena Conf., pp. 64 - 67
[21] S. Savin, S. Ait-Amar and D. Roger, “Turn-to-turn capacitance variations correlated to PDIV for AC motors monitoring”, IEEE
Trans. on Dielectrics and Electrical Insulation, vol. 20, no. 1, pp. 34 – 41, 2013
[22] P. Nussbaumer, M. Vogelsberger, and T. Wolbank, “Induction Machine Insulation Health State Monitoring Based on Online Switching Transient Exploitation”, IEEE Trans. on Industrial Electronics, vol. 62, no. 3, pp. 1835-1845,
[23] C. Zoeller, M.A. Vogelsberger, P. Nussbaumer and T.M. Wolbank, “Insulation monitoring of three phase inverter-fed AC machines based on two current sensors only”, in Proc. 2014 Electrical Machines Conf., pp. 1901–1907
[24] C. G. Stone, “The statistics of aging models and practical reality,” IEEE Trans. on Electrical Insulation, vol. 28, no. 5, pp. 716 – 728, 1993
[25] G. Mazzanti, “The combination of electro-thermal stress, load cycling and thermal transients and its effects on the life of high voltage ac cables”, IEEE Trans. on Dielectrics and Electrical Insulation, vol. 16, no. 4, pp. 1168–1179, August 2009
[26] L. Escobar and W. Meeker, “A review of accelerated test models”, Statistical Science, vol. 21, no. 4, pp. 552-577, 2006
[27] Z. Li, K.S. Moon, Y. Yao, K. Hansen, L. Watkins, Morato and C.P. Wong, “Carbon nanotube/polymer nanocomposites: Sensing the thermal aging conditions of electrical insulation components”, Carbon, vol. 65, pp. 71-79, 2013
[28] A. Gjaerde, “Multi-factor ageing models - origin and similarities”, in Proc. 1995 Electrical Insulation and Dielectric Phenomena, 1995, Conf., pp. 199–204
[29] R. Bartnikas and R. Morin, “Multi-stress aging of stator bars with electrical, thermal, and mechanical stresses as simultaneous acceleration factors”, IEEE Trans. on Energy Conversion, vol. 19, no. 4, pp. 702–714, Dec 2004
[30] R.A. Fisher, The design of experiments, Oliver & Boyd, Ed., 1935 [31] K. Min-Chul, K. Dong-Yeong and K. Gyu-Tak, “Optimal rotor
shape design to reduce the vibration of IPMSM”, in Proc. IEEE 2014 Energy Conversion Congress and Exposition, pp. 2441-2446 [32] M.A. Khan, I. Husain, M.R. Islam and J.T. Klass, “Design of
Experiments to Address Manufacturing Tolerances and Process Variations Influencing Cogging Torque and Back EMF in the Mass Production of the Permanent-Magnet Synchronous Motors”, IEEE Trans. on Industry Applications, vol. 50 , no. 1, pp. 346 – 355, 2014 [33] F. Chan, and H. Calleja, “Design Strategy to Optimize the Reliability of Grid-Connected PV Systems”, IEEE Trans. on Industrial Electronics, vol. 56, no. 11, pp. 4467-4472, 2009 [34] L. Petkovska, M. Digalovski, G. Cvetkovski, and P. Lefley, “A novel
approach to multi-objective efficiency optimisation for a distribution transformer based on the Taguchi method“, in Proc. 2014 International Conference on Electrical Machines, pp. 2228 - 2234
[35] Z. Peng, G.Y. Sizov, D.M. Ionel and N.A.O. Demerdash, “Design optimization of spoke-type ferrite magnet machines by combined design of experiments and differential evolution algorithms”, in Proc. 2013 IEEE International Electric Machines & Drives Conference, pp. 892 - 898
[36] G. Lei, T. Wang, Y. Guo, J. Zhu and S. Wang, “System-Level Design Optimization Methods for Electrical Drive Systems: Deterministic Approach“, IEEE Trans. on Industrial Electronics, vol. 61, no. 12, pp. 6591-6602, 2014
[37] Z. Xiaoyong, Y. Bing, C. Long, Z. Renzhong, Q. Li and M. Lihong, “Multi-Objective Optimization Design of a Magnetic Planetary Geared Permanent Magnet Brushless Machine by Combined Design of Experiments and Response Surface Methods”, IEEE Trans. on, Magnetics, vol. 50, no. 11, 2014
[38] R. Myers and D. Montgomery, Response Surface Methodology, J. Wiley & Sons, Ed., 2002
[39] S. Ursua, A. Picot, M.Q. Nguyen, M. Chabert, and P. Maussion, “Regression methods for improved lifespan modeling of low voltage machines insulation”, in Proc. 2014 IEEE Electrimacs,
[40] A. Picot, D. Malec and P. Maussion, “Improvements on lifespan modeling of the insulation of low voltage machines with response surface and analysis of variance”, in Proc. 2013 Diagnostics of Electric Machines, Power Electronics and Drives Conf., pp. 607– 614.
[41] S. Ki-Hyun, H. Jooho, S. Jongyoub and C. Han-Wook “Investigation of Temperature Rise in an Induction Motor
Considering the Effect of Loading”, IEEE Trans. on Magnetics, vol. 50, no. 11, 2014
[42] C. Winter, M. Markovic and Y. Perriard, “Empirical modeling of a squeeze film haptic actuator”, in Proc. 2012 International Conference on Electrical Machines, pp. 658–663
[43] S. Weisberg, Applied linear regression, J. Wiley & Sons, Ed., 2005 [44] J. Bai, “Estimation of multiple-regime regressions with least
absolutes deviation”, Journal of Statistical Planning and Inference, vol. 1, no. 74, pp. 103–304, Oct 1998
[45] A. Zoubir, K. Koivunen, Y. Chakhchoukh and Muma M., “Robust estimation in signal processing”, IEEE Signal Processing Magazine, pp. 61–80, July 2012
[46] C. Lawson, J.B. Keats and D.C. Montgomery “Comparison of robust and least-squares regression in computer-generated probability plots”, IEEE Trans. Reliability, vol.46, no. 1, March 1997
[47] M. Chabert, F. Salameh, A. Picot and P. Maussion, “Lifespan modelling of low voltage machine insulation using multilinear regression” in Proc. 2014 Condition Monitoring
[48] M. Riani, A. Cerioli, M. Milioli, and G. Morelli, “A comparison of robust methods with small sample experimental data”, Proc. 2012 Scientific meeting of the Italian Statistical Society
[49] S. Weisberg, Applied linear regression, 4th edition, Wiley, 2014 [50] K.J. Preacher, P.J. Curran and D.J. Bauer “Computational Tools
for Probing Interactions in Multiple Linear Regression, Multilevel Modeling, and Latent Curve Analysis “, Journal of Educational and Behavioral Statistics, vol. 31, no. 4, pp. 437-448, 2006
[51] M. Pillet, Les plans d’expériences par la méthode Taguchi, Paris, Les Editions d’Organisation, 2001.
[52] S. Shapiro and M. Wilk, “An analysis of variance test for normality”, Biometrika, vol. 52, no. 3, pp 591-611, 1965
[53] N. Lahoud, J. Faucher, D. Malec and P. Maussion, “Electrical aging of the insulation of low-voltage machines: Model definition and test with the design of experiments”, IEEE Trans. on Industrial Electronics, , vol. 60, no. 9, pp. 4147–4155, Sept 2013
[54] P.J. Rousseeuw and M. Hubert, “Robust statistics for outlier detection”, WIREs Data Mining and Knowledge Discovery, vol. 1, pp. 73-79, 2011
X.BIOGRAPHIES
Pascal Maussion got his MSc and PhD in Electrical Engineering in
1985 and 1990 from Institut National Polytechnique (INP) Toulouse, France. He is full Professor with the University of Toulouse and with the Laboratory of Plasma and Energy Conversion (LAPLACE), Toulouse. His research activities deal with control and diagnosis of electrical systems. He is currently Head of Control and Diagnosis group in LAPLACE.
Antoine Picot received his MSc degree in signal and image processing
in 2006 and his PhD in automatic control and signal processing in 2009 from the Institut National Polytechnique (INP) Grenoble. He is associate professor at the INP Toulouse and Researcher with the Laboratory of Plasma and Energy Conversion (LAPLACE), Toulouse. His research interests are in monitoring and diagnosis of complex systems with signal processing and artificial intelligence techniques.
Marie Chabert received the Eng. degree in Electronics and the M.Sc.
degree in Signal Processing from the National Polytechnic Institute of Toulouse (INPT) France, both in September 1994. In December 1997, she received the Ph.D. degree in Signal Processing from the INPT. She is a full Professor in the INPT and in the IRIT (Institut de Recherche en Informatique de Toulouse). Her research interests include non-uniform sampling, time-frequency diagnosis, and statistical modeling of remote sensing images.
David Malec was born in France in 1964. He obtained the Eng. degree
in 1992 from the National Conservatory of Arts and Crafts and the Ph.D. degree in 1996 from Paul Sabatier University of Toulouse. He is Professor in the Electrical Engineering department of this University. His scientific activities deal with the study of solid insulating materials (polymers and ceramics) low and high voltage electrical engineering domains.