O
pen
A
rchive
T
OULOUSE
A
rchive
O
uverte (
OATAO
)
OATAO is an open access repository that collects the work of Toulouse researchers and
makes it freely available over the web where possible.
This is an author-deposited version published in :
http://oatao.univ-toulouse.fr/
Eprints ID : 15978
To link to this article : DOI : 10.1021/acs.nanolett.6b00348
URL :
http://dx.doi.org/10.1021/acs.nanolett.6b00348
To cite this version :
Mottier, Antoine and Mouchet, Florence and
Laplanche, Christophe and Cadarsi, Stéphanie and Lagier, Laura
and Arnault, Jean-Charles and Girard, Hugues A. and León,
Verónica and Vázquez, Ester and Sarrieu, Cyril and Pinelli, Eric and
Gauthier, Laury and Flahaut, Emmanuel Surface Area of Carbon
Nanoparticles: A Dose Metric for a More Realistic Ecotoxicological
Assessment. (2016) Nano Letters, vol. 16 (n° 6). pp. 3514-3518.
ISSN 1530-6984
Any correspondence concerning this service should be sent to the repository
administrator:
[email protected]
Surface Area of Carbon Nanoparticles: A Dose Metric for a More
Realistic Ecotoxicological Assessment
Antoine Mottier,
†,‡Florence Mouchet,
†,‡Christophe Laplanche,
†,‡Stéphanie Cadarsi,
†,‡Laura Lagier,
†,‡Jean-Charles Arnault,
§Hugues A. Girard,
§Verónica León,
∥Ester Vázquez,
∥Cyril Sarrieu,
⊥,#Éric Pinelli,
†,‡Laury Gauthier,
†,‡and Emmanuel Flahaut
*
,⊥,#†
ECOLAB, Université de Toulouse, CNRS, INPT, UPS, F-31326 Castanet-Tolosan, France
‡
ENSAT, Avenue de l’Agrobiopôle, F-31326 Castanet-Tolosan, France
§
CEA LIST, Diamond Sensors Laboratory, F-91191 Gif sur Yvette, France
∥
Departamento da Química Inorgánica, Orgánica y Bioquímica, Universidad de Castilla-La Mancha, Avda. Camilo José Cela 10, 13071 Ciudad Real, Spain
⊥
Institut Carnot CIRIMAT (Centre Inter-universitaire de Recherche et d’Ingénierie des Matériaux), Université de Toulouse, INP, UPS, UMR CNRS 5085, F-31062 Toulouse cedex 9, France
#
CNRS, Institut Carnot CIRIMAT, F-31062 Toulouse, France
*
S Supporting InformationABSTRACT: Engineered nanoparticles such as graphenes,
nanodiamonds, and carbon nanotubes correspond to different allotropes of carbon and are among the best candidates for applications in fast-growing nanotechnology. It is thus likely that they may get into the environment at each step of their life cycle: production, use, and disposal. The aquatic compart-ment concentrates pollutants and is expected to be especially impacted. The toxicity of a compound is conventionally evaluated using mass concentration as a quantitative measure of exposure. However, several studies have highlighted that such a metric is not the best descriptor at the nanoscale. Here we compare the inhibition of Xenopus laevis larvae growth after in vivo exposure
to different carbon nanoparticles for 12 days using different dose metrics and clearly show that surface area is the most relevant descriptor of toxicity for different types of carbon allotropes.
KEYWORDS: Carbon allotropes, graphene, carbon nanotubes, nanodiamonds, metrics comparison, ecotoxicity
E
ngineered nanoparticles (NPs) such as graphenes,1 nanodiamonds (NDs),2 and carbon nanotubes (CNTs)3 have a number of unique features that make them behave differently from classical chemical products and bulk materials: “small act differently”.4,5The ratio of surface to total atoms or molecules increases exponentially with decreasing particle size.5 Increased surface reactivity predicts that nanoparticles should exhibit greater biological activity per unit mass compared with larger particles.6 This suggests that the expressed masscon-centration would fail to correctly predict the biological effect of NPs.6−8The aim of this study is to find the most relevant dose
metric to quantify the response of exposure to carbon-based nano-particles (C-NPs) having different structures and morphologies.
For this purpose, an animal model widely recognized in ecotoxicology was used: the larvae of the amphibian Xenopus
laevis. Exposure of larvae was based on the international
standardized bioassay procedure (ISO, 2006).9The amphibian model offers numerous advantages, including easy breeding, permeable skin, and gills,10and has previously been used for the
ecotoxicological assessment of NPs (e.g., cerium dioxide11and CNTs12−14). In order to find the most appropriate dose metric,
exposures were conducted for four different types of C-NPs: few-layer graphene (FLG), NDs, double-walled CNTs (DWCNTs), and multiwalled CNTs (MWCNTs) (Figure 1). On the basis of previous studies on CNTs,12,15 we focused on growth inhibition as an especially sensitive end point. Indeed, growth inhibition represents an integrative toxicological response that includes direct and indirect effects of the different NPs, reflecting the global health status of the living organisms.
X. laevis males were injected with 50 IU of pregnant mare’s
serum gonadotrophin (PMSG) 500 (Intervet, France, [9002-70-4]) and the females with 750 IU of human chorionic gonadotropin (HCG) (Organon, France, [9002-61-3]) in order to induce spawning. Viable eggs were maintained in a tank filled with tap
water filtered through active charcoal. The larvae were bred at 20−22 °C until they reached a development stage appropriate for experimentation (i.e., stage 50).16
The exposures were performed under semistatic conditions (ISO, 2006).9X. laevis larvae were exposed in groups of 15 (FLG)
or 20 (DWCNTs, MWCNTs, and NDs) larvae in crystal-lizing dishes for 12 days in reconstituted water (distilled tap water + nutritive salts [294 mg·L−1CaCl
2·2H2O, 123.25 mg L−1 MgSO4·7H2O, 64.75 mg L−1 NaHCO3, 5.75 mg L−1 KCl]). The exposure concentrations were achieved by adding a concentrated solution of nanoparticles. Detailed procedures used to obtain the various nanoparticles are provided in the
Supporting Information. Besides C-NP-exposed larvae, negative controls were also used. The temperature was 22.0 ± 0.5 °C, and the larvae were submitted to a 12 h/12 h light/dark cycle. The larvae were fed every day on dehydrated and crushed fish food (Tetraphyll).
Growth inhibition was evaluated by measuring the length of each larva at the beginning (t0) and the end (t12) of the exposure. Length measurements were performed with the ImageJ software (NIH Image, Bethesda, MD, USA). The length data were standardized as follows:
− × × ⎛ ⎝ ⎜ ⎞ ⎠ ⎟ ⎛ ⎝ ⎜ ⎞ ⎠ ⎟ Lt MLt MLt 100 100 MLCt 12 0 0 12
where Lt12is the length of one individual larva at 12 days, MLt0 is the mean length of the group at 0 days, and MLCt12is the mean length of the control group at 12 days
Amphibian dose−response growth inhibition was modeled by predicting the normalized size using the following two-parameter logistic equation:
= + α
( )
E(Size ) 100 1 ijk x EC 1/ ijk i i 50,where xijkis the dose and i, j, and k are the indices over dose
metrics, NPs, and concentrations, respectively. EC50,i is the
value of dose metric i when the predicted size reaches 50%; the slope at this point is −25 EC50,i/αi. Unequal residual variances
were taken into account by modeling the observed sizes as independent normally distributed variates:
σ
∼ E
Sizeijk Normal( (Size ),ijk jk2)
where σjk2is the residual variance of the predicted size for NP j
at concentration k. Values for σjk2 are issued from
within-treatment measurement error variances. Maximum-likelihood (ML) estimates are equivalent to least-squares (LS) regression estimates under the hypothesis of normally distributed residual errors. Consequently, ML estimates were computed by nonlinear weighted LS regression, in which case the regression weights are 1/σjk2. Three models were compared, one per dose
metric, and their performances were evaluated via their R2and Akaike information criterion (AIC) values, where larger R2and smaller AIC are considered better. The evidence ratio, given by exp[(AICi − AICj)/2], where AICi and AICj are the AIC
estimates for dose metrics i and j, indicates how much more likely dose metric j is than dose metric i to be the best predictor for growth inhibition given the set of the three dose metrics and the data. Statistical computations were carried out in R.17
The dose metrics were also measured with errors. Con-sequently, the data had to be fitted using nonlinear weighted LS errors-in-variables regression, which requires advanced statistical procedures. This was implemented as a hierarchical Bayesian model (HBM), which is presented in theSupporting Information.
The different doses of C-NPs to which Xenopus larvae were exposed and the comparisons between the metrics are summarized inTable 1. The detailed procedures and methods used to obtain these different metrics are provided in the
Supporting Information together with the physicochemical characterizations of the C-NPs.
Statistically significant growth inhibition was evidenced after a 12 day exposure to C-NPs. At first sight and on the basis of mass concentrations, growth inhibition seemed to strongly Figure 1.Transmission electron microscopy micrographs of (a) DWCNTs, (b) MWCNTs, (c) NDs, and (d) FLG.
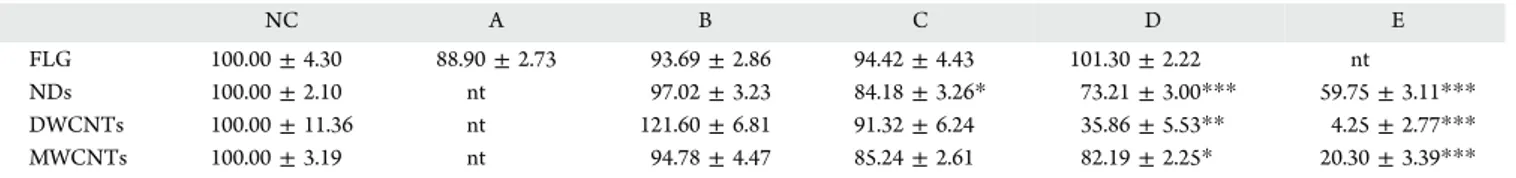
depend on the type of C-NPs (Table 2). Compared with the negative control group, a significantly smaller size of larvae was observed after a 12 day exposure to NDs at 1 mg L−1(dose C). Similar results were obtained for larvae exposed to DWCNTs and MWCNTs at 10 mg L−1 (dose D). Finally, no growth inhibition in larvae was observed after FLG exposure, whatever the tested dose. If a conventional analysis of these results with a comparison based on mass concentration was used, the con-clusion would be that the DWCNTs are the most toxic C-NPs since they cause the strongest growth inhibition (Table 2and
Figure 2). The C-NP toxicity would have been sorted as follows: FLG < NDs < MWCNTs < DWCNTs.
However, as NPs behave differently from classical chemicals, the “traditional” approaches with mass concentrations could lead to misinterpretations. On the basis of studies from aerial toxicology with nanoparticles, a new approach was tried in order to “move beyond mass”.7 With the aim of finding the most relevant metric to compare the growth inhibition, the standardized lengths of X. laevis larvae were expressed against “nonclassical” metrics. Data were plotted versus number of particles per unit volume and the surface area per unit volume. Detailed procedures for calculation of these two metrics are given in theSupporting Informationsection. Briefly, the number of particles was calculated using simple geometrical hypotheses specific to each kind of nanoparticle and not considering aggregation/agglomeration. The specific surface areas (SSAs) of the C-NPs18,19 were obtained experimentally using the Brunauer−Emmett−Teller (BET) method (N2adsorption).
Nonlinear two-parameter logistic regressions were applied to the growth data using each of the three different dose metrics as a predictor (Figure 2). Goodness of fit values using the three dose metrics were evaluated with R2and statistically compared by model selection using the AIC values. Expressing the length data versus the number of particles led to a poor fit (R2= 0.57). The fit was improved using mass concentration (R2= 0.63) and was best using the surface area (R2= 0.88). Similarly, model selection strongly favored surface area (AIC = 673.7) with respect to mass concentration (AIC = 691.2) or number of particles (AIC = 695.7). Consequently, models using either mass concentration or number of particles were omitted from further consideration and were 6311 and 59 874 times less probable, respectively, than the model using surface area to be the most concordant descriptor for growth inhibition.
Interestingly, growth inhibition did not depend on the allotropic form of carbon but seemed to mostly depend on the surface area of C-NPs. Furthermore, the conclusion obtained when the size of the animals was expressed as a function of the C-NP surface area was different from that obtained using mass concentration. The use of surface area concentration showed that the different nanoparticles could be considered as a single type of C-NPs. Moreover, the global area concentration for which a growth inhibition of 50% (EC50) was obtained could be estimated and was found to be 7.47 m2·L−1(95% CI = 4.64− 12.62 m2·L−1).
The growth inhibition mechanism appeared to mostly depend on the surface area of the C-NPs, which can be explained by several hypotheses. Exposure by ingestion was ascertained, and nanoparticles could enter the digestive tract. Guts filled with “black material” were observed for all of the exposed larvae compared with the controls. Furthermore, in earlier studies DWCNTs and MWCNTs were evidenced in the intestine lumen by Raman spectroscopy analysis, high-resolution trans-mission electron microscopy, or microwave permittivity
Table 1. Corresponding Metrics for Each Dose (A − E) of Nanoparticles to Which X. laevis Larvae Were Exposed mass concentration (mg L − 1) number of particles (L − 1) surface concentration (m 2L − 1) C-NP A B C D E A B C D E A B C D E FLG 1.00 × 10 − 2 1.00 × 10 − 1 1.00 × 10 0 1.00 × 10 1 nt 6.14 × 10 5 6.14 × 10 6 6.14 × 10 7 6.14 × 10 8 nt 1.00 × 10 − 4 1.00 × 10 − 3 1.00 × 10 − 2 1.00 × 10 − 1 nt NDs nt 1.00 × 10 − 1 1.00 × 10 0 1.00 × 10 1 5.00 × 10 1 nt 2.61 × 10 10 2.61 × 10 11 2.61 × 10 12 1.31 × 10 13 nt 2.10 × 10 − 2 2.10 × 10 − 1 2.10 × 10 0 1.05 × 10 1 DWCNTs nt 1.00 × 10 − 1 1.00 × 10 0 1.00 × 10 1 5.00 × 10 1 nt 1.21 × 10 9 1.21 × 10 10 1.21 × 10 11 3.03 × 10 12 nt 9.80 × 10 − 2 9.80 × 10 − 1 9.80 × 10 0 4.90 × 10 1 MWCNTs nt 1.00 × 10 − 1 1.00 × 10 0 1.00 × 10 1 5.00 × 10 1 nt 1.79 × 10 7 1.79 × 10 8 1.79 × 10 9 8.93 × 10 9 nt 2.35 × 10 − 2 2.35 × 10 − 1 2.35 × 10 0 1.18 × 10 1
measurements.12,15,20The presence of C-NPs in the digestive tract could therefore limit the exchange surfaces between the gut lumen and the internal wall, leading to a decrease in absorption of nutrients. Similarly, macro observations revealed the presence of “black material” in the branchial baskets. In X. laevis larvae, buccopharyngeal surfaces have a dual function: they serve in both food particle entrapment21,22and breathing. If these surfaces become coated with C-NPs, the efficiency of food intake could be reduced. Finally, C-NPs could interact with all of the external respiratory surfaces of X. laevis larvae and may withdraw oxygen from buccopharyngeal respiratory surfaces, skin, or lungs. When aquatic respiratory surfaces are saturated with C-NPs, the absorption of oxygen could be reduced. If the aquatic gas exchangers are not suf-ficient to extract oxygen from water, the larvae could use its lungs to complete the oxygen supply.23This aerial respiration has an energetic cost that could lead to reduced growth.24These two mechanisms may also interact and be jointly responsible for the size reduction of exposed animals.
The results and the hypotheses that were made are specific to the particular mode of exposure used (i.e., raw nanoparticles without any dispersant, semistatic exposure, and reconstituted water under normalized conditions). It is important to note that even with different C-NP physicochemical characteristics (i.e., structure and morphology), growth inhibition mostly depends on the surface area. Finally, it is important to note that the toxic effects with C-NPs were observed at nonenviron-mentally realistic doses.25However, the computed effective area concentration (EC50= 7.47 m2·L−1) showed that in the case of
high-surface-area NPs we could evidence growth inhibition at lower mass concentrations. For example, in the case of “perfect” graphene with a theoretical specific surface area of 2630 m2·g−1, the predicted mass concentration EC50would be 2.8 mg·L−1.
The next step will be to test a new panel of C-NPs (e.g., oxidized) in order to corroborate the model of growth inhi-bition. The adequacy or inadequacy of the inhibition model would be fruitful and will provide key information to under-stand the role of surface chemistry but also intrinsic properties of each NP (atomic composition, dispersibility) in their degrees of toxicity.
This study shows that the usual approach based on mass con-centrations fails to compare the toxicities of different C-NPs. Apart from papers on aerial nanotoxicology,6,8,26−29 most of
published data in nanoecotoxicology are based on mass concentration, and the provided physicochemical characteri-zation is not enough to express the results versus surface area concentration. A full characterization of engineered C-NPs must be provided in every ecotoxicological study in order to allow the toxicity comparison of C-NPs, which should be done on the basis of surface area concentration when it is relevant. The use of this metric would help in the definition of a more realistic risk assessment strategy for carbon-based nanoparticles in the aquatic environment.
■
ASSOCIATED CONTENT*
S Supporting InformationThe Supporting Information is available free of charge on theACS Publications websiteat DOI:10.1021/acs.nanolett.6b00348. Table 2. Growth in X. laevis Larvae Exposed to the Different C-NPsa
NC A B C D E
FLG 100.00 ± 4.30 88.90 ± 2.73 93.69 ± 2.86 94.42 ± 4.43 101.30 ± 2.22 nt
NDs 100.00 ± 2.10 nt 97.02 ± 3.23 84.18 ± 3.26* 73.21 ± 3.00*** 59.75 ± 3.11*** DWCNTs 100.00 ± 11.36 nt 121.60 ± 6.81 91.32 ± 6.24 35.86 ± 5.53** 4.25 ± 2.77*** MWCNTs 100.00 ± 3.19 nt 94.78 ± 4.47 85.24 ± 2.61 82.19 ± 2.25* 20.30 ± 3.39***
aResults are given as the normalized mean (%) ± Standard Error of the Mean (SEM). "*" corresponds to a significantly different size of larvae
compared to the negative control group (mean value) for p ≤ 0.05; "**" corresponds to a significantly different size of larvae compared to the negative control group (mean value) for p ≤ 0.01; "***" corresponds to a significantly different size of larvae compared to the negative control group (mean value) for p ≤ 0.001. NC = negative control; each letter from A to E corresponds to a different concentration of C-NPs.
Figure 2.Growth inhibition in X. laevis larvae after a 12 day exposure to FLG, NDs, DWCNTs, and MWCNTs. Normalized size (%) is plotted vs the base-10 logarithms of three different metrics: mass concentration (mg·L−1), number concentration (L−1), and surface area concentration
(m2·L−1). Black dashed lines represent nonlinear regression model predictions, and shaded areas are 95% confidence intervals (CIs) on these.
Nanoparticle features, nanoparticle dispersion protocols, protocols for contamination of the exposure media, calculation of particle number and total surface area, and hierarchical Bayesian modeling of errors-in-variables regression (PDF)
■
AUTHOR INFORMATIONCorresponding Author
*E-mail: fl[email protected].
Notes
The authors declare no competing financial interest.
■
ACKNOWLEDGMENTSThe research leading to these results has received funding from the European Union Seventh Framework Programme under grant agreement n°604391 Graphene Flagship.
■
ABBREVIATIONSAIC, Akaike information criterion; BET, Brunauer−Emmett− Teller; C-NPs, carbon-based nanoparticles; CNTs, carbon nanotubes; DWCNTs, double-walled carbon nanotubes; FLG, few-layer graphene; HBM, hierarchical Bayesian model; HCG, human chorionic gonadotropin; LS, least-squares; ML, maximum-likelihood; MWCNTs, multiwalled carbon nanotubes; NDs, nanodiamonds; NPs, nanoparticles; PMSG, pregnant mare’s serum gonadotropin; SSA, specific surface area
■
REFERENCES(1) Novoselov, K. S.; Geim, A. K.; Morozov, S. V.; Jiang, D.; Zhang, Y.; Dubonos, S. V.; Grigorieva, I. V.; Firsov, A. A. Science 2004, 306, 666−669.
(2) Danilenko, V. V. Phys. Solid State 2004, 46, 595−599. (3) Iijima, S. Nature 1991, 354, 56−58.
(4) El-Sayed, M. A. Acc. Chem. Res. 2004, 37, 326−333.
(5) Auffan, M.; Rose, J.; Bottero, J.-Y.; Lowry, G. V.; Jolivet, J.-P.; Wiesner, M. R. Nat. Nanotechnol. 2009, 4, 634−641.
(6) Oberdörster, G.; Oberdörster, E.; Oberdörster, J. Environ. Health
Perspect. 2005, 113, 823−839.
(7) Hull, M.; Kennedy, A. J.; Detzel, C.; Vikesland, P.; Chappell, M. A. Environ. Sci. Technol. 2012, 46, 10881−10882.
(8) Stoeger, T.; Reinhard, C.; Takenaka, S.; Schroeppel, A.; Karg, E.; Ritter, B.; Heyder, J.; Schulz, H. Environ. Health Perspect. 2006, 114, 328−333.
(9) ISO/FDIS 21427-1. Water QualityEvaluation of Genotoxicity by
Measurement of the Induction of MicronucleiPart 1: Evaluation of Genotoxicity Using Amphibian Larvae; International Organization for
Standardization: Geneva, 2006.
(10) Gauthier, L. Alytes 1996, 14, 53−84.
(11) Bour, A.; Mouchet, F.; Verneuil, L.; Evariste, L.; Silvestre, J.; Pinelli, E.; Gauthier, L. Chemosphere 2015, 120, 230−236.
(12) Mouchet, F.; Landois, P.; Sarremejean, E.; Bernard, G.; Puech, P.; Pinelli, E.; Flahaut, E.; Gauthier, L. Aquat. Toxicol. 2008, 87, 127− 137.
(13) Mouchet, F.; Landois, P.; Datsyuk, V.; Puech, P.; Pinelli, E.; Flahaut, E.; Gauthier, L. Environ. Toxicol. 2011, 26, 136−145.
(14) Bourdiol, F.; Mouchet, F.; Perrault, A.; Fourquaux, I.; Datas, L.; Gancet, C.; Boutonnet, J.-C.; Pinelli, E.; Gauthier, L.; Flahaut, E.
Carbon 2013, 54, 175−191.
(15) Mouchet, F.; Landois, P.; Puech, P.; Pinelli, E.; Flahaut, E.; Gauthier, L. Nanomedicine 2010, 5, 963−974.
(16) Normal Table of Xenopus laevis (Daudin): A Systematical and
Chronological Survey of the Development from the Fertilized Egg till the End of Metamorphosis; Nieuwkoop, P., Faber, J., Eds.; North Holland:
Amsterdam, 1956.
(17) R Development Core Team. R: A Language and Environment for
Statistical Computing; R Foundation for Statistical Computing: Vienna,
Austria, 2015.
(18) Peigney, A.; Laurent, C.; Flahaut, E.; Bacsa, R. R.; Rousset, A.
Carbon 2001, 39, 507−514.
(19) Laurent, C.; Flahaut, E.; Peigney, A. Carbon 2010, 48, 2994− 2996.
(20) Bourdiol, F.; Dubuc, D.; Grenier, K.; Mouchet, F.; Gauthier, L.; Flahaut, E. Carbon 2015, 81, 535−545.
(21) Gradwell, N. Acta Zool. 1975, 56, 119−128.
(22) Feder, M. E.; Seale, D. B.; Borass, M. E.; Wassersug, R. J.; Gibbs, A. G. J. Exp. Biol. 1984, 110, 91−98.
(23) Feder, M. E.; Wassersug, R. J. J. Exp. Biol. 1984, 108, 231−245. (24) Pandian, T. J.; Vivekanandan, E. Hydrobiologia 1976, 49, 33−39. (25) Sun, T. Y.; Gottschalk, F.; Hungerbühler, K.; Nowack, B.
Environ. Pollut. 2014, 185, 69−76.
(26) Sager, T. M.; Castranova, V. Part. Fibre Toxicol. 2009, 6, 15. (27) Donaldson, K.; Stone, V. Ann. Ist. Super. Sanita 2003, 39, 405− 410.
(28) Duffin, R.; Tran, L.; Brown, D.; Stone, V.; Donaldson, K.
Inhalation Toxicol. 2007, 19, 849−856.
(29) Duffin, R.; Tran, C. L.; Clouter, A.; Brown, D. M.; MacNee, W.; Stone, V.; Donaldson, K. Ann. Occup. Hyg. 2002, 46, 242−245.