L'ECOLOGIE DU COMPORTEMENT ALIMENTAIRE ET LA
SOCIALITE CHEZ LE MOUFLON D'AMEMQUE, QYIS CANADENSIS
par
Kathreen Eva Ruckstuhl
these presentee au Departement de biologie
en vue de 1'obtention du grade de docteur es sciences (Ph.D.).
FACULTE DES SCIENCES
UNIVERSITE DE SHERBROOKE
1*1
National Library of Canada Acquisitions and Bibliographic Services 395 Wellington Street Ottawa ON K1AON4 Canada Bibliotheque nationale du Canada Acquisitions et services bibliographiques 395, rue Wellington Ottawa ON K1AON4 CanadaYour file Votre reference
Our file Nolre reference
The author has granted a
non-exclusive licence allowing the
National Library of Canada to
reproduce, loan, distribute or sell
copies of this thesis in microform,
paper or electronic formats.
The author retains ownership of the
copyright in this thesis. Neither the
thesis nor substantial extracts from it
may be printed or otherwise
reproduced without the author's
permission.L'auteur a accorde une licence non
exclusive pemiettant a la
Bibliofheque nationale du Canada de
reproduire, preter, distribuer ou
vendre des copies de cette these sous
la fomie de microfiche/film, de
reproduction sur papier ou sur format
electronique.
L'auteur conserve la propriete du
droit d'auteur qui protege cette these.
Ni la these m des extraits substantiels
de celle-ci ne doivent etre imprimes
ou autrement reproduits sans son
autonsation.
Le
/
/M_L
Tf , Ie jury suivant a accepte cette these c^ns sa version finaledate
President-rapporteur: M. Bill Shipley
Departement de biologie
Membre: Membre: Membre externe: M. Marco Festa-Bianchet Departement de biologie M. Jean-Marie Bergeron Departement de biologie M. Robert Hudson Universite d'Alberta^o ^lL fil:.-^^
z
SOMMAIRE
Cette these compare Ie comportement alimentaire et la socialite d'une population marquee de mouflons d'Amerique en fonction de la taille, de 1'age et du statut reproducteur des individus. Elle decrit aussi, les effets de brulis localises sur la disponibilite et la qualite des ressources trophiques, ainsi que leur consequence sur Ie comportement alimentaire des mouflons.
Le premier chapitre presente Ie site d'etude et les methodes utilisees pour mesurer Ie comportement alimentaire des mouflons. Dans Ie deuxieme chapitre, je teste 1'hypothese selon laquelle Ie dimorphisme sexuel serait a 1'origine de la difference de comportement alimentaire entre males et femelles. Les femelles consacrent plus de temps a leur alimentation et sont plus mobiles que les males adultes. Les males subadultes, plus petits que les males adultes mais plus gros que les femelles, ont un comportement intermediaire. Ces differences de comportement - temps alloue a 1'approvisionnement et frequence de deplacements - pourraient avoir pour consequence la formation de groupes de males et de femelles distincts. Elles pourraient done etre une cause proximale de la segregation sexuelle chez les ovins, et plus generalement chez les ruminants vivant en
groupes.
La synchronisation des comportements est indispensable a la cohesion du groupe. Le troisieme chapitre etudie comment les individus appartenant a di verses classes d'age et de sexe ajustent leur comportement en fonction du comportement des autres membres du groupe. Prise isolement, la mesure des temps alloues aux differentes activites nous en dit peu sur la synchronisation des comportements au sein du groupe. Meme si les individus consacrent un temps identique a chaque activite, des activites specifiques, comme Ie brout ou Ie repos, ne se produisent pas necessairement au meme moment. J'ai, par
consequent, calcule un indice de synchronisation prenant en compte les similarites entre 1'activite d'un individu donne et celle des autres membres du groupe, sur des intervalles d'une minute. Cet indice correspond au pourcentage de temps durant lequel 1'individu a une activite equivalente a celle de la majorite des individus du groupe. Pour evaluer dans quelle mesure un individu est synchrone avec les autres membres du groupe, j'ai d'abord montre qu'un individu dont les activites sont aleatoires a en moyenne la meme activite que la majorite des individus du groupe, 50 % du temps. Pour comparer Ie niveau de synchronisation dans les differents groupes d'age et de sexe, j'ai utilise la moyenne des indices de synchronisation de chaque individu du groupe.
La synchronisation etait tres elevee dans les groupes de males adultes, ainsi que dans les groupes de femelles accompagnees de leurs jeunes. Les groupes mixtes, comportant des individus de tous ages et sexes, etaient mains synchrones. J'ai alors calcule 1'indice de synchronisation de chaque individu dans les differents types de groupes. Pour les groupes de femelles suitees et les groupes de males, 1'indice de synchronisation etait eleve. Par centre, pour les males subadultes, cet indice variait en fonction de leur age et du type de groupe auquel ils appartenaient. C'est au sein des groupes de males adultes, que les males de 3 ans etaient les plus synchrones; ils 1'etaient moins dans les groupes de femelles et moins encore dans les groupes mixtes (d'age et de sexe differents). Par centre, la synchronisation des males de 2 ans ne variait pas selon Ie type de groupe, quel que soit Ie groupe dans lequel ils etaient observes. J'en ai par consequent, conclu que les males de 2 ans ne seraient pas capables d'adopter une repartition optimale de leurs activites, quel que soit Ie type de groupe, ce qui semble indiquer qu'il leur aurait ete benefique de former un groupe entre eux, s'ils avaient ete en nombre suffisant. Cependant, je n'ai jamais observe de groupe de males de 2 ans, probablement du fait de leur nombre insuffisant (< 4) durant les annees de mon etude.
Le quatrieme chapitre examine les effets du statut reproducteur et du sexe desjeunes sur Ie comportement alimentaire des femelles. J'ai suppose que les femelles allaitantes passeraient plus de temps a se nourrir et auraient une frequence de prise alimentaire superieure a celle des femelles non allaitantes, parce que la lactation augmente les depenses energetiques et par consequent, les besoins alimentaires. Contrairement a mes suppositions, Ie statut reproducteur (femelles allaitantes ou non) n'affectait ni Ie temps passe a 1'approvisionnement ni la frequence des prises alimentaires au printemps ou en ete. Les femelles allaitantes ont passe plus de temps a se nourrir en automne, une fois leurs jeunes sevres. II y a une limite a la quantite de fourrage que peut ingerer un ruminant, et il est probable que toutes les femelles aient atteint cette limite au printemps et en 6te. Le sexe des agneaux ne semble pas affecter Ie comportement alimentaire des femelles allaitantes. L'investissement matemel est peut-etre superieur pour les agneaux males, mais les femelles n'ont pas compense cette depense d'energie en augmentant leur ration alimentaire.
Le cinquieme chapitre etudie les effets produits par des briilis localises sur la
disponibilite et la quantite de fourrages, ainsi que leur consequence sur Ie comportement alimentaire des mouflons. Nous avons brule 3 zones distinctes de prairie entre 1995 et
1997. Les brulis etaient supposes accroitre la biomasse et la qualite de la repousse. Le contenu proteique des repousses sur les zones brulees en avril etait beaucoup plus eleve que celui des zones de controle de mai ajuin, sur 1'ensemble des 3 zones. Les mouflons se sont nourris preferentiellement sur les zones de brulis, mais seulement 1'annee du brulis, et les taux de proteines ont deem et sont redevenus equivalents aux taux de 1'annee precedente et a ceux des zones de controle lors du printemps suivant. Les bmlis n'ont alors qu'un effet a court terme, mais utilises de fa9on repetitive, ils pourraient representer un outil de gestion peu couteux.
SUMMARY
This thesis compares foraging behaviour and sociality of individually marked Rocky
Mountain bighom sheep according to body size, age and reproductive status.
Additionally, it describes the effects of prescribed grassland bums on forage availability,
quality and bighom sheep use.
The first chapter presents the study site and the methods used to measure foraging behaviour. In the second chapter I tested the hypothesis that males and females differ in their foraging behaviour due to dimorphism in body size. Females spent more time foraging and had a higher movement rate than adult males. Subadult males, that are smaller than adult males but larger than adult females, adopted an intermediate foraging behaviour. Differences in foraging time budgets and movement rates may lead to the formation of male and female groups and could therefore be the proximate cause of sexual segregation in sheep and in social ruminants in general.
Synchronization of behaviour is essential for group cohesion. The third chapter investigates how individuals of different age-sex classes adjust their behaviour to that of other group members. Activity budget measures alone tell us little about the synchronization of activities within a group of animals. Even if the percentage of time spent in different activities is similar, specific behaviours such as grazing or lying may be carried out at different times. I therefore calculated a synchronization index where each individual's activity was compared to the activity of the other group members each minute. This synchronization index measures the percentage of time when a focal animal had the same activity as the majority of other group members. Bighom sheep formed five different types of groups: all-adult male groups, male groups with subadult males, mixed groups of all ages and sexes, adult female groups with subadults of both sexes,
and female nursery groups with yearlings of both sexes. To test whether an individual
could be synchronized with other individuals in its group even if it behaved randomly, I
first established that individuals with random activities had on average the same activity
as the majority of group members 50 % of the time. To compare the level of synchronization for different age-sex groups, I used the average synchronization indices for individual sheep observed in those groups. Sheep in adult male and nursery groups were highly synchronized. Mixed groups including all age-sex classes were the least synchronized. I then calculated the synchronization index of each individual in different types of groups. Females were highly synchronized in nursery groups, as were adult males in bachelor groups. Subadult males showed different synchronization indices depending on their age and on the group type they were in. Three-year-old males were most synchronized with members of adult male groups, less with adult female groups and least with members of mixed age-sex groups, while 2-year-old males synchronized their behaviour to that of other group members independently of the type of group they were in. I therefore concluded that 2-year-old males may not behave according to their
optimal activity budget in all group types, suggesting that if sufficiently numerous they
would probably be advantaged by forming a group of their own. I never observed a group of2-year-olds, possibly because there were never more than four 2-year-old males per year in the population during my study.
The fourth chapter considers the effects of reproductive status and lamb gender on the foraging behaviour of female bighoms. I expected that lactating females would spend more time foraging and have a higher bite rate than non-lactating females because lactation increases energy demands and therefore the need for food. Contrary to my expectations, there was no difference in foraging time budgets or bite rates according to reproductive status in spring or summer. Lactating females spent more time foraging in autumn, at the time when young are weaned. There is an upper limit to how much forage a mminant can consume and possibly all females were grazing at that limit during spring
and summer. Lamb gender did not affect foraging behaviour of lactating females. Females may invest more energy in their sons, but they did not compensate for higher energy expenditure through increased forage intake.
The fifth chapter examines the effects of prescribed grassland bums on the availability
and quality of forage and on bighom sheep use. We burned three different grassland sites from 1995 to 1997. Burning was expected to increase live vegetation biomass and quality of new emerging forage. Protein content of vegetation growing on sites burned in April was much higher than on control plots from May to June for all three bums. Sheep preferred to forage on bums compared to controls, but only in the year of burning. Biomass of live vegetation was higher in the year of burning, but protein levels decreased to pre-bum and control levels by the next spring. Burning grassland has only a very short-term effect, but it could be used as an inexpensive management tool when applied repeatedly.
ACKNOWLEDGEMENTS
I am first and foremost deeply grateful to my supervisor, Professor Marco Festa-Bianchet for accepting me as his student. He supported and believed in me, provided
inspiration and help through all stages of this project, but also gave me the liberty to plan
and carry out this work on my own. I also wish to thank my supervisory committee, Dr. Bill Shipley and Dr. Don Thomas for their support. I thank F. Boulanger, D. Heynen, R. Fankhauser, C. Schiitz, S. Rebel, J. Roberge, A. Luscher, A. Hammerli for assistance in the field, J. Jorgenson, J. Ross and J. Hogg for sheep captures, K. Livingston, B. Wuth (fire specialists, Rocky Mountain House), K. Orich and his crew (Forestry department, Turner Valley) for the prescribed burning, G. Pomerleau, C. Beaudoin, L.-M. Theriault, and B. Mercier for laboratory analyses. I also greatly thank Bemhard Fluckiger for writing the computer programs, and the University of Calgary, especially Dr. Ed Johnson for letting me stay at the R. B. Miller Biological Research Station, Alberta. Thanks to Judy Buchanan-Mappin for equipment, great barbecues and soccer games. Thanks to Dr. Jan Murie, Ron Bennett, Peter Neuhaus, Anne Hubbs and their assistants for sheep sightings, animated discussions, tasty cooking and lots of fun. Thanks to all the people in the ecology lab in Sherbrooke, especially Anne Genier, Driss Meziane for their fhendship. A special thanks to Laurence and Denis Reale for their help with the French summary. Last but certainly not least, I thank Peter Neuhaus, my family and all my other fhends for their encouragement and their interest in my work. Financial support was
provided by a Challenge Grant in Biodiversity granted by the University of Alberta,
Department of Biological Sciences and financed through the Alberta Department of
Environmental Protection, Fish and Wildlife Tmst Fund to myself, the Alberta Sports,
Recreation, Parks and Wildlife Foundation, Alberta Conservation Association and the Natural Sciences and Engineering Research Council of Canada.
TABLE OF CONTENTS
SOMMAIRE... ii
SUMMARY... v
ACKNOWLEDGEMENTS... vii
TABLE OF CONTENTS... ix
LIST OF TABLES... xii
LIST OF FIGURES... xv
GENERAL INTRODUCTION... 1
CHAPTER 1-STUDY AREAAND METHODS... 13
1.1 Study area... 13
1.2 Methods... 15
CHAPTER 2- FORAGING BEHAVIOUR AND SEXUAL SEGREGATION IN
BIGHORN SHEEP... 182.1 Introduction... 18
2.2 Methods... 22
2.3 Data analysis... 24
2.4 Results... 25
2.4.1 Time spent grazing or lying and mean duration of activity bouts for adults... 25
2.4.2 Effects of group type on foraging behaviour in young males... 25
2.4.3 Movement patterns and sheep locations... 26
2.5.1 Differences in time budgets. ... 30
2.5.2 Differences in time spent walking, step rates and movement. ... 33
2.5.3 A new approach to sexual segregation... 35
CHAPTER 3- SYNCHRONIZATION OF ACTWITIES IN ROCKY
MOUNTABSfBIGHORN SHEEP... 373.1 Introduction... 37
3.2 Study area, animals and methods... 40
3.3 Data analysis... 41
3.4 Results... 45
3.4.1 Simulation of activity budgets and synchronization... 45
3.4.2 Synchronization according to group type, month and reproductive status... 45
3.5 Discussion... 48
CHAPTER 4- DO REPRODUCTIVE STATUS AND LAMB GENDER AFFECT THE
FORAGESfG BEHAVIOUR OF BIGHORN SHEEP?... 544.1 Introduction... 54
4.2 Methods... 57
4.3 Results... 60
4.3.1 Differences in foraging behaviour between ewes with and without lambs... 60
4.3.2 Effects oflactation on mass gain... 62
4.3.3 Differences in foraging behaviour according to lamb sex... 62
4.3.4 Migration dates for pregnant and barren ewes... 63
CHAPTER 5- EFFECTS OF PRESCRIBED GRASSLAND BURNS ON FORAGE
AVAILABILITY, QUALITY, AND BIGHORN SHEEP USE... 71
5.1 Introduction... 71
5.2 Study area and bighom sheep... 73
5.3 Methods and statistical analyses. ... 73
5.3.1 The bums... 73
5.3.2 Forage quality and quantity. ... 74
5.3.3 Sheep use... 74
5.3.4 Foraging behaviour... 75
5.4 Results... 76
5.4.1 Effects of burning on forage protein content and biomass... 76
5.4.2 Effects of burning on plot choice and foraging behaviour of sheep.. 78
5.5 Discussion... 92
CHAPTER 6- GENERAL DISCUSSION AND CONCLUSIONS... 96
LIST OF TABLES
CHAPTER 1
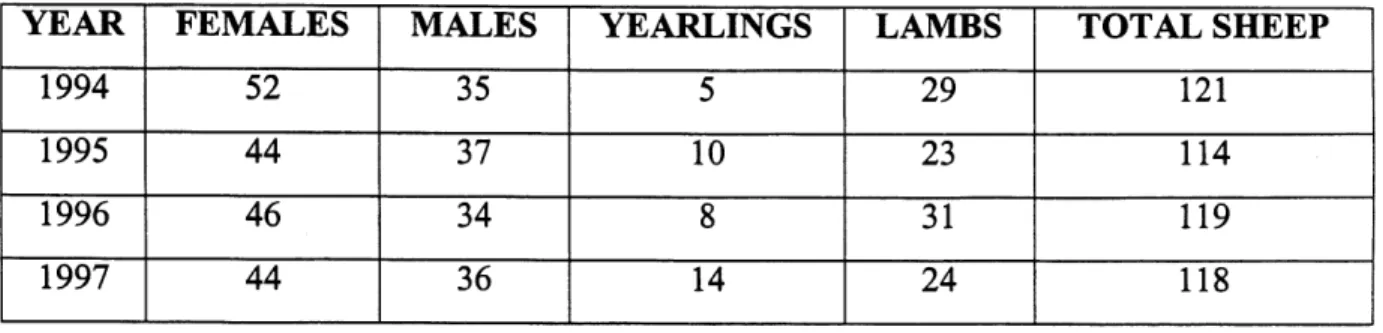
1.1 Number of adult males, adult females, yearlings and lambs of the Sheep River study population of bighom sheep in October, 1994 to 1997...15
CHAPTER 2
2.1 Mean (± SE) duration of grazing and lying bouts and per cent time spent
grazing and lying per observation period (8-14 h) for 2- and 3-year-old bighom sheep rams in ewe and in adult ram groups, and for adult ewes and
rams...26
2.2 Distances traveled (medians and interquartile ranges) in m/h by bighom
sheep ewe and ram groups observed from April to September
(1994-1996)...27
CHAPTER 3
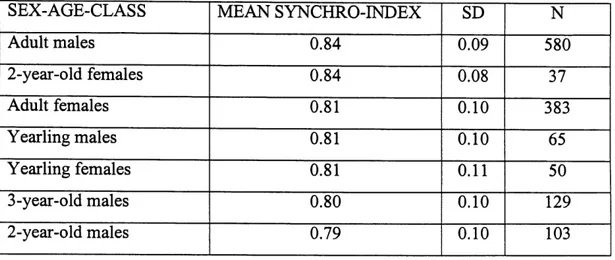
3.1 Synchronization indices for different age-sex classes ofbighom sheep in the Sheep River Wildlife Sanctuary. n= number of individual synchronization indices analyzed. Synchronization indices of adult males were significantly higher than for adult females or 3-year-old males,
3.2 Synchronization indices for different group types of bighom sheep. n= number of individual synchronization indices analyzed. Synchronization indices of all-adult male groups were significantly higher than for female groups with young males, or mixed groups, according to Scheffe post-hoc
test...47
CHAPTER 4
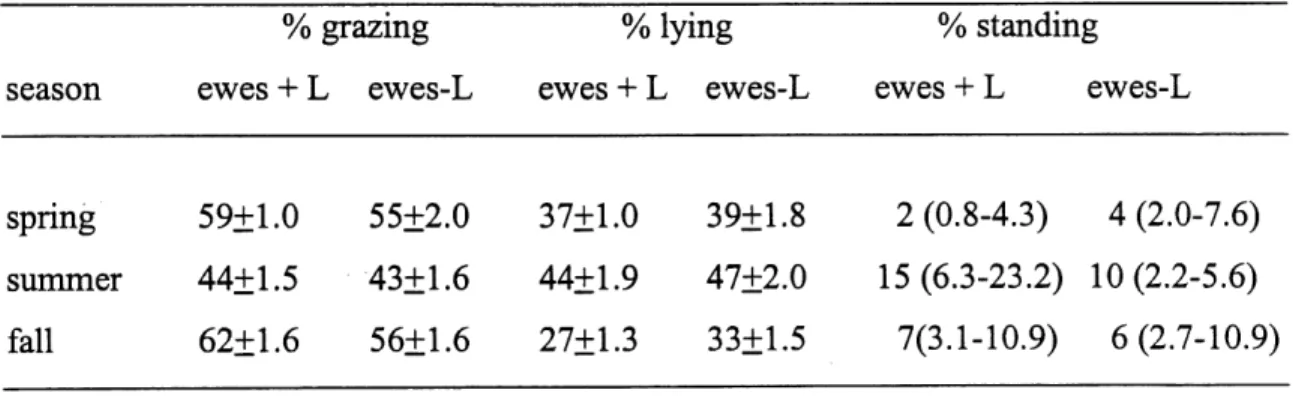
4.1 Percentage of time that bighom ewes with (+L) and without (-L) lambs
spent in different activities in different seasons. The number of observations in spring, summer and fall were 112, 38 and 83 for lactating
ewes and 39, 36 and 76 for non-lactating ewes... . ...63
4.2 Mass gain (g/day) by bighom ewes aged 4-10 years at Ram Mountain, Alberta. Sample size was 144 lactating and 32 non-lactating
ewes...64
4.3 Percent time spent foraging or lying and duration in minutes of
grazing/lying bouts in April - November for bighom ewes with daughters
or sons. Means ± SE...64
CHAPTER 5
5.1 Bighom sheep use of burned and control plots in the year before, the year of burning and one and two years later in the Sheep River Wildlife Sanctuary, Alberta, 1994 to 1997. Chi-square and p-values refer to the comparison of control and burned plots each month. Same = each sheep group seen used both the bum and the controls plots during observations;
not used = plot was not used by sheep; n. s. = no significant difference between the use of bums and controls, ^-values in brackets = use of bum higher than of controls. Normal % = use of control plots higher than of bums. Rows with locations, years and statistics in bold indicate year of
LIST OF FIGURES
CHAPTER 2
2.1 Mean (±SE) per cent time spent grazing by bighom ewes and rams during
8-14 h of observations. Months 4-9: April-September 1994-1996. Numbers of observations appear above each bar, each month. ** p<0.001, all pair-wise comparisons were made with Mann-Whitney U-tests. Adjusted
significance level was set at p=0.008...28
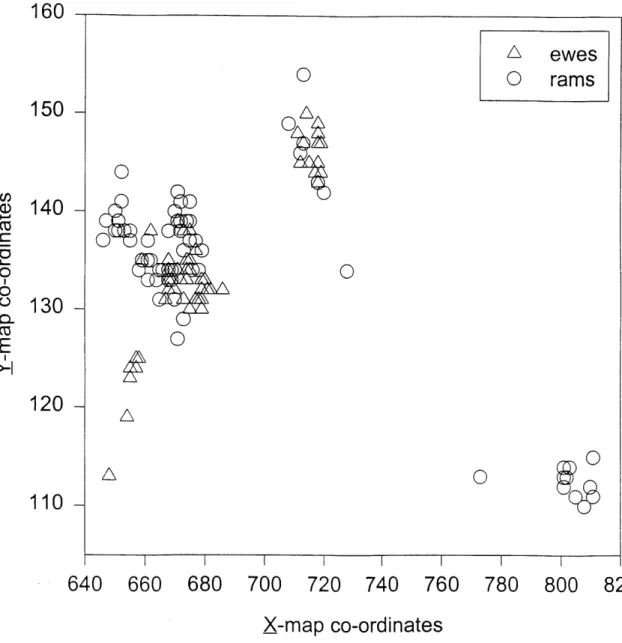
2.2 Locations of ewe (A) ram (0) groups during 143 time budget observations
collected April-September 1994-1996. X and Y-axes are map co-ordinates
.29
CHAPTER 4
4.1 Number of bites taken per minute by ewes with and without lambs in spring, summer and fall (1994-1996). Median, minimum, maximum, 1st and 3rd quartile. ns= not significantly different, -L= without lamb, +L= with lamb. Numbers above box plots are numbers of 10-minute
observations on bite rates...65
4.2 Number of alert postures in female bighom sheep in different months of the year. 4-9= April to September 1994-1996. Median, minimum, maximum, Irst and 3rd quartile. Number above box plots indicates
CHAPTER 5
5.1 Location of the bum and control sites in the Sheep River Wildlife
Sanctuary. 1 and 3= HP bum done in 1996, 2= HF control, 4 and 5=
MLFE control and bum done in 1995; hatched line = boundary of planned
bum. 6 and 7= WPE bum and control done in
1997...80
5.2 Percent cmde protein content of vegetation on three different sites in the Sheep River Wildlife Sanctuary in 1994. These sites were burned in
1995-1997. May to September. MLFE = Missing Link Mountain, WPE = Windy
Point, HF = Hayfield...81
5.3 Percent cmde protein of vegetation of control and bum plots on the MLFE
site from May to September 1995. This site was burned on 7 April
1995...82
5.4 Percent cmde protein of vegetation of control and bum plots on the HF site
from May to September 1996. This site was burned on 29 April
1996...83
5.5 Percent cmde protein of vegetation of control and bum plots on the MLFE site, one year post bum. Samples were taken from May to September
1996...84
5.6 Dry weight of vegetation clipped from 25 x 25 cm quadrats on MLFE bum
5.7 Dry weight of vegetation samples taken in 1996 on burned and unbumed
plots...86
5.8 Dead vegetation clipped on burned and unbumed plots on the MLFE site
from May to September 1995 (bum year)...87
5.9 Live vegetation available on burned and unbumed plots from May to
September 1995 (bum year)...88
5.10 Sheep use ofMLFE bum and control plots one year before, the year of the
bum and the 2 years after the bum (1994-1997). The MLFE site was
burned 7 April 1995...89
5.11 Sheep use of the HF bum and control plots two and one years before the
bum, the year of the bum and the year after the bum (1994-1997). The HF
site was burned 29 April 1996...90
5.12 Sheep use of burned and unbumed plots on the WPE site three to one years
GENERAL INTRODUCTION
The evolution of sociality: why do animals live in groups?
One of the most studied topics in animal behaviour is why animals live in groups. The
study of factors that lead individuals to aggregate and of why they form different types
of groups is central to an understanding of the evolution of sociality. The causes of sexual segregation in many ungulate species, for example, are still poorly understood despite intense research. It is therefore important to study the different factors that could cause animals to aggregate or separate into different group types. Foraging behaviour is one of the most important aspects of an animal's life, because food is needed to survive,
grow, build up body reserves and to reproduce (White 1983; Robbins 1993). It is a
well-established fact that the availability and distribution of food resources has a profound influence on sociality and group structure in different animal species (Jarman 1974). If food is clumped or rare and territories defendable, animals normally are solitary (Wrangham and Rubenstein 1986). If food is not defendable, animals can benefit from being social, because the chances of finding food can be higher in a group, or groups may hunt larger prey than solitary individuals (Krebs and Davies 1993). For most ungulates, food is not likely to be defended because it is often not spatially clumped and
therefore not worth the effort of defending it against conspecifics (Jarman 1974).
Gregariousness can reduce predation risk, increase foraging rate and facilitate mating but it may also increase intraspecific aggression, competition for food or for mating opportunities, and risks of parasite transmission (Hamilton 1971; Ward and Zahavi
1973; Rubenstein 1978; Bertram 1980; Turner and Pitcher 1986; Wrangham and
Rubenstein 1986; Dehn 1990; Wrona and Dixon 1991; Heard 1992; Mooring and Hart
1994; Cote and Poulin 1995). Therefore, group living can have potential benefits as well
as costs. In the next two sections I will briefly discuss the most common advantages and disadvantages ofgregariousness.
Advantages of group living
Gregariousness can reduce predation risks through dilution and enhanced predator
detection effects (Dehn 1990). The dilution effect was first described by Hamilton
(1971), who showed that when animals form groups the chance for each individual of being the one attacked by a predator is smaller, because there are other individuals as potential prey close to it. Each animal scans the environment to detect predators. Several animals together are more efficient than a single individual in detecting a predator before attack. In the safety of a group animals spend more time foraging than when solitary because they spend less time vigilant ((starlings {Sturnus vulgaris) (Jennings and Evans
1980), ostriches (Struthio camelus) (Bertram 1980), bighom sheep (Berger 1978),
domestic sheep (Penning et al. 1993), mountain goats (Oreamnos americanus)
(Risenhoover and Bailey 1985b)).
Ward and Zahavi (1973) hypothesized that roosting or communal nesting birds could
profit from other group members that serve as "information centers". According to this hypothesis, a hungry bird that was unsuccessful in finding food could follow a successful bird to the feeding site, therefore profiting from the other bird's knowledge of
where to find food. The well fed bird doesn't profit from being followed (except possibly
for dilution effects), but some days later it could use the same tactic, when it is hungry itself. Grazing in herds can be beneficial, if intake on grazed patches is higher than on
Protection from parasites was only recently argued to have an effect on host social behaviour. Studies provide quantitative evidence that grouping frequently, but not always, reduces per capita fly attacks through the dilution effect, provided that the
probability of detection of the group by the parasites does not increase with group size
(Mooring and Hart 1992). In caribou (Rangifer tarandus), where aggregations during
calving can be advantageous under predation pressure, later-season grouping could occur because of mosquitoes and biting flies (Mooring and Hart 1992). Allo-grooming of group members could also reduce individual ecto-parasite loads (Mooring and Hart
1995).
1.1.2 Disadvantages of group living
We often find that the same factors which favor gregariousness under certain circumstances can be a disadvantage for certain group members. Intraspecific competition for food can be an important disadvantage of sociality for subordinates: (Barnard 1980) showed that most members of a flock of disturbed sparrows (Passer domesticus) left the feeding site. The remaining birds were poor competitors which accepted the higher risks of predation to feed without the pressure of competition.
Milinski (1992) found that if given the choice, dominant sticklebacks, Gasterosterus
aculeatus, fed on large prey while subordinate competitors fed on small prey. Dominant female olive baboons, Papio anubis, had up to 30 % more food intake than the lowest ranking females, because of intraspecific competition (Barton and Whiten 1993). In Apennine chamois (Rupicapra pyrenaica ornata) younger subordinate animals took fewer bites per minute foraging because of social stress (Lovari and Rosto 1985).
Chances of reproduction can also be negatively affected by group living: in some species only dominant animals reproduce and the other group members help to rear the dominant's offspring (e.g. in dwarf mongooses, Helogale parvola (Rood 1980), or in marmots, Marmota marmota (Arnold 1990; Lenihan and Van Vuren 1996)). Non-reproducing adult dwarf mongooses do not leave the group and raise their own
offspring, because they need help from others to protect offspring from predators (Rood
1980). They "benefit" from staying in the group, probably because of dilution and
detection, and wait to take the place of dominant individuals.
Grouping may not always lower the parasite load; on the contrary, it often increases the chances of parasite transmission especially for males (Hoogland and Sherman 1976;
Folstad 1989; Folstad and Karter 1992; Moller et al. 1993; Cote and Poulin 1995).
Parasites can be an important selective force and may be a major cost of sociality
(Moller et al. 1993). In some cases the higher probability of infection with parasites in
groups is certainly a disadvantage ofgroup-living.
I propose for the first time a new factor that could disadvantage certain individuals living in a group: the need to synchronize activity with other group members. Synchronization of behaviour in a group is essential for group cohesion (Jarman 1974;
Murphy 1980; Griffiths and Magurran 1997; Peuhkuri 1997; Peuhkuri et al. 1997), but
may be a disadvantage if group members differ in body size, because synchronization could decrease foraging efficiency and therefore involve a cost. Animals may consequently try to form sex- and size-segregated groups to avoid the costs of synchronization. Fish swim in highly synchronized schools and they tend to aggregate
with fish of the same size when given the choice (Ranta et al. 1992; Griffiths and
Magurran 1997; Peuhkuri 1997). It has been argued that fish prefer to school with fish of
the same size to minimize oddity effects and to maximize foraging efficiency (Krause et al. 1996). Larger or smaller individuals stick out in a school of similar sized fish, show
different foraging behaviour and are therefore more vulnerable to predation (Lf
Abee-Lund et al. 1993; Peuhkuri 1997). If these odd individuals stay in schools, they have to
adjust their behaviour to that of the other fish to keep up with them. In many social
ungulates males are considerably larger than females and often live in separate groups
(Main and Coblentz 1990). Males which are born and first stay in female groups change
to all-male groups at some stage in their life. At some point in their development they are of intermediate body size between adults of both sexes and may face a trade-off
between adjusting their behaviour to that of the majority of group members and
optimizing their time budgets to maximize body growth. Young male bighom sheep for example may face such a trade-off and I therefore predict that they will either form groups ofsame-age peers, or they will synchronize their behaviour to the majority of the other group members independently of the age-sex composition of the group. Adult males and females should not form mixed groups because of dimorphism in body size
and incompatibilities of activity budgets (Chapter 2). In mixed groups, males and
females would be forced to adjust their behaviour to each other. Synchronization should therefore be lower in mixed groups (Chapter 3). Synchronization of behaviour has been
studied in schooling fish (Murphy 1980; Lindstrom and Ranta 1993; Griffiths and
Magurran 1997), but few data on ruminants are available. Here I propose the new
hypothesis that synchronization of activities may be costly for individuals who differ in
body size from the majority of group members (Chapter 3).
The evolution of sexual segregation: why do males and females live in different
groups?
While some studies have mainly concentrated on why animals are gregarious, others have dealt with the questions of why some animals form different types of groups, such
as segregated male and female groups in ungulates or size-assorted fish schools (Murphy
1980; Clutton-Brock et al. 1987; Jaldmchuk et al. 1987; Miquelle et al. 1992; Lindstrom
and Ranta 1993; du Toit 1995; Bowyer et al. 1996; Main and Coblentz 1996; Thirgood
1996; Bleich et al. 1997; Griffiths and Magurran 1997; Peuhkuri 1997; Peuhkuri et al.
1997). Several hypotheses have been proposed to explain why ungulate males and females segregate into different groups. The hypotheses receiving the most support invoke differential predator avoidance and reproductive strategies, differences in nutrient requirements and therefore habitat selection, and social preferences (for a
summary see Main and Coblentz (1990); Main et al. (1996)).
In a study on the feeding ecology of giraffe (Giraffa camelopardalis). Young and Isbell
(1991) showed that females with young sought open habitat to avoid predators, while
non-reproductive females and males fed in tail and thick vegetation. In open habitat females fed on plants that were at heights lower than that at which feeding rate was greatest. Male ungulates often are less vulnerable than females to predation, because they are larger. Hence males could seek habitat according to food availability, while females may have to choose habitat that is first safe from predators and only secondly provides the best nutrition (Festa-Bianchet 1988a). Alternatively, because males and females differ in their energy requirements, they may prefer different plant species and therefore segregate in space (Jakimchuk et al. 1987; Weckerly 1993; Bowyer et al. 1996; Main and Coblentz 1996; Bleich et al. 1997). Social preferences have also been proposed to lead to sexual segregation, because from a young age males seem to prefer to interact and play with other males (Bon and Campan 1989; Bon 1991; Bon et al.
1993; Villaret and Bon 1995). Competition over resources could be another factor leading to sexual segregation: female red deer, Cervus elaphus, may exclude stags from preferred swards by scramble competition, because females tolerate lower plant biomass than males (Clutton-Brock et al. 1987). Possibly, there is no single factor responsible for sex segregation, but several factors such as predator avoidance, social and food
preferences may interact and lead to spatial or temporal segregation of male and female
groups.
Although the question of sexual segregation in ungulates has received much attention, it
still lacks a satisfactory explanation. In this thesis I propose the new hypothesis that
body size and therefore differences in foraging time budgets is a key factor leading to
sexual segregation in social ungulates (Chapter 2). Ruminants have a very specialized digestive system. Digestion, passage rate and tum-over of food depend on many variables, including quantity and quality of food consumed, the size of the incisor bar and of the rumen, mastication effort and microbial mmen populations. These factors
dictate the amount of food that can be ingested and processed per day (Hungate 1975;
Hanley 1982; Bunnell and Gillingham 1985; Demment and Van Soest 1985; Hudson
and White 1985; Gordon and Illius 1988; Hofinann 1989; Duncan et al. 1990;
Schmid-Nielson 1990; Gross et al. 1993; Illius and Gordon 1993; Robbins 1993; Van Soest
1994; Gross et al. 1995; Gordon et al. 1996). In many ungulates, males are considerably
larger than females, affecting individual metabolic rates and probably foraging
behaviour (Robbins 1993; Weckerly 1993). Metabolic rate can be represented
interspecifically as an allometric function of body weight:
Y = a Wu-/ ^ , where Y is the metabolic rate, a is a constant and W is the body weight.
Metabolic rate per unit body weight therefore decreases with increasing body weight. Metabolic rates are allometrically related to body weight, while mmen volume and gut capacity are isometric with body weight. This means that while relative metabolic rate decreases with increasing body weight, gut capacity remains a constant fraction of body weight (Owen-Smith 1988). Therefore larger ungulates can survive on poorer food
quality than smaller ones (Jarman 1974, Gordon and Illius 1988). Although the
animal species, it has been questioned whether or not this rule also applies within a
species (Hudson and White 1985; Schmid-Nielson 1989). Some authors have proposed
that the W^-^ rule does not apply within a species and suggested that foraging time
scales weakly with body weight (Hudson 1985). Bunnell and Gillingham (1985)
compiled data on foraging behaviour of ruminants and found than in 8 of 10 studied
species lactating and non-lactatmg female ruminants were spending more time foraging
per day than males. Bunnell and Gillingham (1985) argued that this difference could
occur 1) if females, which are smaller and potentially more vuhierable to predation, are
driven to do more of their foraging during the daylight than males, or 2) if males are
more efficient at converting food energy to meet their requirements.
A large animal has a large rumen and a relatively low rumen turnover ratio, the food stays longer in the stomach and is therefore more efficiently digested than in a small
animal with a quick rumen turnover and passage rate (Bunnell and Gillingham 1985;
Demment and Van Soest 1985; Hofmann 1989; Illius and Gordon 1992). Body size
determines rumen size and therefore food passage rate. Differences in rumen size should
hence lead to time budget differences in foraging and mmination (Hudson and White
1985; Berger and Cunningham 1988; Schmid-Nielson 1989; Illius and Gordon 1992;
Van Soest 1994). If this relation is applicable within a species, ruminant females must balance their faster passage rate and therefore digestive inferiority by either increasing foraging efficiency or by selecting higher quality forage than what is consumed by males (Gross et al 1996). I therefore predict that females of sexually dimorphic species, because of their smaller body and rumen size, should have a higher foraging rate, be more selective and travel more while foraging than the larger males, which have a larger mmen and hence higher digestive efficiency. If time budgets differ substantially according to sex, males and females may become separated over time, even if they were initially in the same group, unless males and females actively changed their behaviour to stay together. Such behaviour can be observed during the mtting season, when males
dramatically reduce the time spent foraging and lying in order to follow females in
estrus or to fight with other males over access to females (Geist 1971; Bunnell and
Gillingham 1985; Miquelle 1990). The foraging behaviour of adult male and female
bighom sheep as well as subadult males is explored in Chapter 2.
Reproductive status and foraging behaviour in females
If different nutrient or energy requirements lead to different time budgets we would expect activity budgets to depend not only on body size or age, but also on an animal's reproductive status. In particular, pregnant and lactating females may forage more than non-reproducing females (Chapter 3), because pregnancy and especially lactation can reduce the probability of survival, lead to weight loss or increase parasite loads (Bunnell
and GiUingham 1985; Oftedal 1985; Harvey 1986; Clutton-Brock et al. 1989;
Festa-Bianchet 1989; Green 1990; MacWhirter 1991; Berteaux and Micol 1992; Robbins
1993, Clutton-Brock et al. 1996). I therefore predict that lactating females will spend more time foraging or have a higher bite rate (to increase forage intake rates) than non-lactating females. Bighom ewes appear to provide more maternal care to their sons than to their daughters (Berube et al. 1996). In species where male reproductive success varies more widely than female reproductive success and where success can be influenced by maternal investment, mothers are expected to invest more in sons than in
daughters (Trivers and Willard 1973; Clutton-Brock et al. 1981). I therefore predict that
females with sons would spend more time foraging or have a higher bite rate or bite size than females with daughters, to compensate for the higher energy investment in their male offspring (Chapter 3). Differences in foraging behaviour of lactating and non-lactating female ungulates have been studied previously, but this is the first study to
present long-term data on the foraging behaviour of marked individual females. Lamb gender effects on foraging behaviour had not been investigated prior to this study.
Forage selection and habitat management
Forage selection in ungulates is a two-step process: first choose where to eat and second
what to eat and how (Bunnell and Gillingham 1985). The distribution and abundance, as
well as the quality of the forage, can have profound effects upon foraging behaviour. Wapiti, Cervus elaphus, on Mount St. Helen switched from forbs to a grass diet when
forbs became scarce (Merrill 1994). Warrick and Krausman (1987) found that bighom
sheep showed high movement rates where food was patchily distributed. Kudu, Tragelaphus strepsicerus, were found to increase their daily time foraging when diet quality declined (Owen-Smith 1994). Several authors have found a correlation between seasonal movements ofungulates in altitude or latitude and forage quality or availability
(e.g. bighom sheep (Shannon et al. 1975) or red deer (Albon and Langvatn 1992)). In
northern latitudes plants are dormant during winter and green-up occurs in spring, when the snow has melted away. The nutritional quality of vegetation peaks during green-up and afterwards it gradually declines, because at this time the young plants are high in
cell contents and have only little cellulose or lignified parts (Schwartz and Hobbs 1985).
Ungulates prefer newly emerging forage rich in protein and low in fiber content. Seeds, fi-uits, and newly emerged leaves of trees and shrubs are rich in protein content, but often contain secondary metabolites, for instance tannins, that may deter herbivores (Bryant et al. 1991). Grasses are known to have negligible levels of secondary compounds (Irwin et al. 1993). Bighom sheep are mainly grazers (Hofmann 1989). Goodson et al. (1991) found that bighom sheep ate 90% graminoids, 6 % forbs and 4 % browse in late winter and early spring, which means that they mainly feed on grass and sometimes forbs and
therefore are not often exposed to tannin digestion problems (Hobbs 1987; Irwin et al.
1993; Wehausen 1995).
Forage selection and habitat choice can have a profound effect on ungulate weight gain
and reproductive success (Clutton-Brock et al. 1982; Hanley 1982; White 1983; lason et
al. 1986; Albon and Langvatn 1992; Wilmshurst and Fryxell 1995; Dumont 1996).
Ungulates should therefore select high quality forage (Hanley 1982; White 1983;lason
et al. 1986; McNaughton 1988; McNaughton 1990). Prescribed bums have been used to
improve ungulate nutrition (Hobbs and Spowart 1984; Hurley and Irwin 1986; Woodard
1988; McWhirter et al. 1992), but most studies on the effects of bums on ungulate
foraging took advantage of naturally occurring forest fires (Merrill et al. 1980; Riggs
and Peek 1980; Seip and Bunnell 1985; Shaw and Carter 1990; Frank and McNaughton
1992; Carlson et al. 1993). In an attempt to restore traditional grazing grounds for bighom sheep and to assess the long-term effects of burning on forage availability and quality, we burned grassland patches and monitored the sheep's foraging choice as well as the forage quality and biomass over a four-year period (Chapter 4). I predicted that burning would increase the protein content and biomass of forage and that bighom sheep would prefer to forage on burned plots. This study is the first to look at the long-term effects of prescribed fires on forage quality and ungulate use within a wild population of marked sheep. It is an applied study that clearly establishes the duration during which grassland bums are of higher quality or provide higher biomass vegetation compared to controls and the duration of sheep preference for bums or controls.
My work is the first long-term study on foraging behaviour ofbighom sheep. The results are based on an intensive field stidy, includmg 8 to 14 hour continuous observations of marked individuals for three years, from April to September. This novel sampling design not only allowed me to compare individual differences in foraging behaviour according to age or sex, but also to look at group cohesion and synchronization of activities within
a group. It is the first study to look at the development of foraging behaviour and
CHAPTER 1
1.1 STUDY AREA
The Sheep River Wildlife Sanctuary is 30 km west of Turner Valley in south-westem
Alberta (50° N, 114° W) at an elevation of 1420-1740 meters. In 1973, 53 square
kilometers were set aside to protect traditional bighom sheep and mule deer (Odocoileus hemionus) range. The landscape is characterized by rolling hills with open grassy slopes and rocky outcrops. A steep river canyon cuts through the center of the Sanctuary. The flat grassland areas are dominated by Bromus inermis and Phleum pratense, introduced to produce forage for cattle, while Festuca scabrella and Danthonia intermedia are native plants which predominate on the grassy slopes (Boag and Wishart 1982). Aspen (Populus tremuloides), white spruce (Picea glauca) and lodgepole pine (Pinus contortd) stands are found on grassy slopes and flat areas along the river valley.
Sheep mainly feed on open grassland, but move through mixed forests on their seasonal migrations. Each spring, the ewes leave the Wildlife Sanctuary to go to alpine areas, 10-15 km to the west, where they give birth to a single lamb. They stay at higher elevations (1800-2400 m) until August, but often return for a few days to the Sanctuary during summer to graze and to visit natural salt licks along the Sheep River canyon (Festa-Bianchet 1988b). Rams also migrated to alpine areas in earlier years (Festa-(Festa-Bianchet 1986b) but stopped going there in the late 1980's. Instead, they increasingly used a grassland area about 10 km east of the Sanctuary. The population ofbighom sheep that winters in the Sanctuary has been studied since 1981 (Festa-Bianchet 1986a).
Sheep are caught with the aid of a dart gun at the age of 3 to 6 months. Xylazine is used
as a tranquilizer (Kreeger 1997). Tranquilized sheep are blindfolded, hobbled and
positioned stemally or on the side. Blood samples are taken to determine paternity
(Hogg and Forbes 1997) and body weight, chest girth, body and hind foot length are
measured. Sheep are checked for signs of contagious ecthyma (also known as postular dermatitis), a viral disease (L'Heureux et al. 1996). Dart wounds and other capture-related injuries are treated with an antiseptic. Sheep then receive a colored and numbered plastic ear tag in each ear. When handling is over, Idazoxan, an antagonist of Xylazine, is administered to reverse sedation (Jorgenson et al. 1990). All sheep born to ewes living in the Sanctuary are therefore individually marked and their exact age is known. There are two neighboring populations of bighom sheep that sometimes come into the Sanctuary (Festa-Bianchet 1986a). Some immigrant rams may stay with the study population for several years (Festa-Bianchet 1986b). All unmarked immigrant rams are individually recognizable through horn characteristics.
Hunting is forbidden inside the Wildlife Sanctuary, but is allowed in the alpine areas to
the west. The hunting season for bighom sheep is in September and October, when most of the study sheep are in the Sanctuary. No sheep was taken legally during my study, but one 4 year-old male was poached inside the Sanctuary. There is also a limited-entry hunt for ewes and lambs, but no marked ewe was known to be taken by hunters during my study. Bighom sheep have several predators such as cougars (Felis concolor), wolves (Canis lupus) and coyotes (C. latrans). In the Sanctuary the main predators are cougars which prey on all age-sex classes (Ross et al. 1997) and coyotes which mainly prey on lambs. Sightings of wolves are rare. The bighom sheep population in the Sheep River Wildlife Sanctuary has decreased in recent years from over 150 sheep in 1986 to
Table 1.1 Number of adult males, adult females, yearlings and lambs of the Sheep River
study population ofbighom sheep in October, 1994 to 1997.
YEAR
1994
1995
^996
1997
FEMALES
52
44
~46~ 44^MALES
35
37
^
36
YEARLINGS
5
w
T
^A
LAMBS
^
23
~3T24
TOTAL SHEEP
^2T
114
^w
H8
1.2 METHODS
Here I will only describe the general methods used to assess foraging time budgets, bite, alert and step rates in different age- and sex-classes of sheep. Specific methods will be discussed in each chapter. All observations were made on focal animals (Altmann 1974). Focal individuals were followed and their behaviour noted from 8 to 14 hours per day.
Sheep are diumal and spend most of the daytime foraging (Sayre and Seabloom 1994).
To assess the time spent grazing, lying, walking or standing my assistant and I observed
6 to 20 individually marked bighom sheep and noted their transition times from one
behaviour to the next. At the start of each observation we noted the time and the activity of each focal animal. When an animal changed its behaviour, for example from lying to grazing, the starting time of the new activity was noted. If a behaviour lasted less than a minute, it was ignored and we considered that it had not stopped its previous activity. If we lost sight of an individual for less than 30 minutes we continued focal observations when it reappeared. If it was out of sight for more than 30 minutes, the behavioural sample was dropped from the record. If we lost sight of the group of focal animals
before 6 hours of watching the observations were discarded, because I considered that observations of less than six hours would not be representative of daily activity patterns. From the daily activity observations I then calculated the total percent time spent foraging, lying, walking or standing, and the lengths of activity bouts. I distributed observation periods over all day-light hours, to avoid possible time effects on individual activity budgets. Observation periods usually lasted about 10±2 hours and we watched for a total of 12, 855 sheep-hours.
Although sheep were habituated to observers, we did not approach closer than 50 meters
to avoid affecting their activity. At the beginning of the study sheep took notice of our
presence but kept a distance. Over time they accepted our presence and sometimes approached us to within 10 meters. They subsequently lost their interest in the observers and mainly ignored us. We nevertheless kept our distance and tried not to fhghten them through sudden gestures or loud talk. Watching ungulates is generally very difficult because they are frightened of humans and often run away from people. The fact that these sheep tolerated our presence offered an unique opportunity to study their behaviour in detail over long time periods. I had previously worked with other ungulates such as bison (Bison bison) and alpine chamois (Rupicapra rupicapra), where the closest observing distance was between 100 and 300 meters and where the animals would flee instantly once they detected us. I therefore greatly appreciated the easiness with which I could follow these sheep. Ewes were generally more difficult to observe than rams because they moved around much more, sometimes covering 10 km in a day. Rams were much easier to observe and often did not move more than 500 meters in a day. Despite the differences in difficulty of observing ewes and rams each individual was sampled equally (if present in the Wildlife Sanctuary), at least once a month, and if
To assess bite, alert and step rates each focal animal was observed for 10 one-minute sessions while it was grazing. From these sessions I calculated the average number of bites, steps and alert postures per minute. A bite was defined as biting vegetation followed by an upward jerking motion of the head. Steps were counted when either of the front legs moved forward. I considered sheep to be alert when they interrupted
feeding or lying to stand with their head raised well above the shoulders and ears
pointing forward. Sheep usually did not handle food while alert. If the focal sheep lay
down within two minutes of the start of bite rate observations, we would ignore the two minutes sampled and begin a new session once the sheep started a new grazing bout. We only counted steps, bites and alert postures if the individual had grazed for at least 40 consecutive seconds during the one-minute focal sample. If the sheep spent less time grazing it was considered standing or doing something else and the observation was stopped and the data deleted. We sometimes had to watch a focal animal for over an hour to obtain ten one minute samples, because sheep often moved from one grazing patch to the next, stood still during several minutes or were engaged in interactions with other sheep.
CHAPTER 2
FORAGING BEHAVIOUR AND SEXUAL SEGREGATION IN BIGHORN
SHEEP
(Animal Behaviour 1998: In press)
2.1 INTRODUCTION
Predator pressure and food distribution are the main forces that lead to sociality and the
formation of groups (Hamilton 1971; Ward and Zahavi 1973; Alexander 1974; Bertram
1980; Jennings and Evans 1980; Dehn 1990). Ungulates living in open habitat form
groups, and individuals decrease vigilance and increase bite rate with increasing group
size (Jarman 1974; Berger 1978; Risenhoover and Bailey 1985a,b; Penning et al. 1993;
Molvar and Bowyer 1994). In polygynous ungulates the sexes form separate groups and
are spatially segregated for most of the year (Main and Coblentz 1990; Bon 1991; Main
and Coblentz 1996). Understanding the formation and dynamics of sexual segregation is an important problem in the behavioural ecology of ungulates because it is a basic component of their social organization. Although the evolution and the adaptive advantages of sexual segregation are poorly understood, several hypotheses have been proposed to explain this phenomenon.
Main et al. (1996) classified these hypotheses into three groups: (1) sexual differences in
how reproductive strategies affect risk ofpredation and consequently predator avoidance
1991; Young and Isbell 1991; Bleich et al. 1997), (2) social factors, such as interactions
with and preference for same-sex peers, and learning fighting skills (social hypothesis)
(Bon 1991; Bon and Campan 1989; Clutton-Brock et al. 1987). and (3) sexual
differences in energy requirements and therefore foraging behaviour, choice of habitat
types and diet (sexual-dimorphism-body-size hypothesis (Seip 1983; Shank 1982;
Shank 1985; Clutton-Brock et al. 1987; Harris and Miller 1995; Main et al. 1996).
Because of their small size, juvenile ungulates are exposed to a greater risk ofpredation from a greater range of predators than either adult males or adult females. Therefore females with young may choose sites according to safety from predators rather than
quality of the forage (Young and Isbell 1991; Bleich et al. 1997). Males, on the other
hand, are larger and therefore less vuhierable to predation than females or young. Large males have a higher reproductive success than small ones, because size is correlated with fighting success and access to females in estrous (Geist 1971; Clutton-Brock et al. 1982). Because body size is likely to have a greater effect on the reproductive success of males than of females, males might choose sites according to nutritional characteristics
rather than safety from predators (Jakimchuk et al. 1987; Miquelle et al. 1992; Main and
Coblentz 1990). The reproductive-strategy hypothesis therefore predicts that sexual segregation should be most pronounced when offspring are most vulnerable to predation.
Bon (1991) suggested that sexual segregation should be separated into spatial and social
segregation. He argued that social preferences and segregation develop during the ontogeny of young males and females through the formation of same-sex peer groups.
Although this hypothesis has not yet been supported by field evidence, Villaret and Bon
The sexual-dimorphism-body-size hypothesis predicts that females and males will seek habitats with different forage quality. Males are thought to prefer abundant, low-quality
forage, while females are thought to prefer high-quality forage to satisfy high energy
demands due to gestation and lactation (Main and Coblentz 1996). Although there is
some support for the dimorphism-body size hypothesis (Beier 1987; Clutton-Brock et al.
1987) several studies have failed to support its predictions (review in Main and Coblentz
1990; Main et al. 1996).
The sexual-dimorphism-body-size hypothesis has principally been tested in terms of sexual differences in diet or habitat choice, but not in terms offoraging behaviour. If the
sexes fed on identical diets but with different foraging behaviours, diet and habitat
selection studies would tell us little about sexual segregation. I propose that sexual segregation is based on behaviour differences. Sexual segregation could be explained by sex differences in body size that lead to sexual differences in time spent foraging or duration of alternating grazing and lying bouts. Energy requirements and foraging behaviour are affected by body size. Metabolic rate is allometrically related to body weight and mouth size, while mmen volume and gut capacity are isometric with body weight (Jarman 1974; Demment and Van Soest 1985). So, while specific metabolic rate decreases with increasing body mass, gut capacity remains a constant fraction of body mass (Owen-Smith 1988). Therefore, females should have a higher metabolic rate and higher nutritional need per unit body mass than males. Hence, females will have greater food requirements than males relative to their body mass. A large animal has a large rumen and a relatively low mmen turnover ratio, allowing the food to stay longer in the stomach and therefore to be digested more efficiently than in a small animal with a faster mmen turnover rate (Demment and Van Soest 1985; Illius and Gordon 1992). Consequently, males should have longer mminating bouts than females. For most ungulates for which data are available, females forage longer than males (Owen-Smith 1988). To compensate for high energy demands, females might not only forage for
longer, but they could also be more selective while foraging than males. If females forage selectively, they should take more steps and cover more ground than males while foraging (Komers et al. 1993).
I propose that differences in time spent foraging and movement rates alone could explain why the sexes segregate. Although this approach fits into the sexual-dimorphism-body-size hypothesis, it is new because it proposes that time spent foraging and movement rates are the key factors involved in sexual segregation, rather than differences in diet selection. Despite the large number of studies of sexual segregation, apparently only
Seip (1983) proposed that differences in time budgets may explain sexual segregation in
sexually dimorphic ruminants. Previous work may have failed to look at the possibility that segregation results from differences in time budgets because the required focal-animal samples of marked individuals lasting several hours are very difficult to obtain for wild ungulates.
Rocky Mountain bighom sheep are mostly diumal feeders (Sayre and Seabloom 1994),
use open habitats, are very social (Geist 1971) and live in groups year-round. Bighom sheep are sexually segregated for most of the year and form two main types of groups: bachelor groups (mostly adult males) and nursery groups, consisting of adult females, lambs, yearlings of both sexes and subadult males. In my study area some subadult males up to 3 years old stay in female groups (Festa-Bianchet 1991). At 2 years of age males are slightly larger than adult females and at 3 years they are larger than females (Festa-Bianchet et al. 1996). Three-year-old males move to and stay in adult male groups and are rarely seen in female groups (Geist 1971; Festa-Bianchet 1991). I predicted that 2-year-old males should show foraging behaviour closer to that of adult females than to that of adult males because of similarity in body size with females. Three-year-old males with an intermediate body size between adults of both sexes should show a foraging behaviour that is intermediate between that of adult males and of
adult females. Two- and 3-year-olds sometimes switch between ewe (female) and ram
(male) groups (Geist 1971). I propose that if an animal lives in a group, the best strategy
would probably be to do as the other group members, to keep up with the group: it would have to move when they do and follow similar time budgets. Consequently, if 2-and 3-year-old males change between male 2-and female groups, they should adjust their foraging behaviour and movement patterns to those of the group they are in. The choice of groups (adult male or female groups) in 2- and 3-year-old males probably is affected by their body size. As they grow older and bigger they should prefer the company of peers of similar body size to be able to forage optimally and this preference should lead to the formation of adult male groups.
2.2 METHODS
Data were collected from April to September in 1994-1996. Observations were made on 51 adult females (17 non- and 34 lactating ewes), 39 adult males, 12 2-year-old, and 18 3-year-old males. Females were considered adults at 3 years of age or older, males from the age of 4. At 3 years of age, females are almost full-grown and they usually have their first or second lamb. Two-year-old females were excluded from the analysis because sample size was too small. Before the age of 4 males are smaller than adult rams; 3-year-old rams are about the same size as ewes or slightly bigger (Festa-Bianchet et al. 1996). Adult bighom rams are about 50% heavier than females by 4 years of age and sexual dimorphism increases with age at least up to 6 years (Festa-Bianchet et al. 1996). Observations were made with Leica Binoculars (10 x 42) and a Bushnell spotting scope (25-40 x 60 zoom). The sheep were habituated to people and easily observable.
To construct individual time budgets (time spent grazing, lying or walking), one or two observers selected up to 20 marked sheep and observed them for 8-14 h. I used lying time as a measure of ruminating time, because sheep seemed to be mminating most of the time when lying but it was impossible to assess mmination if sheep faced away from the observer. Time budgets shorter than 8 h were discarded. We attempted to distribute observations over all daylight hours. For each focal animal, the transition time from one behaviour to another was recorded. Behaviour that lasted less than a minute was not recorded. If a sheep changed its behaviour for 1 min or more I considered that it had started a new activity bout. The date, time, location, ID, age and sex of the focal sheep, the number and sex-age classes of animals in the group were noted. I tried to sample the sexes equally across months. This was not always possible as there were fewer females in the study area in summer than in spring or fall. In Fig. 1, numbers of individuals sampled for a specific month (3 years total) are indicated above the bars. A total of 12,855 sheep-hours of observation were collected.
To measure individual step rate, I counted the numbers of steps each focal sheep took per min grazing. Each animal was observed for 10 times 1 min per observation session. A total of 140 h of step rate counts was collected.
To assess the distance traveled by a group during time budgets, I noted the initial and final location as co-ordinates on a map and calculated the shortest distance between starting and ending points. I then calculated the distance traveled per hour, by dividing the total distance traveled by the hours of observation. If a group traveled but returned to its initial location at the end of the observation period I calculated the distance traveled as zero. Therefore, I did not measure total travel, but rather the distance groups traveled away from their original location, which is more pertinent to an understanding of sexual segregation. For example, if females moved to graze somewhere and then returned to the same area, males could remain in the same groups simply by moving in the same general
direction but over a shorter distance. If females did not return, males would have to follow female groups to stay with them. Map co-ordinates noted during time budget observations were used to assess ifewes and rams were using the same locations.
2.3 DATA ANALYSES
Data were tested for normality (normal probability plots, Lilliefors test) and
homoscedasticity (Bartlett-Box F) using the SPSS statistics package (Norusis 1993).
Some sheep were sampled several times and I calculated the mean duration of grazing, resting and walking bouts for each individual each month to reduce pseudo-replication
(Machlis et al. 1985; Leger and Didrichsons 1994). I waited at least 1 week between
observations on the same individual. Mean duration of grazing and lying bouts were log-transformed and percentages were arcsine square-root log-transformed (Zar 1984). Mean duration of and percentage of time spent walking and step rates were not normally distributed and therefore were analyzed with non-parametric Mann-Whitney U-tests. One-way ANOVAS were used to verify whether sex affected the mean duration of activity bouts and the per cent time spent in different activities, and whether time budgets of young males differed in different types of groups. A two-way ANOVA was used to test the effect of month and sex on the per cent time adult males and females spent foraging. Multiple comparisons of non-parametric data were done using Maim-Whitney U-tests (Siegel and Castellan 1988) with Bonferroni adjusted P-values. In the results section means are followed by standard errors (SE). Where non-parametric statistics are applied, the median is given with the interquartile range.
2.4. RESULTS
2.4.1 Time spent grazing or lying and mean duration of activity bouts of adults
The database included 266 focal observations of females and 354 observations of adult
males. Ewes and rams spent at least 80% of the daytime grazing or lying and mminating. Ewes spent more time grazing than males in all 6 months of observation (Table 2.1, two-way ANOVA, sex: Fi=135.13, p<0.001; month: Fs= 45.72, p<0.001, interaction: Fs =0.96, p=0.44, Figure 2.1). Females also had longer grazing bouts than males (one-way ANOVA, Fi,62o=18.43, p<0.001). Rams spent much more time lying and had significantly longer lying bouts than ewes (Table 2.1, Fi,62o=193.5, p<0.001 for time spent lying, Fi,62o=21.74, p<0.001 for duration of lying bouts).
2.4.2 Effect of group type on foraging behaviour of young males
Two-year-old males had significantly longer grazing bouts (Fi,85=13.27 p<0.001) and lying bouts in nursery than in bachelor groups (Fi,85=10.05, p<0.01) (Table 2.2). However, 2-year-old rams did not differ in the time spent grazing (Fi,g5=2.24, p=0.14) or lying (Fi,g5=0.95, p=0.33) with ewes and with adult rams (Table 2.1). Three-year-olds only changed the duration of lying bouts when they shifted between ewe and adult ram groups (Fi,io3=7.45, pO.Ol). Grazing-bout duration (Fi,io3=0.71, p=0.4) or the per cent time spent lying (Fi,io3=3.48, p=0.06) and grazing (Fi,io3=2.66, p=0.11) were not
Table 2.1. Mean (± SE) duration of grazing and lying bouts and per cent time spent
grazing and lying per observation period (8-14 h) for 2- and 3-year-old bighom sheep rams in ewe and in adult ram groups, and for adult ewes and rams.
Bout duration (min) % Time
Group type Grazing Lying Grazing Lying
N
2-year-old rams 3-year-old rams Adult ewes Adult rams Ewes66
Rams20
Ewes29
Rams75
Ewes266
Rams35
31±2.0 37±2.4 46±1.7 46±1.7
20±2.1 26±2.2 41±3.8 50±3.5
28±3.1 43±3.6 43±3.0 49±3.1
24+1.3 34+1.5 38+1.2 54+1.137±1.1 36±0.7 53±0.8 39±0.7
29±0.7 40±1.0 38±0.5 53±0.4
2.4.3 Movement patterns and sheep locations
Females spent a median of 0.8% (range=0.2-1.6%; n=266) of their time walking compared with a median of 0.4% for males (range=0-l%, n=354) (Zi= -4.13, p<0.001). Females also had longer walking bouts than rams (ewes:2 min, range=l-3 min; rams: 1.2
min, range=l-2 min; Zi= -4.35, p<0.001). Females moved a median of 40m/h (range=12-75 m, n=66 groups) away from their initial location, while males traveled a median of average 11 m/h (range=0-50 m, n=76 groups). So female groups traveled nearly four times as far as male groups each hour (Zi= -4.2, p<0.001). This result was consistent for all 6 months of observation (Table 2.2, all comparisons with g values <0.001, with an adjusted significance level of 0.008, Mann-Whitney U-tests). There was no significant difference in the number ofsteps/min by adult rams and ewes (Zi=-1.86, p=0.063). Ewes (n=283 observations) took on average 4.8 (range=3.5-6.5) steps/min, while rams (n=372) took on average 5.2 (range=3.8-6.9) steps/min. The step rate of 2-and 3-year-old males did not differ from adult ewes (Zioo,i=-1.5, p=0.13) or from older rams (Z62,6=-1.6, p=0.11). Two-year-olds took on average 6.3 (range=4.1-8.1) steps/min
and 3-year-olds took 5.7 (range=3.8-6.9). Ewe and ram groups were found in the same locations most of the time (Figure 2.2), except there were a few locations in the south-west of the study area preferred by ewes and some locations in the north-south-westem and south-eastem part of the study area, preferred by rams.
Table 2.2. Distances traveled (medians and interquartile ranges) in m/h by bighom sheep ewe and ram groups observed from April to September (1994-1996). N==number of groups observed.