Open Archive TOULOUSE Archive Ouverte (OATAO)
OATAO is an open access repository that collects the work of Toulouse researchers and
makes it freely available over the web where possible.
This is an author-deposited version published in :
http://oatao.univ-toulouse.fr/
Eprints ID : 18699
To cite this version :
Brahimi, Mehdi and Medjaher, Kamal and Leouatni, Mohammed
and Zerhouni, Noureddine Critical Components Selection for a
Prognostics and Health Management System Design: an
Application to an Overhead Contact System. (2017) In: Proceedings
of Annual Conference of the Prognostics and Health Management
Society 2016, 3 October 2016 - 6 October 2016 (Denver, USA,
United States).
Any correspondence concerning this service should be sent to the repository
administrator:
[email protected]
Critical Components Selection for a Prognostics and Health Management
System Design: an Application to an Overhead Contact System
Mehdi Brahimi1, 2, Kamal Medjaher3, Mohammed Leouatni4 and Noureddine Zerhouni1 1FEMTO-ST Institute, AS2M Department, 25000 Besançon, France
[email protected] [email protected]
2 ALSTOM, 48 rue Albert Dhalenne, 93400 Saint-Ouen, France [email protected]
3 Production Engineering Laboratory (LGP), INP-ENIT, 47 Av. d’Azereix, 65000 Tarbes, France [email protected]
A
BSTRACTIn recent years, improving quality of rail services by increasing availability, saving energy, and cutting the costs of infrastructure and rolling stock maintenance has become a central concern in the railway industry. Furthermore, considerable research efforts have been devoted to develop monitoring and health management solutions for the rail transportation systems. Streaming data from trains, infrastructure and signaling systems became a key subject for an implementation of a predictive maintenance. Prognostics and Health Management (PHM) is an approach that aims to support a predictive maintenance program. Basically, the first step to develop a PHM system is to identify critical components. This paper emphasizes on the critical components selection step. It presents a methodology to identify the critical components for the design of a PHM solution. The proposed methodology is based on objectives definition for PHM and it is applied to an Overhead Contact System (OCS).
1. INTRODUCTION
The railway industry is aiming to develop more efficient and intelligent systems which can respond to the increasing need for mobility and time issues. In the last decade this industry showed a growing interest focused on maintenance techniques and monitoring systems for the rolling stocks, the signaling systems and the infrastructure (Lu, Shan, Tang, & Wen, 2016). In this context the current collection
system is a key issue in modern railway industry. In fact, a degraded or even damaged components of the Overhead Contact System (OCS) or the current collectors can lead to train delays, infrastructure and rolling stock damages or even electrocution of passengers. In 2009 for example, catenary incidents generated more than 2500 hours of delay for 150 millions of euros of losses for the SNCF (Massat, 2007).
Within this framework, implementation of an adapted maintenance policy to manage the operability of the asset has become a crucial task for competitiveness. Regarding the security, reliability and availability requirements of systems such as OCS and pantograph, efforts are made to deploy a Condition-Based Maintenance (CBM) and preventive maintenance policy for the railway infrastructure using inspection trains and diagnostics solutions.
The PHM can be defined as a system engineering discipline which provides key processes, technologies, and techniques to achieve an accurate monitoring, asses the current state of an equipment, realize diagnostics, and estimate the future health state of a degrading asset. It is a discipline which enables the CBM and the predictive maintenance.
In general, identification of critical components is the first step to deploy a PHM solution (Uckun, Goebel, & Lucas, 2008). It aims to determine which component or sub-system contribute the most to the degradation and affect the performance of the system in term of availability, reliability and downtime costs. Moreover, the study of failure modes and mechanisms of critical components allows understanding the root causes of the damages and how it lead to failure of the component. This step provide necessary information to select appropriate and mature
Mehdi Brahimi et. al. This is an open-access article distributed under the terms of the Creative Commons Attribution 3.0 United States License, which permits unrestricted use, distribution, and reproduction in any medium, provided the original author and source are credited.
diagnostic and prognostic technologies and the appropriate monitoring technology solution.
In addition, most of the current PHM solutions are adapted to industrial systems or electronic components which are not compatible with the large-scale distributed systems such as railway infrastructure. In fact, railway infrastructure is composed of linear assets which span long distances and are composed of a large population of components. This implies that selection of critical components must comply with the system definition and relevant requirements defined for the prognostics and the diagnostics functions.
In this paper we propose a systematic approach for the criticality determination of systems regarding a PHM system development. The section 2 present the different methodologies to determine critical component in reliability. The section 3 aims to propose an approach to assess the criticality of a system regarding a PHM implementation objectives. Then the methodology is applied to the OCS which have a great influence on the operability of the railway system.
2. CRITICALITY DETERMINATION FOR PHMSYSTEMS
DESIGN
Classical diagnostics approaches use system control parameter and performance data to deduce and detect a faulty state of a sub-system or a component. However, with the development of systems complexity, detect faulty components or failures become increasingly complicated and necessitated the extraction of specific features using monitoring systems. In this context, we can distinguish two type of monitoring levels for the PHM implementation: system level monitoring which aims to get system performance and control data, and the component level monitoring which aims to supervise the behavior of critical components (Mosallam, Medjaher, & Zerhouni, 2015). In this way, the identification of critical components is a key task for a PHM system deployment.
Traditionally, one way to define the critical components of a system is by conducting an analysis of system dependability. The dependability of a system is assessed using an evaluation of its attributes such as availability, reliability, safety, integrity and maintainability (Avizienis, Laprie, Randell, & Landwehr, 2004). There are several techniques to assess the reliability of a system depending on the available data and the context. The IEC standard (IEC-60300-3-1, 2003) provides a list of techniques to support the engineers to assess the dependability of a system.
These techniques can be classified into two main groups, namely the qualitative and the quantitative approaches. The qualitative and semi-qualitative approaches relies to experts’ judgment of the available data to identify and evaluate the potential failures to make a reasonable judgment of risks. These techniques can be decision or
experience based and provide qualitative evaluation of the risk such as low, medium and high. Qualitative approach is usually performed using techniques such as Checklist, Failure Mode and Effects [Criticality] Analysis (FMEA/FMECA), Preliminary Hazard Analysis PHA, Hazard and Operability Study (HAZOP).
The quantitative approaches can be probabilistic or deterministic. These approaches use statistical methods to estimate measures such as failure rate, mean time to failure (MTTF), Mean time between failures (MTBF), etc. to evaluate a reliability of a system (IEC-60300-3-1, 2003). The most common used techniques are Fault Tree Analysis (FTA) and Event Tree Analysis (ETA). Moreover the different approaches can be combined for system reliability and risk analysis (Tixier, J., Dusserre, G., Salvi, O., & Gaston, D., 2002).
In the context of PHM, the FMEA and its extensions FMECA and FMMEA (Mathew, Das, Rossenberger, & Pecht, 2008) techniques are often used to assess the criticality of the system and define what prognostics can be done for the system regarding the components.
3. PROPOSED APPROACH
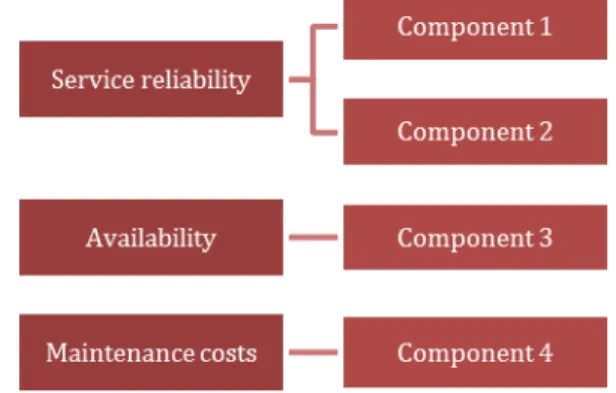
Deployment of PHM system for a CBM program can insure mainly objectives such as: increasing service reliability; increasing system availability; and decreasing maintenance costs. In the proposed methodology, identification of critical components is achieved regarding 3 objectives cited above for a CBM program implementation. In this framework, the goal is to assess the criticality of the system regarding each objective of the maintenance program, as depicted in the following chart:
Figure 1. Select component regarding to PHM objectives. Thereafter, for each objective the identified critical components are ranked in regarding their criticality for the entire system. Then, failure modes and failure mechanism of the top critical components are studied to select precursors or parameters that influence the failure generation. This information is then used to identify the mature technology for sensors, monitoring, and data acquisition.
3.1. Components with High Impact on Service Reliability
Components with a high failure rate can seriously affect service reliability. Insuring monitoring and predictive solutions can help to decrease the occurrence of these failures. In the context of railway infrastructure this can be achieved by the analysis of the most impacting components for incidents and failures; using FMEA analysis; FTA; or other system reliability assessment approaches.
3.2. Identify Components with the Most Impact on Maintenance and Downtime Costs
A PHM system can considerably reduce the life cycle cost (LCC) of a monitored system. Indeed, a monitoring system can reduce regular inspection costs by replacing some unnecessary tasks by necessary ones and plan maintenance tasks regarding the current and the future state of the system which can help to reduce spare parts costs and logistics. In addition, setting up a continuous monitoring and a diagnostic solution can help to identify accurately and quickly the failed components which allows reducing costs due to downtime.
Consequently, the components which affect the most maintenance costs and downtime costs are identified in this step aiming a more efficient deployment of a PHM solution. 3.3. Components with High Impact on System
Availability
To increase availability, the goal is to identify the component which have the most affecting failures. In other word, this step is dedicated to select the components which cause the most downtime per occurrence and the components with a high frequency of failure. An example of an identification methodology for critical component regarding their impact on system availability is proposed in (Wang & Nee, 2009). It is based on a four quadrant chart which illustrate the frequency rates of components failure vs. the average downtime associated.
3.4. Decision Table
After reviewing most impacting components for maintenance costs, service reliability, and system availability. A score is attributed to each component according to its criticality regarding the defined objective. Three indexes are defined, criticality index for service reliability (ISR), criticality index for maintenance costs (IMC), and criticality index for availability impact (IA). Four scores are defined for each index; 0 for the component which have no impact for the defined objective; 1 for a low criticality regarding the defined objective; 2 for medium criticality and 3 for a high criticality. The defined indexes are weighted. Thereafter, a criticality index (CI) is calculated for each component in order to rank them. An illustration of the decision table is presented below:
Then, a Criticality Index (CI) is calculated for each component (k), as follows:
𝐶𝐼#= 𝛼 𝐼𝑆𝑅 + 𝛽 𝐼𝑀𝐶 + 𝛾 𝐼𝐴 (1) The parameters α, β, and γ in Eq. 1 represent the weights of each index. These weights can be defined regarding maintenance program objectives.
For example, for a maintenance program with equal objectives for service reliability, maintenance costs, and availability; and a component which have no impact for Service reliability, a medium criticality for the maintenance costs and a high criticality for the system availability will have a critical index value of: 𝐶𝐼 = (1×0) + (1×2) + (1×3) = 5
3.5. Targets and Monitoring Parameters Definition After identification of critical components, the failure modes and failure mechanisms of each component are reviewed. Then targets are defined for each failure mode or failure mechanism. The targets can be the selection of sensors, acquisition system, or selection of a mature processes for diagnostics and prognostics. The figure presented above, summarize the procedure for the selection and the identification of the PHM system solutions through targets. Some of failure mechanisms can’t be monitored by sensors. They will not be reviewed for the PHM development however maintenance targets are set up for this kind of failures.
Figure 2. Monitoring parameters selection procedure Table 1. Caption Decision table for critical components
ranking. Components Service Reliability (ISR) Maintenance costs (IMC) Availability (IA) CI Component 1 2 3 2 Component 2 3 1 1 Component 3 2 2 3 … … … Component n 1 3 1
4. CRITICAL COMPONENTS FOR THE OCS
The data used for this study are gathered from different sources: OCS incident records for the French railway network (SNCF Open Data, 2016), data from experience feedback, and workshops with experts. In this paper, the studied OCS is built for a 2 x 25 kV electrified main line. 4.1. The OCS
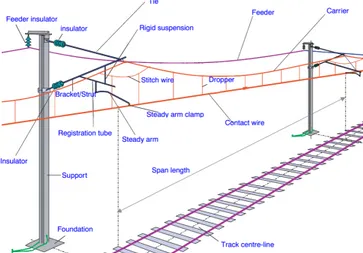
Basically, the OCS system is an assembly of cables carrying necessary electrical energy to the trains. It is composed of simple conception components such as cables and pulleys. However, the dimensioning of each component requires relatively complex calculations to obtain a very accurate geometry. Furthermore, the procedures for mounting and adjustment of a catenary are result of decades of experience. There are multiple types of catenaries conceptions depending on the type of the carried current, train desired speed and environmental constraints. The Figure 3 shows a span section of an AC OCS system used for high speeds line.
Figure 3. A span of an AC Overhead Contact System (UIC, 2006)
For the study, the components are classified into groups with the same function. The various sub-systems set out in the data tables are defined as follow:
- Supports: mechanical parts including suspension fittings, head span support, incoming feed
- Insulator: made of glass or composite materials - Steady arm
- Messenger wire (Carrier): 65.4 mm2 bronze - Contact wire: 150 mm2 copper
- Feeder: power supply or line (288 mm2 aluminum) - OCS suspension (droppers): 12 mm2 bronze dropper - Connections: power supply (feeder connections),
continuity (tensioning equipment)
- Tensioning equipment - Section insulator
The insulators are used to separate the supply system (contact wire, carrier and droppers) from the earth. The steady arm insure the smooth crossing of the pantograph at supports and it is articulated at its bottom. The feeder is connected at specific points to carry the necessary current to the supply system. The insulators and the steady arm are presented in the following figure:
Figure 4. Cantilever for an OCS (UIC, 2006) The tensioning device ensures that the carry system is kept at a mechanical tension to avoid its thermal expansion due to temperature variation. In addition, the conductors are anchored to the supports at midpoint of the section. The figure bellow shows the tensioning system:
Figure 5. Tensioning device for the OCS (UIC, 2006) 4.2. OCS Components with High Impact on Service
Reliability
The catenary is a high availability system which has a lifetime up to 40 years. However, incipient failures and defects can cause an inline traffic stop for a complete railway line, which can cause significant financial losses for operators. For the assessment of service reliability, analysis of incidents related to the studied system can be a good indicator to determine which component is critical for the service reliability.
The table presented below shows the repartition of the OCS incidents. The data were obtained from recorded incidents
for the French railway network between November 2014 and November 2015:
In this table the OCS incidents are classified regarding their causes, we distinguish four types of causes:
- Weather causes: lightning can cause insulators destroying, frosts or freezing rain can hinder the current collection on the contact wire, strong wind…
- Rolling stock equipment and traction: these are the failures of signaling, a lack of maintenance on a pantograph, or non-compliance with procedural rules. - Infrastructure causes: this categories regroup the
electrical or mechanical failures of catenary materials - Other causes: malicious acts, copper theft, falling
objects, etc.
The rates highlights the causes of infrastructure failures which represent 43% of the incident impacting the service reliability. Subsequently, the infrastructure incidents are studied to determine which component have more impact in terms of infrastructure failures.
The analysis showed that 50% of infrastructure incidents were due to contact wire failures, 20% due to insulators failure, and 30% are due to other components failures or bad geometry of the catenary. Therefore, we can identify the contact wire and the insulators as the most impacting component for service reliability. The contact wire can be defined as a high criticality component (ISR = 3) and the insulators as a medium critical component (ISR = 2). 4.3. OCS Components with High Impact on
Maintenance and Downtime Costs
In this section the critical components are selected regarding: overhaul, maintenance and downtime costs. The maintenance of the OCS is organized regarding planned tasks consisting mainly of visual inspections and measurements, such as feeder temperature, contact wire height and stagger or inspection of tensioning device, etc. Automated measurement tools and new sensors can considerably reduce cost for this kind of inspections. In order to determine the component which affect the most maintenance costs, data were collected from different operators and projects of Alstom Company in different regions. In addition, regular meetings, interview questions, and workshops with maintenance managers and experts were conducted. From this work, it was noted that the Contact Wire is the most critical and impacting component
for the maintenance costs. Indeed, maintenance budget for the OCS was about 186 millions of euros in 2007 for the French railway network. The renewal of the contact wire represent 48 millions of euros per year for replacement of 500km of contact wire. This represent about 25% of the OCS maintenance budget each year. Moreover, the local wear is 80% of factor of renewal of the contact wire. Another aspect of conducted study was to identify the component the OCS which is the most impacting for downtime costs.
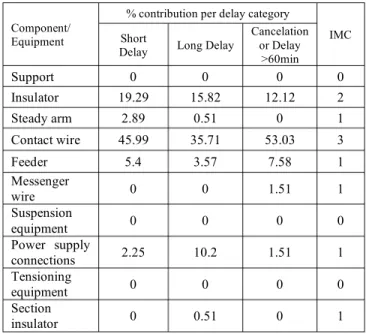
The table below shows the contribution of different OCS components on train delays. The data in this table are based on a survey realized on a high-speed line equipped with a 2x25 kV OCS.
Train delays can be very costly for railway operators. The study of the distribution of train delays due to OCS components allows us to rank the most critical components regarding downtime costs, the contribution of components for train delays, and the previous considerations regarding maintenance costs, we can then define the IMC index for each component as described in the Table 3.
4.4. OCS Components which Impact System Availability In this step we select the component with the highest impact on downtime and failure rate. The aim is to identify the most critical failures affecting service and system availability. The approach proposed in this section is based on the four quadrant approach proposed in (Wang and Nee, 2009) for the identification of critical components.
Table 2. OCS Incidents Distribution.
Cause type Other conditions Weather equipment Traction Infrastructure Involvement
rate 18% 3% 36% 42%
Table 3. Contribution of components/sub-systems to OCS train delays.
Component/ Equipment
% contribution per delay category
IMC Short
Delay Long Delay
Cancelation or Delay >60min Support 0 0 0 0 Insulator 19.29 15.82 12.12 2 Steady arm 2.89 0.51 0 1 Contact wire 45.99 35.71 53.03 3 Feeder 5.4 3.57 7.58 1 Messenger wire 0 0 1.51 1 Suspension equipment 0 0 0 0 Power supply connections 2.25 10.2 1.51 1 Tensioning equipment 0 0 0 0 Section insulator 0 0.51 0 1
The Figure 5 shows the component fault frequency for the OCS according to the average downtime of the system caused by components. Therefore, four quadrant numbered 1-4 are defined based on expert’s knowledge and requirements. The quadrant 1 contains the components with a low average downtime and component failure rate, which it means that the actual maintenance policy work well for these components and the components have a low impact on service availability. Quadrant 2 contains the components with a high failure frequency and a low average downtime. An efficient diagnostic process can help maintainers to detect the failures of these components earlier and take actions more efficiently. The quadrant 3 comprise components with a high average downtime and a high failure frequency. This kind of components failures should be fixed at the design stage. The quadrant 4 include the most critical components as they have a low failure frequency with a high average downtime. A diagnostic and prognostic process can be applied to this kind of component to prevent their failure and estimate their RUL.
In the case of the OCS, the Figure 5 highlight the criticality of the contact wire which is a part of the quadrant 4, therefore we define an IA=3 index for this component. In addition, the quadrant 2 contains the insulator which allows us to define an IA=2 index.
Figure 6. Component fault frequency Vs. Downtime for an 2 x 25 kV OCS
4.5. Decision Table for OCS system
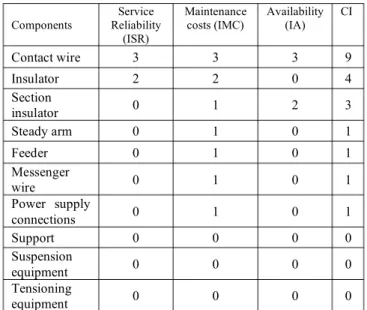
In this step, the criticality index CI of each component is calculated. The weights for each objective is equal regarding the operator targets for maintenance and service. The components are then ranked depending on their criticality. The table 3 shows the obtained criticality for each component regarding the defined objectives:
The contact wire has a high criticality in for the service reliability, maintenance costs and system availability. This analysis was confirmed by Alstom engineers and experts. A PHM program should give solution to monitor the contact wire and the other identified components such as insulators, section insulators, and steady arm, carrier, feeder and power supply connection. The study of the failure modes and the failure mechanisms will allow us to select the mature PHM solution for the OCS.
4.6. Define Targets and Parameters to Monitor for the OCS
In this step, the failure modes and failure mechanisms of each critical component are studied. The aim is to identify and select the right parameters to monitor and select monitoring parameters. The Figure 7 gives an example of the target definition for the contact wire:
Figure 7. Target and parameters identification for OCS From experts knowledge we can determine three failure modes for the contact wire (CW):
- Mechanical breakage of the CW,
Table 4. Decision table for OCS critical component ranking. Components Service Reliability (ISR) Maintenance costs (IMC) Availability (IA) CI Contact wire 3 3 3 9 Insulator 2 2 0 4 Section insulator 0 1 2 3 Steady arm 0 1 0 1 Feeder 0 1 0 1 Messenger wire 0 1 0 1 Power supply connections 0 1 0 1 Support 0 0 0 0 Suspension equipment 0 0 0 0 Tensioning equipment 0 0 0 0
- Sag on the contact wire due to excessive CW dilatation, - Bad fitting of a CW.
The sag of the CW due to its dilatation can be caused by extreme weather conditions or tensioning device failure. In order to monitor this failure, a target is set up to monitor weather and tensioning device.
Bad fitting of the CW can be caused by an installation issue, improper plans or mounting diagrams. It can also be caused by failure of supports or steady arms. In the context of PHM a continuous monitoring system for the height and the stagger of the catenary can be a solution to detect this failure. Moreover monitoring cameras for cantilevers and supports can be installed in trains in order to track supports defects.
Wear of the CW can be local or global and can lead to the breakage of the contact wire. From the literature (Bucca & Collina, 2015) the wear of the CW is due to a contribution of three physical phenomena: mechanical wear due to friction, electrical wear due to current flow at the contact area between the CW and the pantograph stripes, and abrasion due to electrical arcs. For wear mechanism we can define parameters to monitor as shown in the Figure 7. Based the on these monitoring parameters a mature prognostics and diagnostics solution can be selected for the CW.
5. CONCLUSION
The main contribution of this article is the proposal of a methodology for components criticality determination regarding a PHM program deployment. The methodology is based on the analysis of the criticality of each component or sub-system through three main objectives: increase service reliability, decrease cost impact of critical component, and increase system availability. The methodology was applied to the OCS system which is a large-scale distributed system and the procedure to select the monitoring parameters and identify diagnostics and prognostics technology was presented. The procedure can be applied to other type of systems and his advantage is to give more impact benefits for a PHM system deployment as the critical components are identified through different objectives. Moreover, the methodology can be extended by integrating a more efficient cost analysis based on the life cycle cost of the system and more efficient methodologies for availability analysis.
REFERENCES
Avizienis, A., Laprie, J.-C., Randell, B., & Landwehr, C. (2004). Basic concepts and taxonomy of dependable and secure computing. IEEE Transactions on
Dependable and Secure Computing, 1(1), 11–33.
Bucca, G., & Collina, A. (2015). Electromechanical interaction between carbon-based pantograph strip and
copper contact wire: A heuristic wear model.
Tribology International, 92, 47–56. http://doi.org/10.1016/j.triboint.2015.05.019
ISO/IEC (2003). Dependability management – Part 3-1: –
Application Guide – Analysis techniques for dependability – Guide on methodology (ISO/IEC 60300-3-1:2003).
Jardine, A. K. S., Lin, D., & Banjevic, D. (2006). A review on machinery diagnostics and prognostics implementing condition-based maintenance.
Mechanical Systems and Signal Processing, 20(7),
1483–1510.
http://doi.org/10.1016/j.ymssp.2005.09.012
Lu, X., Shan, S., Tang, G., & Wen, Z. (2016). Survey on the Railway Telematic System for Rolling Stocks. In Y. Qin, L. Jia, J. Feng, M. An, & L. Diao (Eds.),
Proceedings of the 2015 International Conference on Electrical and Information Technologies for Rail Transportation (Vol. 378, pp. 645–656). Berlin,
Heidelberg: Springer Berlin Heidelberg. Retrieved from http://link.springer.com/10.1007/978-3-662-49370-0_67
Massat, J. (2007). Modélisation du comportement dynamique du couple pantographe-caténaire.
Application à La Détection de Défauts Dans La Caténaire [Simulation of Pantograph-Catenary Dynamic interaction–Application to Catenary Defect Detection]. Ecole Centrale de Lyon [doctoral Thesis].
Mathew, S., Das, D., Rossenberger, R., & Pecht, M. (2008). Failure mechanisms based prognostics. In Prognostics
and Health Management, 2008. PHM 2008. International Conference on (pp. 1–6). IEEE.
Mosallam, A., Medjaher, K., & Zerhouni, N. (2015). Component based data-driven prognostics for complex systems: Methodology and applications. In Reliability
Systems Engineering (ICRSE), 2015 First International Conference on (pp. 1–7). IEEE.
Retrieved from
http://ieeexplore.ieee.org/xpls/abs_all.jsp?arnumber=7 366504
SNCF Open Data. (n.d.). Retrieved August 26, 2016, from https://data.sncf.com/
Tixier, J., Dusserre, G., Salvi, O., & Gaston, D. (2002). Review of 62 risk analysis methodologies of industrial plants. Journal of Loss Prevention in the process
industries, 15(4), 291-303.
Uckun, S., Goebel, K., & Lucas, P. J. (2008). Standardizing research methods for prognostics. In Prognostics and
Health Management, 2008. PHM 2008. International Conference on (pp. 1–10). IEEE.
UIC, UIC 791-1: Maintenance guidelines for overhead
contact lines, 1st edition of 2006. ISBN 2-7461-1093-8
Wang, L., & Nee, A. Y. C. (Eds.). (2009). Collaborative
Design and Planning for Digital Manufacturing.
London: Springer London. Retrieved from http://link.springer.com/10.1007/978-1-84882-287-0
BIOGRAPHIES
Mehdi Brahimi got an M.S. degree diploma from National Institute in Mechanics and Microtechnologies, Besançon in 2014. He is actually preparing a PhD thesis at Franche-Comté University, in Besançon (France) sponsored by Alstom where he is working as a research engineer. He is engaged in research on railway infrastructure failure prognostics at the FEMTO-ST institute, and Alstom. Kamal Medjaher is Full Professor at Tarbes National School of Engineering (ENIT), France, since February 2016. He conducts his research activities within the Production Engineering Laboratory (LGP). Before this position, he was Associate Professor at the National Institute of Mechanics and Microtechnologies in Besançon, France, from September 2006 to January 2016. After receiving an engineering degree in electronics, he received his MS in control and industrial computing in 2002 at the “Ecole Centrale de Lille” and his PhD in 2005 in the same field from the University of Lille 1. Since September 2006, Kamal Medjaher leads research works in the field of Prognostics and Health Management of industrial systems.
Noureddine Zerhouni received his engineering degree from National Engineers and Technicians School of Algiers (ENITA) in 1985. After a short period in industry as an engineer, he received his Ph.D. Degree in Automatic Control from the Grenoble National Polytechnic Institute in 1991. In September 1991, he joined the National Engineering School of Belfort (ENIB) as Associate Professor. Since September 1999, Noureddine Zerhouni is a Professor at the National Institute in Mechanics and Microtechnologies, Besançon. He is now the head of AS2M Department within FEMTO-ST Institute. His main research activities are concerned with intelligent maintenance systems and e-maintenance. Professor Noureddine Zerhouni has been and is involved in various European and National projects on intelligent maintenance systems.
Mohammed Leouatni received his engineering degree from National Institute in Mechanics and Microtechnologies, Besançon in 2007. He started his career as a design engineer in 2008 for Alstom Transport. He is now a railway dynamic manager which is responsible of structuration, management and organization of Alstom expertise around the current collection competencies.