HAL Id: hal-03110506
https://hal.archives-ouvertes.fr/hal-03110506
Submitted on 14 Jan 2021
HAL is a multi-disciplinary open access
archive for the deposit and dissemination of
sci-entific research documents, whether they are
pub-lished or not. The documents may come from
teaching and research institutions in France or
abroad, or from public or private research centers.
L’archive ouverte pluridisciplinaire HAL, est
destinée au dépôt et à la diffusion de documents
scientifiques de niveau recherche, publiés ou non,
émanant des établissements d’enseignement et de
recherche français ou étrangers, des laboratoires
publics ou privés.
Prognostics and health management for an overhead
contact line system - A review
Mehdi Brahimi, Kamal Medjaher, Mohammed Leouatni, Noureddine Zerhouni
To cite this version:
Mehdi Brahimi, Kamal Medjaher, Mohammed Leouatni, Noureddine Zerhouni. Prognostics and health
management for an overhead contact line system - A review. International Journal of Prognostics and
Health Management, Prognostics and Health Management Society, 2017, 8, pp.0. �hal-03110506�
OATAO is an open access repository that collects the work of Toulouse
researchers and makes it freely available over the web where possible
Any correspondence concerning this service should be sent
to the repository administrator:
tech-oatao@listes-diff.inp-toulouse.fr
This is an author’s version published in: http://oatao.univ-toulouse.fr/19725
To cite this version:
Brahimi, Medhi and Medjaher, Kamal and Leouatni, Mohammed
and Zerhouni, Noureddine Prognostics and health management for
an overhead contact line system - A review. (2017) International
Journal of Prognostics and Health Management. ISSN 2153-2648
Official URL: http://www.phmsociety.org/node/2253
Prognostics and Health Management for an Overhead Contact Line
System - A Review
Mehdi Brahimi1, Kamal Medjaher2, Mohammed Leouatni3, and Noureddine Zerhouni4 1,4Femto-st Institute, AS2M Department, Besanc¸on, 25000, France
mehdi.brahimi@femto-st.fr noureddine.zerhouni@femto-st.fr
2Production Engineering Laboratory (LGP), INP-ENIT, Tarbes, 65000, France kamal.medjaher@enit.fr
1,3Alstom, Saint-Ouen, 93400, France mehdi.brahimi@alstomgroup.com mohammed.leouatni@alstomgroup.com
ABSTRACT
The railway industry in European countries is standing a significant competition from other modes of transportation, particularly in the field of freight transport. In this competitive context, railway stakeholders need to modernize their products and develop innovative solutions to manage their asset and reduce operational expenditures. As a result, activities such as condition-based and predictive maintenance became a major concern. Under those circumstances, there is a pressing need to implement prognostics and health management (PHM) solutions such as remote monitoring, fault diagnostics techniques, and prognostics technologies. Many studies in the PHM area for railway applications are focused on infrastructure systems such as railway track or turnouts. However, one of the key systems to ensure an efficient operability of the infrastructure is the overhead contact line (OCL). A defect or a failure of an OCL component may cause considerable delays, lead to important financial losses, or affect passengers safety. In addition maintaining this kind of geographically distributed systems is costly and difficult to forecast. This article reviews the state of practice and the state of the art of PHM for overhead contact line system. Key sensors, monitoring parameters, state detection algorithms, diagnostics approaches and prognostics models are reviewed. Also, research challenges and technical needs are highlighted
Mehdi Brahimi et al. This is an open-access article distributed under the terms of the Creative Commons Attribution 3.0 United States License, which permits unrestricted use, distribution, and reproduction in any medium, provided the original author and source are credited.
1. INTRODUCTION
These last years, railway industry made heavy investments on the digitalization of its products and services. This should be a considerable lever for product modernization and a response to the concurrence from other types of transportation. The digitalization can have a great impact in multiple segments such as train control or signaling and especially in maintenance policies for both rolling stock and rail infrastructure. This trend can enable railway operators to provide better customer service and reduce operational expenditures, particularly in Europe, where the harmonization and the liberalization of the rail market are continuously increasing cost pressure on railway operators. In addition, this is a chance for railway manufacturers to develop new products and services in an increasingly competitive global market. Consequently, condition-based maintenance and predictive maintenance are seen as the major fields of digital technologies applications aiming maintenance costs reduction and a better service reliability. The Prognostics and Health Management (PHM) is a cutting-edge discipline, at the core of different technologies, which aims to afford solutions for asset monitoring, algorithms for health assessment, fault diagnostics, and failure prognostics, as well as decision optimization and Human Machine Interface development. Hence, in current railway context, the use of PHM solutions can help to deploy efficient condition-based and predictive maintenance policies. This will enable the operators meeting industrial challenges such as high service reliability, low operational expenditures, and high asset availability.
techniques for the different railway subsystems. Most of these solutions are based on existing PHM technologies fitted for rolling stock components such as bearings, railcar wheels or brakes. In the area of infrastructure systems, point machines are one of the main subjects of study. In this paper, we will provide a review of key enablers for the deployment of a PHM solution for an OCL system. Developing such technologies, in the railway field, need to address the state of art and the state of practices for the OCL system. For this purpose, the section 2, gives a brief overview of the existing PHM solutions in the railway industry. Section 3 reviews the main steps for PHM solution deployment. Section 4 describes the OCL system, its most critical components, and their failure modes. Then, we present the state of practices for OCL monitoring in sections 5 and 6. In section 7 we address a review of advanced data analytics and signal processing techniques for OCL failure detection and diagnostics. Section 8 focus on OCL contact wire (CW) wear prognostics. In section 9 insights are given for decision-making step, based on prognostics and diagnostics data. Finally, we conclude in section 10.
2. PHMIN THERAILWAYINDUSTRY
Railway operators need new means to drive maintenance, enhance service reliability and reduce operational costs. This implies investments in new solutions and products which can give asset’s current state and enable in-line data capture and events processing. In this context, several PHM solutions have been developed. The following section presents some of the existing PHM solutions in the market.
2.1. Current Development of PHM in Railway Industry Recent years have seen a keen interest in monitoring systems, diagnostics and prognostics algorithms, and decision support solutions for railway maintenance and fleet management. This trend began with the deployment of several remote monitoring products for rolling stock systems. In 2006, ALSTOM launched a remote monitoring system called TrainTracer (Alstom, 2017) which aims to track the state of each train during its operation. TrainTracer captures data from multiple sensor sources coupled with GPS localization allowing a continuous monitoring of the train. This tool was completed in 2008 by ”eTrain”, a data collection system which enables train-to-ground data transmission networks and a ground processing system. In the same way, Siemens proposed a solution called EFLEET composed of a set of wireless data transmission, remote-monitoring and analysis solutions dedicated to rolling stock. Similarly, GE developed in early 2000 a remote monitoring system and fault diagnosis system called RM&D, including the real-time status, performance information, GPS positioning and environmental data (Lu, Shan, Tang, & Wen, 2016). The main purpose of these products is to to capture and store data
remotely from a fleet of vehicles which enables to set up a condition-based maintenance.
Later, a new type of solutions has appeared on the market dedicated to predictive maintenance. Orbita, a Bombardier Transportation solution, can generate maintenance requirements automatically from different sensors by gathering data from remote sensors installed on different sub-systems of the rolling stock and achieving data analytics for fault diagnostics and prediction (Le Mortellec, Clarhaut, Sallez, Berger, & Trentesaux, 2013). HealthHub (Alstom, 2016) is a predictive maintenance solution proposed by Alstom which makes it possible to determine the status of rolling stock, infrastructure and signaling systems automatically. This tool includes TrainTracer for rolling stock sub-systems monitoring, TrainScanner, a diagnostics portal which is capable to measure wheels condition, brake pads, pantograph strips wear and check the train integrity. HealthHub includes also TrackTracer, a set of monitoring systems for railway track, and CatenaryTracer, a solution for OCL monitoring, these two solutions can be integrated within an operational vehicle. In addition, data provided from different sources are sent to ALSTOM’s Cloud platform in order to apply advanced algorithms for diagnostics and failure prediction. In the same trend, Siemens proposes Railigent (Railigent - Digital Services, 2017), a remote monitoring system which is capable to transmit data from infrastructure and vehicle systems to terrestrial terminals in real time. This solution is completed by a single platform called Sinalytics (Gaus & Kayser, 2016) for remote analytics and maintenance services including railway, energy and data models to predict and prevent faults and energy consumption analysis.
The objective of deploying such tools is, at first, to provide solutions to gather an important amount of data from different components and subsystems and store them into a cloud solution in order to enhance analysis algorithms to achieve a better condition monitoring of an asset and automatic advisory generation. Combining these different technologies will constitute a PHM system for each monitored component or sub-system.
2.2. Beyond the Current Technology
At least a decade ago, rolling stock and infrastructure maintenance policies were based essentially on planned inspections and experts’ knowledge. Investments in remote monitoring technologies is allowing an evolution of the traditional preventive maintenance policies to a condition-based and predictive maintenance. For this purpose, PHM for railway systems can provide key tools to meet the railway industry needs, namely, safety, service reliability, and economics. A way to achieve PHM implementation is to adapt the existing PHM solutions to
railway industry. Therefore, the available PHM products for railway are deployed gradually.
The railway manufacturers initially invested on remote monitoring solutions for train subsystems such as doors, brakes, HVAC, toilets, engines, etc. Thereafter, data analytics with cloud computing solutions were deployed. The trend is currently extending PHM to the other sub-systems of the rolling stock, and infrastructure. Currently, railway manufacturers have to design specific monitoring systems for infrastructure. One of the solutions considered is to design monitoring systems integrated within operating trains for infrastructure monitoring. However, it may be difficult to manage data acquisition within different trains velocity and operational conditions, particularly in the case of infrastructure systems. In fact, the infrastructure is generally maintained by operators, which use dedicated inspection trains. This capability falls within the specialized inspection companies such as MER-MEC, Eurailscout, and DMA companies, or operators trains dedicated to monitoring track condition and OCL such as ”Doctor Yellow” a high-speed train used on the Japanese high-speed network for the Shinkansen (”Bullet Train”), and the IRIS 320 for SNCF (French National Railway Corporation).
All things considered, designing a PHM solution for infrastructure components need a global awareness of practices and application characteristics. The following paragraphs address the key state of practices and state of art of PHM techniques for OCL.
3. DESIGN CONTEXT OF A PHM SOLUTION FOR AN
OCL
A successful implementation of a PHM program has to meet important constraints related mainly to PHM objectives and asset specificity. The OCL system is geographically extended. It is composed of a large population of standardized components and is considered as a large-distributed system. It is subject to an evolving environment and different operational conditions. Consequently, an adapted architecture has to be set up for such large-scale assets. A PHM system architecture for an OCL system is proposed in (Brahimi, Medjaher, Leouatni, & Zerhouni, 2016) considering trains equipped with data acquisition systems, which enable infrastructure monitoring. The proposed architecture addresses the constraints related to the interacting components of both the rolling stock and the OCL for data capture. In addition to asset characteristics, PHM objectives can be related to different topics. For the operators, a main objective is to generate alerts in real time and promptly submitting it for immediate intervention. More generally, a PHM system for an OCL has to deal with three main objectives:
• use a minimum number of dedicated sensors to collect
data and deploy appropriate data collection facilities, • access, monitor and manage the system health status
remotely with adapted algorithms and manage reference models based on the collected data and operational conditions. This objective depends on whether diagnosis is achieved off-board or on-board (Le Mortellec et al., 2013),
• propose appropriate advise on the maintenance policy based on the state of health of the system
PHM systems implementation strategies have been discussed by various researchers (Uckun, Goebel, & Lucas, 2008; Kumar, Torres, Chan, & Pecht, 2008; Saxena et al., 2010; Lee et al., 2014; Lamoureux, Mass´e, & Mechbal, 2015). (Kumar et al., 2008) addressed a general description of a hybrid approach implementation for electronic products. (Lee et al., 2014) proposed a general methodology for rotating machinery. These two contributions present a general description of the requirements for each step of a PHM program: (1) Data acquisition, (2) Data processing, (3) Health Assessment, (4) Diagnostics module, (5) Prognostics module, and (6) Decision. Other methodologies take a broader view and present a general process dealing with system requirements, objectives, and validation process (Saxena et al., 2010; Lamoureux et al., 2015). Lately, (Aizpurua & Catterson, 2016) formalized a generic approach called ADEPS (Assisted Design for Engineering Prognostic Systems) for systematic implementation of a prognostics solution. This approach allows the verification and validation of design requirements, but also prognostics impact assessment based on system engineering and reliability engineering analysis. More generally, the proposed approaches for PHM system design share common characteristics that can be broadly summarized as follows: 1. Definition of the requirements and objectives: this step
often results from a cost-benefit analysis of a PHM system development regarding defined objectives. 2. Identification of a subset of components to be monitored:
this step relies on critical components identification with respect to defined objectives. Hazard analysis can be used in order to select the targeted components.
3. Definition of physical parameters to be monitored: these parameters are related to failure mechanisms and modes of the critical components.
4. Design of the PHM system architecture and design of hardware and software solutions (Saxena et al., 2010): this step consists of designing the different modules of a PHM program. It depends on the approach chosen for prognostics and diagnostics tasks. But also, on the available data and the accuracy of available models. 5. Integration of the developed hardware and software
Figure 1. A high-speed pantograph and its main components. level of each component and then at a system level. 6. Validation and verification of the system: the validation
and maturation of prognostics (Mass´e, Hmad, & Boulet, 2012) is carried out during this step.
In the proposed design methodology, the steps 2, 3 and 4 need to study the supervised system and review the state of practices. The following sections present the main technologies and key methods used through each discipline of a PHM program: data capture, detection, diagnostics, prognostics and advisory generation for an OCL.
4. OCL CRITICALCOMPONENTS AND THEIRFAILURE
MODES
The OCL coupled with the pantograph form the current collection system. Its main function is to ensure a constant contact between the pantograph head (pan-head) and the OCL contact wire (CW) in order to keep an uninterrupted power supply to the train. The figures 1 and 2 (Adapted from (UIC, 2007)) show a definition of the two interacting systems. An OCL system is subject to multiple sources of faults during its life-cycle, mostly caused by a failure, a damage or a bad-fitting of a component. The OCL is a high availability system and has a design life cycle in exceeding 30 years. However, its failure can cause significant delays or cancellations resulting in large losses for the operators. For example, 150 million euros of losses due to an OCL incidents were recorded in 2005 by the SNCF (Massat, 2007). In addition, current OCL maintenance policies are based on preventive maintenance tasks, which involve planned inspections of the OCL leading to traffic interruptions, planning and overhauls issues. In this case, utilization of condition monitoring to reveal incipient faults can be considered as one way to schedule preventive maintenance and optimize maintenance costs. Consequently, identifying
Figure 2. A span schematic of the OCL system.
a subset of components to be monitored regarding their criticality and maintenance objectives is a key step for designing a PHM solution. In (Brahimi, Medjaher, Zerhouni, & Leouatni, 2016), a methodology for OCL critical component selection is presented, where the authors considers a PHM program deployment. The selection procedure is related to three objectives: service reliability, system availability, and maintenance costs. The following critical components and their failure modes and mechanisms are presented based on a previous work and Alstom’s experts’ knowledge.
4.1. OCL Contact Wire
The CW is the main component of an OCL. Its main function is to ensure current transmission to the train through sliding contact within pantograph strips. It is subject to two main failure modes: bad positioning and important wear. Additionally, the CW overhaul is the most-expensive cost of the OCL maintenance budget.
An excessive stagger or sag of the CW can lead to a pantograph dewirement (pantograph comes off the contact wire) which can result in the OCL destruction. A bad position of the CW can be caused by extreme weather conditions or bad equipment installation. Consequently, for safety reasons, infrastructure maintainers organize regular inspections to measure the height and the stagger of the CW.
During its life cycle, the contact wire is subject to wear due to environmental or operational parameters such as overheat, arcs, exceeding contact force and more generally the pantograph-catenary interaction. The CW wear estimation is done by the calculation of the ratio between the original section and the worn area of the CW. The threshold for its overhaul is fixed at 80% of the original CW section. Furthermore, it has been shown that the wear mechanism is due to the combination of three physical phenomena (Bucca
& Collina, 2009; Usuda, Ikeda, & Yamashita, 2011; Bucca & Collina, 2015) :
• Electrical contribution to wear. It is due to the current flow at the contact between the CW and collector strips. The power dissipation at the contact point involves a wear of both strips and CW. This contribution depends mainly on strips materials, and current levels and voltage. • The mechanical wear is generated by the friction and shocks caused during the interaction. This contribution depends on the hardness of collector strips, surface condition, contact force, train speed, and weather conditions.
• Electrical arcs are generated during a loss of contact between the CW and the pantograph. This power dissipation may cause an electrical erosion and fusion for both CW and pan-head strips.
4.2. Cantilever and Steady Arm
The OCL cables are normally supported from lineside masts by using cantilevers. The messenger wire and the CW are attached, respectively, to the stay tube (tie bar) and the steady arm. The cantilever is electrically insulated from the masts by using insulators (See Figure 3). The components that are in motion and mechanically loaded are the most sensitive to wear. Hence, the steady arm, linkages, and insulators are considered as the most critical. The insulators are generally made of glass or composite materials and has two main failure modes: mechanical breakage due to fatigue, and insulation failure due to environmental conditions (pollution contamination). The steady arms enable a dynamic upward movement of the contact wire during pantograph passing allowing a soft transition under OCL cantilevers. Its uplift should be sufficient in order to ensure a constant contact and not too important to avoid a pantograph ”dewirement”. As a consequence, the steady arm position is an important parameter for an effective operation and it is considered as an important parameter to monitor by the maintainers. In addition, leakages, tubes, brackets, and arms are subject to corrosion, which represents one of the main degradation mechanism of these components.
4.3. Droppers
The droppers are considered as critical components since the CW deflection and stagger depends on droppers lengths. Furthermore, the droppers ensure the mechanical damping of the CW during the pantograph-catenary interaction. They are mainly subject to mechanical fatigue or to claws unfastening due to OCL dynamic during operation. The Figure 4 shows a dropper failure due to fatigue.
Figure 3. A Cantilever and its main components.
Figure 4. Dropper failure caused by fatigue.
4.4. Masts
Masts are generally made of H-section of galvanized steel. Corrosion is the main degradation mechanism of the mast. It is checked regularly by maintainers by visual inspection or by using specific ultrasonic devices. However, there are no remote monitoring systems for masts inspection. By the same token, we would point out that there are no studies in the literature regarding corrosion monitoring for the OCL application.
5. MONITORINGDATA FOROCL
Data for PHM purpose can be classified within two main categories: monitoring data (the most relevant data for system behavior) and event data (maintenance tasks, overhauls date, etc.). Monitoring data for the OCL are mostly derived from safety constraints, system design requirements, and criteria for systems interoperability. These parameters are generally defined in international standards or country regulatory agency directives (CENELEC, 2012; IEC, 2013; EU, 2014). Theses standards define the comissioning tests and criteria for the OCL, and also for maintenance purpose. In (UIC, 2009) experts from different European operators and infrastructure maintainers address a review of maintenance and diagnostics methods for the OCL. Additionally, measurements are verified regarding safety limits which are often considered as maintenance thresholds.
parameters for OCL monitoring can be classified into two main categories: system monitoring data, and auxiliary data. Auxiliary parameters are related to operational or infrastructure information such as localization on the track, train velocity, temperature, wind speed and direction, the OCL design information (support number, claws, bridges and tunnels localization, rail switches, etc.). Monitoring data are those related to the system current condition, which fall into three categories: geometrical data, mechanical data, and electrical data.
5.1. Geometry Data
Geometry data are related to components positioning regarding design definition. The aim is to measure some lengths in order to detect and correctly assess any deviation from the safety limits and design definition. The main geometry parameters are height, stagger, and sag of the CW. These values are measured relatively to track position. The Measurement can be achieved in a static way (OCL is in its static state without pantograph interaction), or dynamically (pantograph-catenary interaction) with low contact force and train velocity. Nevertheless, some advanced solutions enable dynamic measurement with commercial speeds using a train mounted measurement system (Nezu et al., 2015). The sag value is checked regarding to a threshold value defined by standards that allow the trains to reach the desired speed. The stagger shall not exceed a limit value defined during the design in order to avoid pantograph ”dewirement” and cross-wind effect. The wear of the CW is considered as a geometrical parameter. The wear measurement aims to plan preventive maintenance tasks to ensure homogeneous wear of the wires until they reach their limit. Other parameters can be measured according to the maintenance policies of infrastructure operator.
5.2. Mechanical Data
Mechanical data are related to the pantograph-catenary interaction, in other words, they concern data used to assess the dynamic interaction of the current collection system. The contact force between the pan-head strips and the CW is one of the main mechanical parameters for current collection assessment. It can be described as a contribution of three forces (Kiessling, Puschmann, Schmieder, & Schneider, 2009): the static force applied by the pantograph to the OCL, the aerodynamic force which is proportional to the square of pantograph speed, and the inertial force of the pan-head during the interaction. The statistical values of the contact force are considered as the main criteria for current collection quality assessment (CENELEC, 2012; EU, 2014). As consequence, they are used for diagnostics purposes. The steady arm uplift produced by pantograph, the CW elasticity, as well as the pan-head accelerations are also
Table 1. Data for OCL monitoring.
Geometry Mechanical Electrical
Height and Stagger Contact force Arcing rate
Sag Acceleration
Wear
considered for condition monitoring. 5.3. Electrical Data
Electrical data are used to assess both electrical and mechanical performances, as well as OCL components degradations. Current and voltages at injection points allow energy performance evaluation of the OCL system regarding design definition. The thresholds for these values are defined in (CENELEC, 2012).
Electrical arcs are generated during a contact loss between the OCL contact wire and the pantograph contact strips. This phenomenon is used to assess the current collection quality and for diangostics purpose. Specific devices are used to detect arcs and estimate the contact loss duration and arcs intensity. An arcing rate is given by (CENELEC, 2013):
N Q = P
tarc
ttotal ∗ 100% (1)
where tarcis the duration of an arc exceeding 5 ms, and ttotal the time during which the value of the pantograph current exceeding 30% the nominal value. Thresholds for percentage of arcing N Q are defined for a given vehicle speed.
5.4. Summary
For a PHM purpose, one has to select the most relevant data related to critical components failure mechanisms or system abnormal behavior. Contact force, pan-head accelerations and arcing rate are the main parameters for interaction assessment. These parameters should give the necessary information about the current condition of the OCL. The wear of the CW is a key measure for maintenance tasks forecast and optimization. Comparatively, measurements such as height, stagger, and sag are necessary for safety purposes, however, they are not related to failure mechanisms.
Equally important, auxiliary data must be recorded to take into account different operational conditions, which are necessary for data processing. Finally, we address a summary of the most relevant parameters for fault diagnostics and prognostics purpose in the Table. 1.
6. SENSORS FOROCL MONITORING
In a PHM program, sensor selection step requires to take into consideration several parameters depending on PHM system architecture and host system configuration. In our case of
study, sensor selection depends mainly on the measurement strategy. If commercial vehicles are used for infrastructure monitoring, systems for data capture and data transmission have to meet constraints such as compact design, onboard memory, power management, data transmission software, and meeting rolling stock safety standards. Comparatively, a dedicated inspection vehicle has not to meet same constraints. (Tuchband, Cheng, & Pecht, 2007) reviewed different constraints to be taken into account for monitoring sensors in a PHM framework. The criteria can be related to parameters to be measured, sensors reliability, accuracy, operating range, sensor resolution, size, weight, and cost.
Recent developments in sensor technologies, such as Micro Electro Mechanical Systems (MEMS), ultrasonic sensors, acoustic emission sensors, lasers, etc., afford multiple solutions. In addition, the latest generation of wireless technologies, such as Bluetooth or WIFI, provide interesting solutions for data transfer. For current collection system monitoring, several technologies have been designed for data acquisition and monitoring. The following sections present a survey on current existing sensors for OCL inspection.
6.1. Mechanical sensors
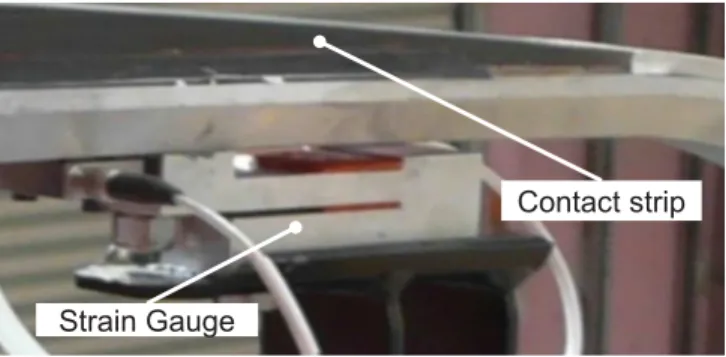
This category includes accelerometers as well as strain gauges; they are used mainly for mechanical parameters measurement defined in Table. 1. As explained in Section 5.2, the contact force can be seen as a combination of three contributions: static force, pan-head inertia, and aerodynamic force. The measurement of the inertial forces is carried out using an instrumented pantograph head. The head is equipped with force cells and accelerometers installed at pan-head suspensions (Kolbe, Baldauf, & Tiffe, 2001; Kusumi, Fukutani, & Nezu, 2006a). This allows measuring the force generated during the interaction. The Figure. 5 shows an example of a strain gauge installed within pan-head suspensions.
Similarly, pantograph aerodynamic forces are measured using strain gauges fixed by the means of wires between the bottom of the pantograph and the pan-head. The measurement is done during dynamic test in order to estimate the aerodynamic forces. It is then used to correct the global estimation of the contact force.
6.2. Optical sensors
For a large-distributed system such OCL, getting access to each of its components seems to be a hard task. For this reason, the measurement systems are mainly based on in-vehicle optical sensors, which allow measurement without physical contact. These sensors include technologies such as Laser Detection and Ranging (LIDAR) technology and laser diode beams as well as ultraviolet (UV) cameras. Most of these sensors are endowed with embedded processing
Strain Gauge
Contact strip
Figure 5. Strain gauge for contact force measurement. units for direct data processing. Generally, such systems are installed on vehicles roofs, or on a dedicated light rail vehicle. They can also be installed on fixed spots (masts, gantry, etc.).
6.2.1. UV cameras
During a contact loss between the pan-head and the OCL, an electric arc is generated. UV cameras are used in order to capture the emissions of copper material during arcing. A measurement methodology for this kind of sensor is defined in the standard EN 50317 (CENELEC, 2013). Several arcing systems based on UV cameras were developed by railway operators. Examples of such sensors are described in (Hayasaka, Shimizu, & Nezu, 2009) and (Bruno, Landi, Papi, & Sani, 2001).
6.2.2. LIDAR
LIDAR technology uses a beam of pulsed laser light to measure a distance from a target. It is often used for 3D scanning, navigation systems and to high-resolution maps drawing. Recently, several applications of LIDAR technology for railway infrastructure inspection purpose have emerged (Arastounia & Oude Elberink, 2016; Jwa & Sonh, 2015). It is used for 3D reconstruction of railway infrastructure systems. In this way, it allows OCL geometry inspection and broken component detection. Nevertheless, current accuracy sensors accuracy is not sufficient for automatic detection of abnormal components. In addition, the amount of data and processing time remains relatively high. This technology needs an onboard signal processing algorithm for an efficient detection and diagnostic and can be used for specific areas of the OCL such as overlaps between sections.
6.2.3. Laser Diodes Arrays
CW wear measurement is a key task for OCL maintainers. Sensors such laser-beam systems provide a high-accuracy of the wear. The system developped in (Shimada, Kohida, & Satoh, 1997) uses lasers scanning the whole CW area with a rotary mirror. The surface of the CW causes irregular reflection which is measured by a photoelectric transfer
element and is used to measure the duration of reflection. Then, the constant speed of the laser beam is used to estimate the duration of the reflection which is proportional to the CW thickness. These technologies are based on stereoscopy techniques for CW section image reconstruction. In addition, the use of laser technology allow daytime measurement. However, it requires a large capacity power supply and takes a lot of space in vehicle rooftop. This makes this kind of sensors unsuitable for commercial trains. This type of sensors can also be used to measure the CW position relative to a defined reference.
6.2.4. Area Scan Cameras
Linear or matrix CCD cameras combined with a light source and image processing algorithms are mainly used for CW position and wear measurement. (Borromeo & Aparicio, 2002) present a comparative analysis of measuring systems for CW wear and position. Most of the systems are based on image recognition and triangulation using CCD cameras for wear and position measurement (Torroja, Garcia, Aparicio, & Martinez, 1993; Borromeo & Aparicio, 2005; A. W. Shing & Pascoschi, 2006). Similarly, other classification algorithms are applied to high-speed CCD cameras videos (Petitjean, Heutte, Delcourt, & Kouadio, 2009) in order to detect objects missing or broken OCL components.
Linear area scan cameras or line scan cameras are generally used for pan-head tracking. The technology relies on white stripes placed on pan-head and image processing algorithms to measure pan-head position and accelerations, as well as contact force estimation. An example of this methodology is given in (Koyama et al., 2014).
6.2.5. Fiber Bragg Gratting
Fiber Bragg Grating (FBG) sensors use optical fibers containing, in a short section, a distributed Bragg reflector which allows through wavelengths analysis multiple applications such as temperature, pressure, and mechanical stress measurement. They present many advantages, they have a compact size and they can be used in a dense electromagnetic environment. For the OCL monitoring, this type of sensor was mainly used for contact force and pan-head acceleration measurement (Boffi et al., 2009; Wagner et al., 2014). Another application is their use for hotspots detection on OCL (Theune et al., 2010) as well as the steady arm uplift (Laffont et al., 2009). These sensors have numerous advantages for contact force measurement regarding their size and weight and electromagnetic compatibility. However, their sensitivity to temperature and calibration issues remain an obstacle for their deployment in commercial vehicles.
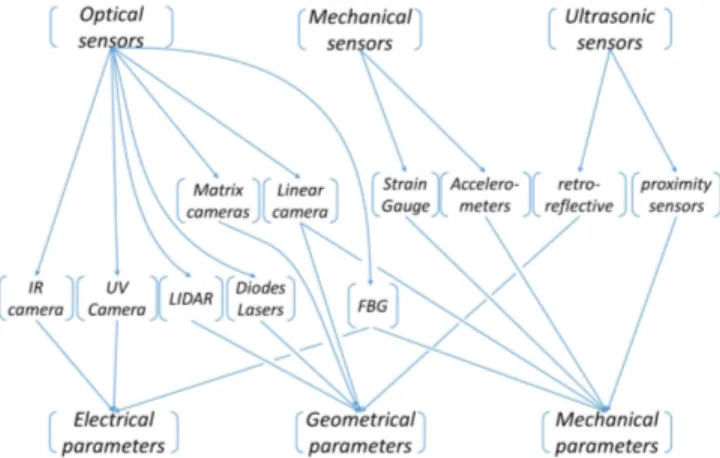
Figure 6. An illustration of the link between the sensor technology, the sensor type, and monitoring data.
6.2.6. Infra-red cameras
Thermal and infra-red cameras for OCL monitoring are mainly used for ”hot spots” detection. Knowing the sections of the OCL cables, where the temperature is elevated, can help to detect premature wear areas. In (Landi, Menconi, & Sani, 2006), a thermal camera is used to detect electrical arcs discharge resulting from the pantograph-OCL interaction.
6.3. Ultrasonic sensors
A reflective ultrasonic sensor capable to achieve measurement at up to 160 km/h was developed for CW height and stagger measurement relatively to the track position (Mualem, 1999). Another use of ultrasonic technology is for the CW crack detection due to material and which is patented by SNCF (Gasselin et al., 2015).
6.4. Summary
Monitoring systems for the OCL are mainly dedicated to CW position, wear estimation, mechanical behavior, and arcing detection and quantification. Knowing these parameters is necessary to carry out an efficient infrastructure management and maintenance based on asset condition.
Due to the specific environmental constraints of vehicle’s rooftop (High voltage, high current levels, wind, speed constrained), the optical sensors are broadly used in the field (See Figure. 6), since they allow non-contact measurements. Multiple optical technologies have been developed and tested by railway operators for the CW position measurement and wear estimation. However, there are no standard solutions for CW monitoring. A comparative study of these solutions, highlighting sensors reliability, precision, and data processing capabilities need to be addressed.
Strain gauges and accelerometers are used in order to assess the mechanical behavior of the pantograph-OCL interaction.
The development of this kind of solutions, mainly for contact force measurement, remains a topic of experts’ knowledge. Improvement of FBG sensors can be a key enabler to deploy embedded contact force measurement systems in pantographs.
More generally, sensors definition for OCL monitoring remains a railway operators competence. The sensors are often developed for specific inspection cars or mounted on an adapted auxiliary rail vehicle. There are some huge efforts to achieve to propose monitoring solutions embedded within operational vehicles, with the main objective of streaming data directly from the track to a data center. Additionally, sensors and data transmission requirements are not addressed in the literature.
7. DETECTION ANDDIAGNOSTICS
A fault can be defined as a deviation of a characteristic property or parameter of the system from its standard condition. In a PHM system the state detection module aims to detect a deviation from a standard behavior of a component or a sub-system based on monitoring data. More generally, detection can be completed with diagnostics analysis. When a fault is detected, diagnostics module achieves fault isolation by locating the fault to a specific component. Then, diagnostics system accomplishes fault identification by determining the root cause of the failure based on known fault symptoms.
Several classifications have been proposed for detection and diagnostics methods (Isermann, 1997; Chantier, Coghill, Shen, & Leitch, 1998; Venkatasubramanian, Rengaswamy, Yin, & Kavuri, 2003). In most cases, diagnostic methods are related to available knowledge and data. We can broadly classify diagnostics into data-driven and model-based models. For data-driven models, we distinguish qualitative methods and quantitative methods. Qualitative approaches include methods such as expert systems and trend modeling. Quantitative methods are based on pattern recognition techniques and AI approaches (Venkatasubramanian, Rengaswamy, Kavuri, & Yin, 2003) which use advanced classification algorithms for fault diagnostics, including principal component analysis (PCA), neural networks, self-organizing maps (SOM), support vector machines (SVM), k-nearest neighbors (KNN),etc.
For large-scale systems that compose the railway infrastructure, setting up a sophisticated supervisory control system is a cost and hard task. The OCL is a linear asset which is geographically distributed with a large number of components subject to external conditions and operational constraints. Hence, the monitoring function for such system is achieved by using regular inspections and measurements in order to supervise the system behavior. Consequently, the fault isolation for an OCL is defined as the localization of a
fault on an area of the OCL network and which component of OCL is faulty. Fault identification is defined as determining the component failure or fault. In this context, data-driven approaches seem well suited for this kind of application in order to transform monitoring data into an a priori knowledge of the system through feature extraction. In this way, most of the studies focus on feature extraction techniques for OCL diagnostics. There are three main areas of study: CW wear assessment based on the electric arcing phenomenon, faulty components diagnostics based on contact force measurement, and image processing for components assessment.
7.1. Related Works Based on Electric Arcing
Current collection system arcing can lead to important wear for both collector strips and CW. Consequently, the study of arcs can be a good indicator for CW wear status.
In 2001, investigations have been conducted by the Italian railway operator (Balestrino et al., 2001) in order to study the relationship between the CW contact surface condition and the electrical arcing. Based on the arcing measurements, it has been shown that sequences of continuous sparking are generated due to the so-called ”welding effect”. This effect generates hot spots and a micro-welding phenomenon on localized parts of the CW due to irregular sliding contact caused by the contact roughness. The occurrence of welding effect implies an important deterioration of the CW which is more important with higher speeds. Thereafter, a correlation between break arcs occurrence and traction current harmonics was revealed in (Bruno, Landi, Papi, Sani, & Violi, 2001). Based on these results, a methodology was proposed to assess the arcing phenomena and distinguish between a singular burst of arcing and the electric welding effect (Barmada, Landi, Papi, & Sani, 2003). The proposed methodology is based on Discret Wavelet Transform (DWT) using a Daubechies multiresolution wavelet analysis applied to traction current. The results showed that break arcs can be detected and localized only by using traction current. However, the welding effect was detected only using UV sensor. A signal processing approach is also used in (Huang & Chen, 2008) in order to detect arcs frequencies. A Fast Fourier Transform (FFT) is applied to the traction current. However, wide time windows induce information loss regarding the train location.
Later, researchers investigate the use of clustering techniques in order to assess current collection quality regarding contact loss. A SVM is trained using voltage and current levels data and photosensor information (Romano, Tucci, Raugi, & Barmada, 2014). The result has shown a correct detection rate of 80%. A fuzzy c-means and K-means unsupervised learning algorithms were applied in (Barmada, Tucci, & Romano, 2014a, 2014b; Barmada, Tucci, Menci, & Romano, 2016), based on extracted features from the traction current
and voltage. Based on test run data, the Dunn index calculation indicate that the best number of cluster for the K-means clustering algorithm should c = 4. A statistical analysis of the clustering results showed that all the arcs with a duration higher than 5 ms are localized in the first two clusters, with 93.5% of the longer arcs in the first one and 6.5% in the second cluster. The remaining clusters are related to the absence of arcs (arcs with a duration less then 5 ms), in particular, in the last cluster no current is measured. This approach allows a reliable detection and localization of arcs with a duration higher than 5 ms. Knowing that enable to localize and detect the local wear of the CW. In other words, achieving CW diagnostics.
In (Aydin, Celebi, Barmada, & Tucci, 2016), an enhanced feature extraction method is proposed, based on a mathematical morphology technique applied to current and voltage signals. The aim of the mathematical morphology is to enhance arcs frequencies components in the FFT spectrum of the traction current. Then, three SVM classifiers are trained based on different data and spectrum obtained from the feature extraction step. A fuzzy integral is applied to the output of the three classifiers. The whole performance of classification was about 96.31%.
7.2. Related Works Based on Contact Force
Several studies focused on pantograph-OCL mechanical behaviour monitoring (Kusumi, Fukutani, & Nezu, 2006b; Collina, Fossati, Papi, & Resta, 2007; Cho, Lee, Park, Kang, & Kim, 2010).. They are mainly related to the study of the relationship between OCL geometry irregularities and contact force in order to assess current collection quality. These studies shows a strong correlation is established between contact variations due to the OCL geometry and the contact force.
A diagnostics method for faulty components was proposed in (Massat, 2007) and is based on a pantograph-catenary interaction model. Dropper failure, splicers installed on the CW, and a faulty steady arm were the faulty conditions considered in this study. The methodology relies on the wavelet transform of the pantograph-catenary contact force. For each faulty condition, the defect signature is extracted from the contac-force to build an adapted wavelet. This wavelet is then stored in a database in order to be used for defect detection, localization and identification. For each adapted wavelet, corresponding to a specific defect, the continuous wavelet transform (CWT) is calculated in order to detect and localize the defect. A health indicator is built by calculating the maximum power of the wavelet coefficients. This method was, at first, apllied to pantograph-catenary simulation signals with a rate of 100% for detection. Based on these results, inline tests were held to validate the methodology on field data. The detection rate was about 66%
for defect were detected (EUROPAC, 2008). 7.3. Image Processing Techniques
Authors in (Petitjean et al., 2009; Montreuil, Kouadio, Petitjean, Heutte, & Delcourt, 2008) proposed a methodology to retrieve dropper information based on high-speed cameras images. A pattern recognition system, based on k-nearest neighbors algorithm (k-NN) algorithm, is trained to identify the components of interest (dropper). Then, a Hidden Markov Model (HMM) is used in order to verify components consistency and to detect OCL stave model thanks to a database model. This method allowed to identify 95.7% of droppers from videos.
An application of computer vision techniques is proposed in (Wang, Sun, Gu, & Wang, 2011) in order to measure steady arm angle and detect faulty positions. This method shows good results for a speed up to 400 km/h.
7.4. Summary
The pantograph-catenary interaction can provide multiple information about OCL geometry and its components conditions. The electrical arcing phenomenon was largely studied within diagnostics aim, it enables to assess CW and pantograph strips conditions using advanced signal processing techniques and machine learning algorithms applied to traction current and voltage. The study of the contact force is another important topic of research. Existing software for pantograph-catenary interaction modeling allow a better understanding of OCL design impact on contact force and, thus, developing model-based approaches for fault detection and diagnostics. However, these models need to be enhanced with components degradation models and parameters uncertainties for model-based approaches development. More field data and tests can be considered to achieve this aim. More broadly, as for arc detection, the use of machine learning techniques applied to contact force can be a key enabler for diagnostics models development. Another way to detect faulty components is the use of image processing techniques applied to onboard cameras videos. These approaches need to be improved and can be limited to high-speed applications. In addition, vision techniques need important data storage capabilities and can be time-consuming for processing.
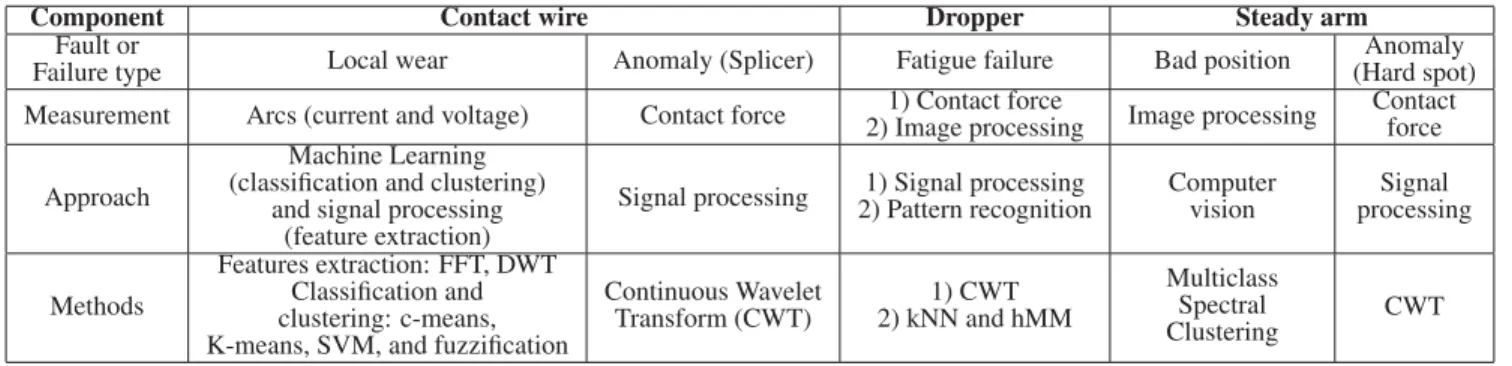
Finally, the Table 2 summarizes all the approaches and the target component for fault detection and diagnostics approaches for the OCL.
8. PROGNOSTICS
Prognostics approaches can be classified broadly into three categories: physics-based, data-driven and hybrid approaches (Gouriveau, Medjaher, & Zerhouni, 2016).
Table 2. Fault detection and diagnostics approaches for the OCL.
Component Contact wire Dropper Steady arm
Fault or
Failure type Local wear Anomaly (Splicer) Fatigue failure Bad position
Anomaly (Hard spot) Measurement Arcs (current and voltage) Contact force 2) Image processing1) Contact force Image processing Contactforce
Approach
Machine Learning (classification and clustering)
and signal processing (feature extraction)
Signal processing 2) Pattern recognition1) Signal processing Computervision processingSignal
Methods
Features extraction: FFT, DWT Classification and clustering: c-means, K-means, SVM, and fuzzification
Continuous Wavelet Transform (CWT) 1) CWT 2) kNN and hMM Multiclass Spectral Clustering CWT
Physics-based (or Model-based techniques) rely on the failure mechanism to build an explicit model of the degradation model. This approach is used when there are not enough time-to-failure data but a good knowledge of the physics of the system and its failure modes are available. However, the development of this kind of approaches needs to make assumptions that limit the applicability of the developed models.
Data-driven approaches use available data in order to capture the relationships between the degradation and system’s extracted information. These approaches can be simpler to set up than physics-based ones. However, they often need an important quantity of time-to-failure data and neglect the physical behavior leading to failures, which can be a lack for an advisory generation.
Hybrid approaches are seen as a combination of data-driven and physics-based approaches. They can be achieved in two ways: by fusion of results of the data-driven and physics-based approaches or the use of a data-driven approach in order to tune physics-based model parameters. In our case of study, contributions have been proposed to forecast the wear of the CW. Both data-driven and physics-based approaches were studied for CW wear prediction.
In (Bucca & Collina, 2015), a heuristic model of wear is proposed based on previous tribology studies and test rig data. The model relies on three contributions of wear for the contact wire: mechanical contribution due to friction, electrical contribution due to energy dissipation relative to the current flow and arc contribution during contact loss between pantograph and OCL. The contribution of each wear phenomena is fitted by using test data provided by a dynamic test bench for pantograph-OCL interaction (Bucca & Collina, 2009). With the contact force and the current inputs provided from a pantograph-catenary simulation software, the model is used to estimate the wear of CW for a certain period of time. A correlation between wear measurements and the wear estimation obtained from the model were established.
A data-driven approach is developed in (W. C. Shing, 2011). This work is based on monitoring data collected during two years on the same line. The data includes OCL geometry parameters, contact force, and traction current. A statistical analysis on the data allows to select a set of parameters as an input of an artificial neural network (ANN) model in order to establish a wear prediction model. The correlation score obtained for the trained model was about 0.7 on test data. Additionally, the model was used to characterize parameters influence on wear evolution.
These approaches use different sources of data in order to assess the OCL health state. The use of arcs measurement allows detecting the welding effect on the contact wires due to long arcs. The processing of contact force was used to detect a geometrical defect or broken components. Furthermore, models for the contact wire wear were developed based on data-driven or physics based approaches. Combining all these techniques and validate and assess them may lead to a validation of a contact wire wear prediction model and diagnostics methods
9. DECISION FORPREDICTIVEMAINTENANCE
Few contributions addressed the decision part of PHM dealing with maintenance scheduling and optimization, based on prognostics and diagnostics information. However, some approaches have been proposed for rail track and railway switches maintenance.
(Letot, Soleimanmeigouni, Ahmadi, & Dehombreux, 2016) addressed the problem of rail track tamping interventions scheduling. A cost model has been proposed for the optimization of the maintenance time, for a single track section, based on three thresholds, namely, comfort penalty, speed reduction penalty and track closure (failure). Before that, a prognostics process for the track geometry relying on a stochastic Wiener process was proposed. Finally, an adaptive opportunistic maintenance strategy has been defined for the whole track line composed of several track sections, each of them being associated with its own degradation evolution. In this case, a grouping strategy is used to decrease
the number of interventions based on the optimal time for maintenance for each track section. Authors showed that maintenance actions based on prognostics information and cost optimization gave better results than the systematic one. In (Camci, 2014) proposed a methodology to schedule the maintenance of geographically distributed assets in the case of railway switches. The approach is based on the Travelling Maintainer Problem (TMP) which aims to find the most cost-effective routing for the maintenance operator to visit assets based on RUL information. The TMP is formulated by the assumption that each location can be visited several times or not at all during the maintenance horizon. Hence, an optimization problem is proposed for maintenance scheduling, it is based on the minimization of an elaborate cost function, composed of the expected failure cost, the maintenance cost, and the travel cost. A genetic algorithm and a Particle swarm have been developed to determine a maintenance schedule for a fixed number of maintenance tasks. However, the approach was practically limited due to the high number of assets which generate an important computational time and the considered work duration for maintenance operators. In (Camci, 2015), the author proposed an enhanced procedure by introducing a penalty function for the work duration that allows limiting working hours in a day. In addition, an enhanced genetic algorithm was proposed for the case where each location can be visited at least and at most once.
In summary, similar approaches can be applied to the OCL which is a geographically distributed asset, and necessitate to schedule maintenance actions based on different criteria that can be defined, for the OCL, as current collection quality (speed reduction), travel cost and failure cost. In addition, merging both rolling stock condition and infrastructure data can afford better-informed decisions.
10. CONCLUSION
In current railway industry context, developing a PHM program for condition-based and predictive maintenance purpose is a key challenge for competitiveness. Designing a PHM solution for the OCL system, which is geographically distributed, is not a common task comparing to usual studied systems in PHM field. To this aim, a comprehensive review of means for OCL PHM deployment was conducted. System components and failure modes were reviewed, and monitoring solutions needs were addressed. Overall, this paper identifies key parameters and sensors for OCL monitoring, as well as principal contributions from the literature for OCL diagnostics and insights for contact wire wear prediction. Lastly, we reviewed briefly the decision aspects for railway infrastructure.
While OCL system is well known by railway experts and engineers, several obstacles to PHM development need to
be highlighted. Sensor for OCL monitoring needs to be standardized. Furthermore, a comparative study must be conducted regarding uncertainty, reliability and costs. CW diagnostics using arc measurement is the main topic of research and important development has been realized thanks to the use of machine learning techniques. Detection and diagnostics of faulty components using contact force need more research development. The use of data-driven techniques based on contact force should be explored. Moreover, image processing techniques are still limited due to data storage issues and operational parameters such as train speed. A physics-based model for CW wear prediction is available. However, this model does not take into account all operational parameters. Combining a data-driven approach with this model should be a key enabler for wear prognostics. Finally, implementation of PHM methods for an OCL needs real-world operating systems data in order to accelerate diagnostics and prognostics research.
REFERENCES
Aizpurua, J. I., & Catterson, V. M. (2016, July). Adeps: a methodology for designing prognostic applications. In I. Eballard & A. Bregon (Eds.), Proceedings of the Third European Conference of the Prognostics and Health Management Society 2016 (pp. 86–100). Bilbao: PHM Society.
Alstom. (2016). Transport services for your rail system. Brochure. Retrieved 2017-09-03, from http:// www.alstom.com/Global/Transport/ Resources/Documents/brochure2014/ Services%20-%20Brochure%20-% 20English.pdf?epslanguage=en-GB Alstom. (2017). Effective maintenance the
right response to operators needs. Retrieved 2017-09-03, from http://www.alstom.com/ products-services/product-catalogue/ rail-systems/services/maintenance/ Arastounia, M., & Oude Elberink, S. (2016, December).
Application of Template Matching for Improving Classification of Urban Railroad Point Clouds. Sensors, 16(12), 2112. doi: 10.3390/s16122112 Aydin, I., Celebi, S. B., Barmada, S., & Tucci, M.
(2016, August). Fuzzy integral-based multi-sensor fusion for arc detection in the pantograph-catenary system. Proceedings of the Institution of Mechanical Engineers, Part F: Journal of Rail and Rapid Transit. doi: 10.1177/0954409716662090
Balestrino, A., Bruno, O., GIORGI, P., LANDI, A., PAPI, M., SANI, L., & Giuseppe, A. (2001). Electric welding effect: detection via phototube sensor and maintenance activities. In CDROM of the World Congress on Railway Research, Koln(pp. 19–23).
multiresolution analysis for monitoring the occurrence of arcing on overhead electrified railways. Proceedings of the Institution of Mechanical Engineers, Part F: Journal of Rail and Rapid Transit, 217, 177–187. Barmada, S., Tucci, M., Menci, M., & Romano, F. (2016,
January). Clustering techniques applied to a high-speed train pantograph-catenary subsystem for electric arc detection and classification. Proceedings of the Institution of Mechanical Engineers, Part F: Journal of Rail and Rapid Transit, 230(1), 85–96. doi: 10.1177/ 0954409714528486
Barmada, S., Tucci, M., & Romano, F. (2014a). Arc Detection and Classification in Pantograph Catenary Systems by the use of Clustering Techniques. In Proceedings of the Second International Conference on Railway Technology: Research, Development and Maintenance, Ajaccio, France(pp. 1–12).
Barmada, S., Tucci, M., & Romano, F. (2014b). Hierarchical Clustering applied to Measured Data Relative to Pantograph-Catenary Systems as a Predictive Maintenance Tool. International Journal of Railway Technology, 3(4), 23–41. doi: 10.4203/ijrt.3.4.2 Boffi, P., Cattaneo, G., Amoriello, L., Barberis, A., Bucca,
G., Bocciolone, M. F., . . . Martinelli, M. (2009, June). Optical fiber sensors to measure collector performance in the pantograph-catenary interaction. IEEE Sensors Journal, 9(6), 635–640. doi: 10.1109/JSEN.2009 .2020244
Borromeo, S., & Aparicio, J. (2005). Application of computer vision systems to the inspection of contact wire wear. WIT Transactions on The Built Environment, 77.
Borromeo, S., & Aparicio, J. L. (2002). Automatic systems for wear measurement of contact wire in railways. In IECON 02 [Industrial Electronics Society, IEEE 2002 28th Annual Conference of the] (Vol. 4, pp. 2700–2705). IEEE.
Brahimi, M., Medjaher, K., Leouatni, M., & Zerhouni, N. (2016). Development of a prognostics and health management system for the railway infrastructure -Review and methodology. In Prognostics and System Health Management Conference (phm-chengdu), 2016 (pp. 1–8).
Brahimi, M., Medjaher, K., Zerhouni, N., & Leouatni, M. (2016). Critical components selection for a prognostics and health management system design: an application to an overhead contact system. In Annual conference of prognostics and health management society. Bruno, O., Landi, A., Papi, M., & Sani, L. (2001). Phototube
sensor for monitoring the quality of current collection on overhead electrified railways. In Proceedings of the institution of mechanical engineers, part f: Journal of rail and rapid transit(pp. 231–241).
Bruno, O., Landi, A., Papi, M., Sani, L., & Violi, A. G.
(2001). Pantograph-catenary monitoring: correlation between breack arcs and harmonics in the traction currents. In CDROM of The World Conference Railway Research(Vol. 1).
Bucca, G., & Collina, A. (2009). A procedure for the wear prediction of collector strip and contact wire in pantographcatenary system. Wear, 266(1-2), 46–59. Bucca, G., & Collina, A. (2015). Electromechanical
interaction between carbon-based pantograph strip and copper contact wire: a heuristic wear model. Tribology International, 92, 47–56.
Camci, F. (2014). The travelling maintainer problem: integration of condition-based maintenance with the travelling salesman problem. Journal of the Operational Research Society, 65(9), 1423–1436. Camci, F. (2015). Maintenance scheduling of
geographically distributed assets with prognostics information. European Journal of Operational Research, 245(2), 506 - 516. doi: 10.1016/j.ejor.2015 .03.023
CENELEC. (2012). En 50367 - railway applications - current collection systems - technical criteria for the interaction between pantograph and overhead line (Tech. Rep. No. EN 50367). rue de Stassart 35, B - 1050 Brussels: European Committee for Electrotechnical Standardization.
CENELEC. (2013). En 50317 - railway applications - current collection systems - requirements for and validation of measurements of the dynamic interaction between pantograph and overhead contact line(Tech. Rep. No. EN 50317). rue de Stassart 35, B - 1050 Brussels: European Committee for Electrotechnical Standardization.
Chantier, M., Coghill, G. M., Shen, Q., & Leitch, R. (1998). Selecting tools and techniques for model-based diagnosis. Artificial Intelligence in Engineering, 12(1), 81–98.
Cho, Y. H., Lee, K., Park, Y., Kang, B., & Kim, K.-n. (2010, November). Influence of contact wire pre-sag on the dynamics of pantograph-railway catenary. International Journal of Mechanical Sciences, 52(11), 1471–1490. doi: 10.1016/j.ijmecsci.2010.04.002 Collina, A., Fossati, F., Papi, M., & Resta, F. (2007,
January). Impact of overhead line irregularity on current collection and diagnostics based on the measurement of pantograph dynamics. Proceedings of the Institution of Mechanical Engineers, Part F: Journal of Rail and Rapid Transit, 221(4), 547–559. doi: 10.1243/09544097F02105
EU, C. R. (2014). Technical specifications for interoperability relating to the energy subsystem of the rail system in the union. (Tech. Rep. No. 1301/2014/EU). 120 Rue Marc Lefrancq, 59307 Valenciennes, France: European Union Agency for
Railways.
EUROPAC. (2008). Publishable final activity report (Tech. Rep. No. 012440). rue de Stassart 35, B - 1050 Brussels: European Optimised Pantograph Catenary Interface.
Gasselin, B., Malve, L., Poligne, C., Goulain, L., Nicolini, J., & Millot, G. (2015, August 12). Dispositif de d´etection d’usure d’un fil de contact d’une cat´enaire. Google Patents. (EP Patent 2,759,441)
Gaus, N., & Kayser, H. J. (2016). Siemens digitalization strategy & sinalytics platform. Brochure. Retrieved 2017-09-03, from https:// www.siemens.com/digitalisierung/ public/pdf/Sinalytics-and-Digital -Services-Presentation.pdf
Gouriveau, R., Medjaher, K., & Zerhouni, N. (2016). From prognostics and health systems management to predictive maintenance 1: Monitoring and prognostics. John Wiley & Sons.
Hayasaka, T., Shimizu, M., & Nezu, K. (2009). Development of Contact-Loss Measuring System Using Ultraviolet Ray Detection. Quarterly Report of RTRI, 50(3), 131–136.
Huang, H.-H., & Chen, T.-H. (2008, June). Development of method for assessing the current collection performance of the overhead conductor rail systems used in electric railways. Proceedings of the Institution of Mechanical Engineers, Part F: Journal of Rail and Rapid Transit, 222, 159–168.
IEC. (2013). Iec 60913 - railway applications - fixed installations - electric traction overhead contact lines (Tech. Rep. No. 60913). Rue de Varemb 3, 1211 Geneva 20, Suisse: International Electrotechnical Commission.
Isermann, R. (1997). Supervision, fault-detection and fault-diagnosis methodsan introduction. Control engineering practice, 5(5), 639–652.
Jwa, Y., & Sonh, G. (2015). Kalman filter based railway tracking from mobile Lidar data. Proceedings of the ISPRS Annals of the Photogrammetry, Remote Sensing and Spatial Information Sciences, La Grande Motte, France, 28.
Kiessling, F., Puschmann, R., Schmieder, A., & Schneider, E. (Eds.). (2009). Contact lines for electric railways. planning, design, implementation, maintenance. Kolbe, M., Baldauf, W., & Tiffe, G. (2001). Compact
contact force measurement systemonline diagnosis of the overhead line system with regular trains. Proc. WCRR (Cologne).
Koyama, T., Ikeda, M., Kobayashi, S., Nakamura, K., Tabayashi, S., & Niwakawa, M. (2014). Measurement of the Contact Force of the Pantograph by Image Processing Technology. Quarterly Report of RTRI, 55(2), 73–78. doi: 10.2219/rtriqr.55.73
Kumar, S., Torres, M., Chan, Y., & Pecht, M. (2008). A hybrid prognostics methodology for electronic products. In Neural networks, 2008. ijcnn 2008.(ieee world congress on computational intelligence). ieee international joint conference on(pp. 3479–3485). Kusumi, S., Fukutani, T., & Nezu, K. (2006a). Diagnosis
of Overhead Contact Line based on Contact Force. Quarterly Report of RTRI, 47(1), 39–45.
Kusumi, S., Fukutani, T., & Nezu, K. (2006b). Diagnosis of Overhead Contact Line based on Contact Force. Quarterly Report of RTRI, 47(1), 39–45. doi: 10.2219/ rtriqr.47.39
Laffont, G., Roussel, N., Rougeault, S., Boussoir, J., Maurin, L., & Ferdinand, P. (2009, October). Innovative FBG sensing techniques for the railway industry: application to overhead contact line monitoring;. In J. D. C. Jones (Ed.), (pp. 75035K–75035K–4). doi: 10.1117/12 .835346
Lamoureux, B., Mass´e, J.-R., & Mechbal, N. (2015). Towards an integrated development of phm systems for aircraft engines: In-design selection and validation of health indicators. In Prognostics and health management (phm), 2015 ieee conference on(pp. 1–8). Landi, A., Menconi, L., & Sani, L. (2006, January). Hough transform and thermo-vision for monitoring pantograph-catenary system. Proceedings of the Institution of Mechanical Engineers, Part F: Journal of Rail and Rapid Transit, 220(4), 435–447. doi: 10.1243/0954409JRRT41
Lee, J., Wu, F., Zhao, W., Ghaffari, M., Liao, L., & Siegel, D. (2014). Prognostics and health management design for rotary machinery systemsreviews, methodology and applications. Mechanical systems and signal processing, 42(1), 314–334.
Le Mortellec, A., Clarhaut, J., Sallez, Y., Berger, T., & Trentesaux, D. (2013). Embedded holonic fault diagnosis of complex transportation systems. Engineering Applications of Artificial Intelligence, 26(1), 227–240.
Letot, C., Soleimanmeigouni, I., Ahmadi, A., & Dehombreux, P. (2016). An adaptive opportunistic maintenance model based on railway track condition prediction. IFAC-PapersOnLine, 49(28), 120 - 125. Lu, X., Shan, S., Tang, G., & Wen, Z. (2016). Survey
on the railway telematic system for rolling stocks. In Proceedings of the 2015 international conference on electrical and information technologies for rail transportation: Transportation(pp. 645–656). Berlin, Heidelberg: Springer Berlin Heidelberg.
Massat, J. (2007). Mod´elisation du comportement dynamique du couple pantographe-cat´enaire (Unpublished doctoral dissertation). Ecole Centrale de Lyon. Mass´e, J.-R., Hmad, O., & Boulet, X. (2012). System