OATAO is an open access repository that collects the work of Toulouse
researchers and makes it freely available over the web where possible
Any correspondence concerning this service should be sent
to the repository administrator:
[email protected]
This is an author’s version published in:
http://oatao.univ-toulouse.fr/21455
To cite this version:
Lei, Fang and Dupuis, Pascal and Zissis, Georges and
Maussion, Pascal A Simple High-Sensitivity Acoustic
Resonance Detection Method for Metal Halide Lamps. (2018)
Journal of Light & Visual Environment, 41. 123-128. ISSN
0387-8805
Official URL:
https://doi.org/10.2150/jstl.IEIJ160000598
A Simple High-Sensitivity Acoustic Resonance Detection Method for
Metal Halide Lamps
Fang LEI*
,**, Pascal DUPUIS*, Olivier DURRIEU*, Georges ZISSIS* and Pascal MAUSSION*
, †* LAPLACE, Université de Toulouse, CNRS, INPT, UPS, France
** Xi a n Shiyou University, School of Electronic Engineering, No. 18, 2nd Dianzi road, 710065 Xi a n, China
ABSTRACT
To detect acoustic resonance (AR) in metal halide (MH) lamps, a simple high-sensitivity method with a multiplier detector is presented in this paper. Voltage envelope variations are measured to evaluate whether AR occurs in MH lamps. The study is focused on improving the sensitivity of an AR detection method. Several manufacturers MH lamps are tested in our experiment. In addition, the proposed meth-od is compared to another voltage envelope detection methmeth-od evaluating by a lock-in amplifier with high sensitivity and detection results are analyzed by statistical methods. The results show that the proposed circuit can provide similar sensitivity as the expensive lock-in amplifier to detect AR phenomena and the AR-free and the slight AR level can be easily distinguished.
KEYWORDS: acoustic resonance, detection, metal halide lamp, voltage envelope variations, sensitivity
1. Introduction
Thanks to better color rendering index (CRI), MH lamps are widely used in locations where color is im-portant, such as shops, factories, supermarkets, gymna-siums and so on1). However, due to the negative
imped-ance2) of MH lamps, accompanying ballasts are needed.
Compared with magnetic ballasts, electronic ballasts have lower volume, lower weight and higher power factor. Nevertheless, when electronic ballasts operate at high frequency, AR could appear in MH lamps3, 4).
AR in MH lamps operating at high frequency can cause lamp arc distortion, rotation, extinction and lamp deterioration in the worst situations5, 6). AR phenomenon
gives the great hinder of high-frequency ballasts. Con-sequently, detection and suppression of AR are vital for the development of electronic ballasts. To detect AR, several methods based on electrical6, 7) optical2, 8) and
sound9) have been presented in the previous papers. In
the papers10‒12), simple methods were proposed, where
voltage variations or current variations are measured to detect AR. However, few methods take into account the sensitivity of AR detection. When an increasing aging of MH lamps, the AR level could get more and more serious13) and slight AR could turn into serious
AR, which is a disaster for the ballasts.
For detection purposes, a lock-in amplifier was used to acquire voltage envelope variations in our previous paper14) in which it was proven that the voltage
enve-lope characterization is a reliable method to detect AR
in MH lamps. On the other hand, the lock-in amplifier is an expensive device. Based on those reasons, this pa-per proposes a simple, low-cost method with multiplier detector which has the same functions to obtain the voltage envelope as the lock-in amplifier. The proposed method has the enough sensitivity that can distinguish the AR-free and slight AR level. Comparing papers10‒12),
the proposed circuit has a higher sensitivity. In addi-tion, comparing the proposed multiplier circuit with the lock-in amplifier, our proposed method has the similar function as the lock-in amplifier.
The paper is organized as follows. The circuits of a high-frequency electronic ballast and the AR detection principle are described in section II. Experimental re-sults are presented and analyzed in section III. Section IV gives conclusions.
2. Circuit of high-frequency ballast and AR detec-tion principle
2.1 Main circuit
High-frequency electronic ballast is supplied with an LCC half-bridge inverter15), its main circuit is shown
in Figure 1. The circuit consists of an input DC supply Vdc, two switches Q1 and Q2, a coupling capacitor Cs, a
resonant inductor Ls, a resonant capacitor Cp and the
lamp. In our experiment, several manufacturers 150 W MH lamps are tested. The parameters of the circuit are shown in Table 1.
2.2 Principle of AR detection
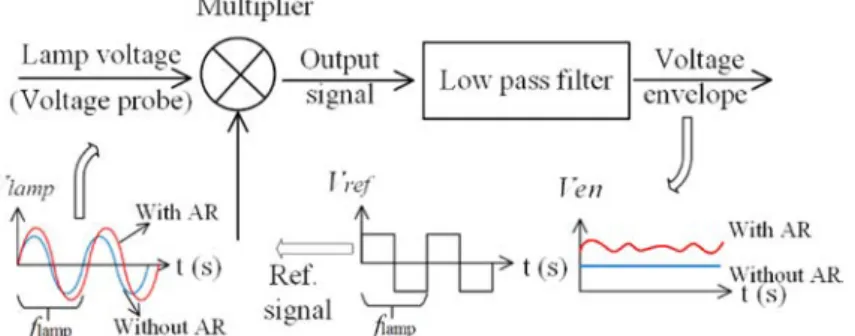
A multiplier detector is an electronic circuit that takes the lamp voltage as one of the input signals, a reference signal as the other input signal and provides an output which is the envelope of the original signal. In MH lamps, three kinds of signals can be taken as the input of envelope detector, the lamp voltage, current and power. The voltage variations are more evident than current and power11). Consequently, the voltage
envelopes are detected in our experiment. Figure 2 shows the principle of the voltage envelope detection in MH lamps.
As can be seen from Figure 2, one input signal is the lamp voltage which is sensed from a differential probe or a resistor divider circuit, and the other one is the reference signal whose frequency is the same as the lamp s operating frequency. As presented in the paper16), there are 5‒20 Hz current or voltage variations
in MH lamps. A low-pass filter is thus used to get the voltage variations.
2.3 Mathematical model of the multiplier detector
If m(t) is the acoustic signal and C is the constant,
with AR occurrence, the lamp signal is
lamp ( ( ))sin
V = +C m t ωt (1)
In this paper, the reference signal is the square wave signal which is used to trigger the ballast switches. Ac-cording to the Fourier series, a 50% duty-cycle square wave consists of odd order harmonic sine waves with a fundamental at the same frequency as the square wave.
Fourier series of the square wave is given by Eq. (2)
ref 4 n1sin(2 1)
V =π A
∞= n− ωt (2)Where A is the peak amplitude of the square wave. The output of the multiplier can be written as:
lamp ref
( )
y t V= ⋅V (3)
Which can be rewritten as
1 ( ) 2 2 ( ) 2 ( ( ))cos2 2 ( ( )) 1 [cos2 cos2( 1) ] 2 1 n y t A C A m t A C m t ωt π π π A C m t nωt n ωt π n ∞ ⋅ ⋅ − − +
= = + + + + + (4)After the low-pass filter, high-frequency component are filtered out, then the acoustic signal m(t) will be recovered.
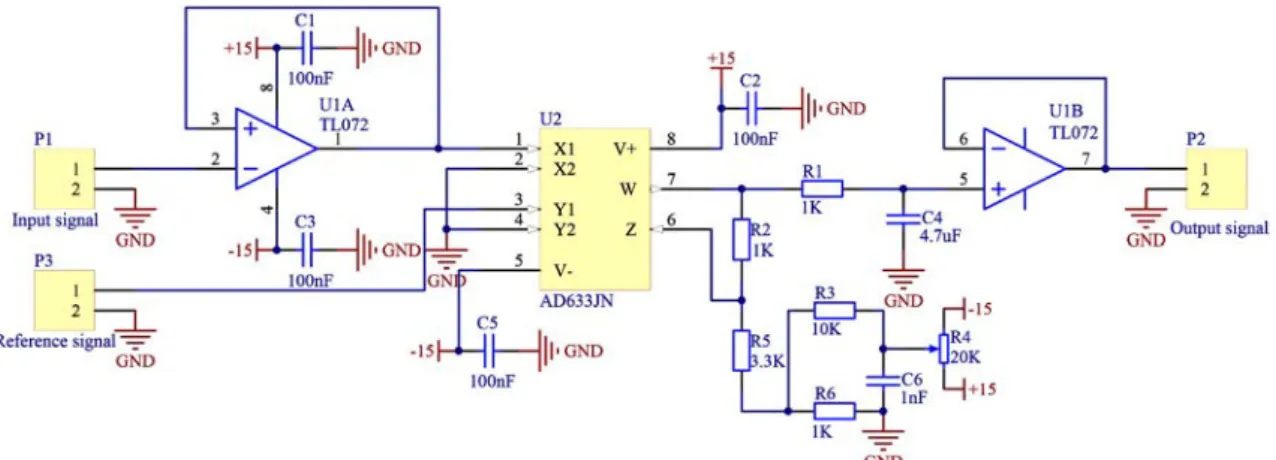
2.4 High-sensitivity AR detection circuit with mul-tiplier
AR detection circuit is shown in Figure 3. It is based on an AD633 which is a functionally complete, four-quadrant and analog multiplier. It includes high imped-ance, differential X and Y inputs, and a high impedance summing input Z. The low impedance output voltage is a nominal 10 V full scale provided by a buried Zener. W is the output which can be expressed as follows in expression Eq. (5): 1 2 1 2 ( )( ) 10 X X Y Y W= − − +Z (5)
X1 is the input signal Vlamp and Y1 is the reference
signal Vref, which comes from the controller or a phase
locked loop (PLL). X2 and Y2 are connected to the
Figure 1 Circuit of half-bridge high-frequency electronic bal-last.
Table 1 Electrical parameters of electronic ballast.
Name Type and value
MOSFET Q1, Q2 SPB11N60S5
Inductor Ls 1.8 mH
Capacitor Cs 300 nF
Capacitor Cp 15 nF
ground. Z can be used to adjust the offset of output signal. The amplitude of the reference signal in the multiplier circuit is 1V. A differential probe which at-tenuation ratio is 1/20 is used in our experiment. The operation frequency of the ballast is from several kHz up to several ten kHz. There are 5‒20 Hz current or voltage variations in MH lamps. Therefore, a low-pass filter is used and the cutoff frequency fc is 34 Hz that
is greater than 20 Hz, which is determined by the time constant (R1=1 kHz and C4=4.7 uF).
1 4 1 2 c f = πR C (6) 3. Experimental results
3.1 Real-time AR detection by proposed circuit
AR intensities can be classified into several levels, according to observed arc fluctuations. In the previous paper11), before the lamps extinguished, three
intensi-ties levels are observed by eyes, such as AR-free, slight AR and serious AR. In our paper, AR levels are clas-sified according to the peak value of the variations of voltage envelope. If the peak value of voltage variations is below than 0.2 V, it can be regarded as the slight AR level. If this value is less than 100 times of 0.2 V and this
means that there are no voltage envelope variations, it can be regards as the AR-free case. The aim of our experiments is to evaluate the sensitivity of AR detec-tion circuit. Thus, the AR-free and slight AR modes are obtained in different manufacturers MH lamps. Meanwhile, an example detection is given when AR is the serious level. Figure 4 shows the lamp voltage and voltage envelope variations at AR-free and serious AR situations in a GE MH lamp. Figures 5‒7 show the arc shape and the relevant voltage envelope variations in AR-free and slight AR situations in GE, Osram and Philips MH lamps.
In this experiment, the output signal of the detection circuit is in AC mode. This means DC components of the lamp voltage is removed in the detection circuit. In fact, the variations of the lamp voltage keep consistent with the voltage envelope variations of the detection circuit, but because of the ratio gain of the differen-tial probe and the multiplier circuit, Vvar is equal to
1/100π Vlamp.
As can be seen from Figure 4, there is no voltage en-velope variation when AR does not occur at f=10.6 kHz in the GE MH lamp. In contrast, low-frequency fluctua-tions are observed at f=12.8 kHz and the peak of the voltage variation is about 0.3 V, which is in serious AR Figure 3 A simple AR detection circuit.
case.
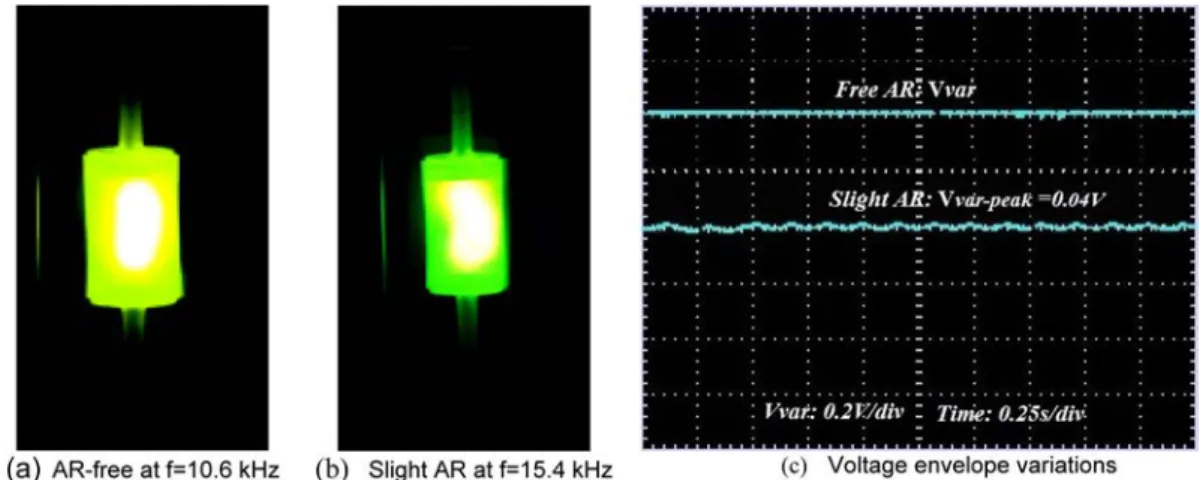
In Figure 5, the arc is straight and there is no light flicker at AR-free level for f=10.6 kHz in GE MH lamp. Meanwhile, no voltage envelope variations are observed. However, the arc bends a little, voltage en-velope variations are detected and low-frequency
fluc-tuations are observed in the lamp, even if the AR level is slight at f=15.4 kHz. In addition, the common phenom-enon is found in Osram and Philips MH lamps, as shown in Figure 6 and Figure 7. No deformations of the arc are found and no voltage envelope variations are detected at AR-free situation. The arcs bend and the relevant Figure 5 Arc images and voltage envelope variations (Vvar) in the GE Constant Color MH lamp (Vvar-peak means the peak value of
voltage envelope variations).
Figure 6 Arc images and voltage envelope variations (Vvar) in the Osram Powerball HCI-TT MH lamp (Vvar-peak means the peak
value of voltage envelope variations).
Figure 7 Arc images and voltage envelope variations (Vvar) in the Philips Master CityWhite CDO-TT MH lamp (Vvar-peak means the peak value of voltage envelope variations).
voltage envelope variations are observed in the pres-ence of AR. The experimental results show that the proposed circuit can detect AR very well. In addition, AR-free and slight AR cases can be distinguished.
As can be seen from Figures 5‒7, the values of Vvar-peak are 0.04 V, 0.08 V and 0.12 V. All the values are
below than the defined threshold value 0.2 V. We can regard that the lamps work in slight AR situation. Ad-ditionally, the results are consistent with our defined definition.
3.2 Statistical methods of AR detection
The other method of the voltage envelope detection by using the lock-in amplifier SR830 is introduced here as well, to verify the proposed circuit has good sensitiv-ity to distinguish AR-free and slight AR cases. A lock-in amplifier is a type of amplifier that can extract a signal with a known carrier wave from an extremely noisy environment.
We operate MH lamps working as the same
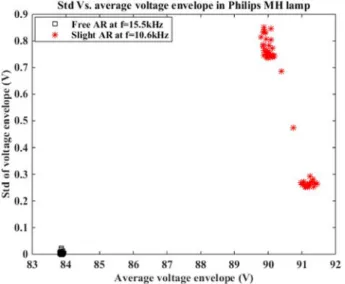
situa-tions in Section 3.1. Here we give an example in the Philips MH lamp which works at the same situation (AR-free at f=10.6 kHz and slight AR at f=15.5 kHz) as in Figure 7. In this experiment, all the processes are im-plemented by LabVIEW automatically. We do 51 times measurement at each case: AR-free or slight AR and the interval of two measurements is 24 s. At each mea-surement, we use the lock-in amplifier SR830 to sample 32 points and sample rate is 8 Hz during 4 s. Fifty-one measurement points during 20 min are then chosen in AR-free or slight AR situation. The short-time aver-age value and the standard deviation are computed on those 32 samples. Those two variables are then plotted in the 2D plane. Finally, fifty-one realizations are avail-able over 20-min observation window. As a result, a 2D plane of the standard deviation of the voltage envelope vs. the average voltage envelope is plotted in Figure 8. Additionally, the boxplot of voltage envelope in the Philips MH lamp is shown in Figure 9.
According to Figure 8, it is easy to distinguish the AR-free and slight AR level. In no AR situation, voltage envelopes are constant, and the standard deviations (STDs) of voltage envelopes are about zero. However, in AR situation, data of the voltage envelopes are scat-tered, looking like clouds and STDs of voltage enve-lopes are from 0.2 to 0.9 V. The variations of voltage envelopes include the pulse signals shown in Figure 7. Thus, the data of voltage envelopes in AR situations are separated into two parts in Figure 8. In addition, as can be seen in Figure 9, the boxplots of voltage envelopes can distinguish the AR-free and slight AR situation. The larger range of boxplots means that the greater variations of voltage envelope. Comparing the results of two boxplots in Figure 9, STDs of voltage envelopes are more significant in Figure 9(b). It means that using STD of voltage envelope is much easier to detect AR. Finally, it can be stated that the presented statistical methods are robust to detect and distinguish AR-free and slight AR level.
Figure 8 Standard deviation of voltage envelope vs. average voltage envelope in the Philips MH lamp.
3.3 Comparisons of different methods
Comparing our results with the results in papers10, 11),
our circuit can detect the peak value of the voltage variation reaching to 0.04 V in the slight AR situation, whereas their circuits can detect 0.2 V, 0.5 V respec-tively. It means the sensitivity of our circuit is 5 times and 13 times to their circuits.
In addition, an example of statistical methods in the Philips MH lamp have shown that our real-time detec-tion circuit have similar funcdetec-tions to distinguish AR. Of course, our proposed real-time detection circuit is much cheaper than the device of the lock-in amplifier SR830 which is used in the second kind of voltage envelop method. Based on these reasons, our proposed real-time circuit for AR detection have a relative higher sensitiv-ity and is simpler as well.
4. Conclusions
The voltage envelope detection with a multiplier has been proven to be a high-sensitivity method to detect AR phenomena in MH lamps. The proposed circuit can not only trace voltage envelope variations, but also have a higher sensitivity than others to distinguish the AR-free level from the slight AR level. Statistical analyses are also robust to get the characterizations of AR phenomena. Moreover, AR phenomena affect varia-tions of voltage envelopes. The more serious AR, the much greater voltage envelope variations are detected. Voltage envelope variations are significantly correlated with AR occurrence. Our findings should be helpful for researchers to study AR phenomena.
References
(1) Stockwald, K., Kaestle, H. and Ernst, H.: Highly ef-ficient metal halide HID systems with acoustically stabilized convection, IEEE Trans. Ind. Appl., 50-1, pp. 94‒103 (2014).
(2) Kaiser, W., Marques, R. P. and Correa, A. F.: An alternative optical method for acoustic resonance detection in HID lamps, Proc. IEEE IAS Annual Meeting, pp. 1‒6 (2009).
(3) Schwieger, J., Wolff, M., Baumann, B., Manders, F. and Suijker, J.: Characterization of discharge arc flicker in high-intensity discharge lamps, IEEE Trans. Ind. Appl., 51-3, pp. 2544‒2547 (2015). (4) Afshar, F.: The theory of acoustic resonance and
acoustic instability in HID lamps, LEUKOS: The Journal of the Illuminating Engineering Society of North America, 5-1, pp. 27‒38 (2008).
(5) Hirsch, J., Baumann, B., Wolff, M., Bhosle, S. and Barrientos, R. V.: Acoustic resonances in HID lamps: Model and measurement, J. Phys. D, 43-23, pp. 1‒7 (2010).
(6) Chhun, L., Maussion, P., Bhosle, S. and Zissis, G.:
Characterization of acoustic resonance in a high-pressure sodium lamp, IEEE Trans. Ind. Appl., 4-2, pp. 1071‒1076 (2010).
(7) Toumi, A., Chhun, L., Bhosle, S., Zissis, G., Mauss-ion, P., Baumann, B. and Wolff, M.: Acoustic reso-nance characterization and numerical model in-cluding acoustic streaming in an HPS lamp, IEEE Trans. Ind. Appl., 49-3, pp. 1154‒1160 (2013). (8) Anton, J. C. A., Blanco, C., Ferrero, F. J., Viera, J.
C., Bordel, N., Martin, A. and Zissis, G.: An acous-tic resonance band detection workbench for HID lamps, IEEE Trans. Ind. Appl., 43-5, pp. 1191‒1198 (2011).
(9) Schäfer, R. and Stromberg, H.: Investigations on the fundamental longitudinal resonance of high pressure discharge lamps, J. Appl. Phys., 53-5, pp. 3476‒3480 (1982).
(10) Moo, C. S., Huang, C. K. and Yang, C. Y.: Acoustic-resonance-free high-frequency electronic ballast for metal halide lamps, IEEE Trans. Ind. Electron., 55-10, pp. 3653‒3660 (2008).
(11) Moo, C. S., Huang, C. K. and Hsiao, Y. N.: High-frequency electronic ballast with auto-tracking control for metal halide lamps, Proc. IEEE IAS Annual Meeting, 2, pp. 1025‒1029 (2003).
(12) Burgio, A. and Menniti, D.: HID lamp acoustic res-onance detection: A simple current-based method using sample-hold circuits, Proc. Environment and Electrical Engineering (EEEIC), pp. 1‒4 (2011). (13) Wei, Y. and Hui, S. Y. R.: Ageing effects on the
sta-bility performance of small wattage metal-halide (MH) lamps, Applied Power Electronics Confer-ence and Exposition, APEC04, 19th Annual IEEE, 2, pp. 978‒983 (2004).
(14) Lei, F., Dupuis, P., Durrieu, O., Zissis, G. and Maussion, P.: Acoustic resonance detection using statistical methods of voltage envelope character-ization in metal halide lamps, 2016 IEEE Industry Applications Society Annual Meeting, pp. 1‒7 (2016).
(15) Alonso, J. M., Blanco, C., Lopez, E., Calleja, A. J. and Rico, M.: Analysis, design, and optimization of the LCC resonant inverter as a high-intensity dis-charge lamp ballast, IEEE Trans. Power Electron., 13-3, pp. 573‒585 (1998).
(16) Yan, J., Miaosen, S., Hua, L. and Zhaoming, Q.: An adaptive acoustic resonance free electronic ballast for HID lamps, Proc. IEEE IAS Annual Meeting, 2, pp. 1020‒1024 (2003).
All or part of this work was presented at 15th Inter-national Symposium on the Science and Technology of Lighting (LS15), May 2016, Kyoto, Japan.