HAL Id: dumas-00789124
https://dumas.ccsd.cnrs.fr/dumas-00789124
Submitted on 15 Feb 2013
HAL is a multi-disciplinary open access archive for the deposit and dissemination of sci-entific research documents, whether they are pub-lished or not. The documents may come from teaching and research institutions in France or abroad, or from public or private research centers.
L’archive ouverte pluridisciplinaire HAL, est destinée au dépôt et à la diffusion de documents scientifiques de niveau recherche, publiés ou non, émanant des établissements d’enseignement et de recherche français ou étrangers, des laboratoires publics ou privés.
Le Product Lifecycle Management appliqué au marché
pharmaceutique
Lucie Tomas
To cite this version:
Lucie Tomas. Le Product Lifecycle Management appliqué au marché pharmaceutique. Sciences phar-maceutiques. 2012. �dumas-00789124�
AVERTISSEMENT
Ce document est le fruit d'un long travail approuvé par le
jury de soutenance et mis à disposition de l'ensemble de la
communauté universitaire élargie.
Il n’a pas été réévalué depuis la date de soutenance.
Il est soumis à la propriété intellectuelle de l'auteur. Ceci
implique une obligation de citation et de référencement
lors de l’utilisation de ce document.
D’autre part, toute contrefaçon, plagiat, reproduction illicite
encourt une poursuite pénale.
Contact au SICD1 de Grenoble :
[email protected]LIENS
LIENS
Code de la Propriété Intellectuelle. articles L 122. 4
Code de la Propriété Intellectuelle. articles L 335.2- L 335.10
http://www.cfcopies.com/V2/leg/leg_droi.php
UNIVERSITE JOSEPH FOURIER FACULTE DE PHARMACIE DE GRENOBLE
Année : 2012 N°
LE PRODUCT LIFE CYCLE MANAGEMENT APPLIQUE AU
MARCHE PHARMACEUTIQUE
THESE
PRESENTEE POUR L’OBTENTION DU TITRE DE DOCTEUR EN PHARMACIE DIPLÔME D’ETAT
Mademoiselle Lucie TOMAS
Née le 18 août 1987 à Perpignan (66)
THESE SOUTENUE PUBLIQUEMENT A LA FACULTE DE PHARMACIE DE GRENOBLE* Le 10 décembre 2012
DEVANT LE JURY COMPOSE DE
Président du jury : M. Michel SEVE, Directeur de thèse, Docteur en Pharmacie, PU-PH en Biochimie et Biotechnologie, Grenoble I
Membres
M. Jean BRETON, Docteur en Pharmacie, MCU en Biologie Moléculaire et Biochimie, Grenoble I Mme Valérie SABATIER, Professeur Assistant au département Management et Technologie, Grenoble Ecole Management
M. Philippe SABATIER, Professeur à l’Université Joseph Fourier, Grenoble I
* La Faculté de Pharmacie de Grenoble n’entend donner aucune approbation ni improbation aux opinions émises dans les thèses ; ces opinions sont considérées comme propres à leurs auteurs.
R
EMERCIEMENTS
Au Professeur Michel Sève, pour sa passion vis à vis des biotechnologies qui m’a incitée à suivre le cursus. Merci pour vos conseils et pour avoir accepté la Présidence de ce jury. A Valérie Sabatier, pour m’avoir encadrée durant ces derniers mois. Je vous suis sincèrement reconnaissante pour votre écoute attentive et votre disponibilité constante. Au Professeur Jean Breton, pour avoir intégré ce jury même si le sujet digresse quelque peu de votre champ de compétence habituel.
A Philippe Sabatier, merci d’avoir accepté aussi rapidement de venir juger ma soutenance.
A Isabelle Choné, pour son encadrement durant ces mois passés à Sanofi. Je te remercie chaleureusement pour m’avoir fait découvrir les facettes de ce métier malgré un emploi du temps plus que chargé.
A Imen Rezig-Stoessel, pour m’avoir fait partager son expérience et m’avoir mise à l’aise dès mon arrivée sur le site. J’ai aimé partagé nos anecdotes quant à notre vie étudiante grenobloise.
A Béatrice et Linda qui m’ont accueillie dans leur bureau. Merci pour votre bonne humeur et pour les nombreux conseils qui me serviront par la suite dans mon parcours professionnel.
Aux stagiaires du site de Parisud qui m’ont facilement intégrée dans leur grande famille. Sanofiens, sanofiennes, mes meilleures pauses déjeuners, c’est avec vous que je les ai passées.
A l’équipe de la Pharmacie du Bourg. Merci aux titulaires, Anne-Françoise et Sylvie, pour m’avoir formée au métier de pharmacien. C’est grâce à vous si j’ai autant aimé travailler en officine. Aux préparatrices (Sonia, Coco, Morgane, Julie) avec qui j’ai « grandi », merci pour votre générosité et votre dynamisme.
A mes amies de fac, ces années n’auraient pas été les mêmes sans vous. Merci à Flo et Lydie pour votre présence et pour avoir accepté mon petit grain de folie. Merci à Sarah pour son écoute et les longues conversations que nous avons partagées. Merci à Anne-Laure et Céline pour les nombreuses soirées délurées que nous avons passées ensemble. Merci à Blandine sans qui l’animation n’aurait pas été au rendez-vous avec ses histoires incroyables.
Aux amies récentes : Audrey, Aurore, Shairah,… grâce à qui j’ai passé de supers mois sur Paris. Mais j’espère que le meilleur reste à venir.
A celles qui sont là depuis toujours ou presque : Bérengère, Laure, Ophélie et Yenifer. Vous m’avez vue évoluer au fil des années et pourtant vous êtes encore là. Il faudra que je vous demande pourquoi.
A Cécile, la petite douceur de la famille. Tu es ma constante : mes plus vieux souvenirs je les ai avec toi et je suis sûre que les prochains le seront également. Merci d’avoir toujours été là en tant qu’amie et sœur.
A Noëlle, l’aînée de la fratrie. Tu nous as ouvert la voie, moi, je n’avais plus qu’à te suivre. Je garde en mémoire nos conversations téléphoniques totalement déjantées, même lorsqu’elles avaient lieu à minuit une veille d’oral.
A mes parents, pour leur prévenance et leur soutien. Maman, merci pour ton écoute constante et aimante sur des sujets tout aussi bien futiles qu’importants. Papa, tu es la force tranquille. Quoiqu’il se passe de bien ou de mal, tu es toujours là. La personne que je suis devenue, elle s’est construite en grande partie grâce à vous. J’espère que le rendu n’est pas trop mal.
A mes grands-parents et au reste de ma famille avec qui j’ai grandi dans les rires et la joie.
T
ABLE OF
C
ONTENT
R
EMERCIEMENTS... 5
L
IST OFF
IGURES... 9
L
IST OFT
ABLES... 10
L
IST OFA
BBREVIATIONS... 11
R
ESUME(
FRANÇAIS) ... 12
I
NTRODUCTION... 22
C
HAPTERI
-
D
RUGD
EVELOPMENT AND CURRENT ISSUES... 23
1.1. DEVELOPMENT & LAUNCH OF A DRUG ... 23
1.1.1. Drug Discovery & Development ... 25
1.1.2. Approval ... 28
1.1.3. Post Authorization Activities ... 32
1.2. CURRENT ISSUES OF THE PHARMACEUTICAL MARKET ... 33
1.2.1. R&D Productivity ... 36
1.2.2. Clinical trials constraints ... 42
1.2.3. Approval ... 42
1.2.4. Payers pressure ... 44
1.2.5. Generics and biosimilars ... 45
C
HAPTERII
–
T
HEP
RODUCTL
IFEC
YCLEM
ANAGEMENT,
CONCEPT AND STRATEGIES... 49
2.1. PRODUCT LIFE CYCLE ... 49
2.1.1. Origin & description ... 49
2.1.2. The Technological Life Cycle... 52
2.1.3. The Product Life Cycle Management ... 55
2.1.4. The PLCM in marketing ... 56
2.2. STRATEGIES OF THE PLCM ... 56
2.3. TACTICS APPLIED TO IMPROVE THE PLC ... 59
2.3.1. New uses ... 60
2.3.2. Further development of product... 60
2.3.3. Price reduction ... 61
2.3.4. Brand loyalty... 61
2.4. LIMITATIONS OF THE MODEL ... 62
C
HAPTERIII
–
T
HEPLCM
CONCEPT APPLIED IN THE PHARMACEUTICAL AREA:
SIMILARITY AND SPECIFICITIES... 63
3.1. A DRUG, A PARTICULAR PRODUCT ... 63
3.1.1. A non typical relationship : drug versus patients ... 63
3.2. THE LIFE CYCLE OF A NEW BRAND DRUG ... 64
3.3. PLCM TACTICS USED TO IMPROVE LIFE CYCLE OF NEW BRAND MEDICINES ... 69
3.3.1. New indications ... 69
3.3.2. Continual technical improvement of product ... 71
3.3.3. Evolution of price ... 72
3.3.4. Brand loyalty... 74
3.3.5. Switch to Over-The-Counter drug ... 75
3.3.6. Fixed-combination medicinal products ... 76
C
HAPTERIV-
T
HEORY VERSUSR
EALITY:
C
OMPARISON ANDD
ISCUSSION... 77
4.1 PRODUCT LIFE CYCLE MANAGEMENT IN PRACTICE ... 77
4.1.1. In pre-marketing ... 77
4.1.2. In post-marketing ... 78
4.2 SANOFI’S CASES ... 79
4.2.1. Case of a biologic medicine currently being developed ... 79
4.2.2. Case of a prescription drug already commercialized :Plavix®’s case ... 80
4.3 AN ASIDE, THE BIOSIMILARS’ COMPETITIVENESS... 82
4.4 A UNIQUE MODEL OF PLC FOR ANY MEDECINE? ... 84
C
ONCLUSION... 86
R
EFERENCES... 88
L
IST OF
F
IGURES
Figure 1 Current process of development a commercialization of a new drug ...23
Figure 2 Drug Discovery step ...25
Figure 3 Preclinical stage ...25
Figure 4 Clinical Trials ...26
Figure 5 Drug Development stages ...28
Figure 6 CTD Triangle ...29
Figure 7 Drug Development & Commercialization ...32
Figure 8 Evolution of the growth rate of revenues in the main pharmaceutical markets ..34
Figure 9 Annual growth rate for the index of industrial production (IPI), EU-27, 2011 ...35
Figure 10 R&D model yielding costs to successfully discover and develop a single NME ...35
Figure 11 Dimensions of R&D Productivity ...37
Figure 12 R&D model yielding costs to successfully discover and develop a single new molecular entity ...38
Figure 13 Pharmaceutical R&D Expenditure in Europe & USA ($ million), 1990-2011 ...39
Figure 14 Cost required at each step of the drug development process ...40
Figure 15 Attrition rate at each step of drug development ...41
Figure 16 Average time span of every stage of drug development ...41
Figure 17 Number of New Chemical or Biological Entities, 1992-2011 ...43
Figure 18 NME Applications Filed and Approved by FDA’s Center for Drug Evaluation & Research (1997-2012) ...43
Figure 19 Scope of Product Life cycle Theory ...50
Figure 20 Typical Product Life Cycle ...50
Figure 21 Typical Technological Life Cycle ...52
Figure 22 All phases of the product life cycle and beyond life cycle ...53
Figure 24 Sales & Profit through Product’s Life Cycle Stages ...64
Figure 25 Elements which influence prescribed drug’s life cycle ...67
Figure 26 Life Cycle of Innovator Product ...76
Figure 27 Evolution of sales revenues of Plavix® worldwide ...82
L
IST OF
T
ABLES
Table 1 Summary of the different steps through the development of one new medicine.24 Table 2 Stage Characteristics of a new product in a new market ...51Table 3 Diagnosis to optimize strategies through Product Life Cycle ...58
Table 4 Optimized pathway through the product life cycle ...59
L
IST OF
A
BBREVIATIONS
BLA – Biologic License Application BLC – Brand Life Cycle
CTD – Common Technical Document EMA – European Medicines Agency EU – European Union
FDA – Food & Drug Administration IPI – Industrial Production Index LCM – Life Cycle Management LCP – Life Cycle Prolongation MA – Marketing Approval mAb – Monoclonal Antibody MS – Market Share
NCE – New Chemical Entity NDA – New Drug Application NME – New Molecular Entity OTC – Over-The-Counter PLC – Product Life Cycle
PLCM – Product Life Cycle Management R&D – Research & Development
ROI – Return on Investment TLC – Technological Life Cycle US/USA – United States of America
R
ESUME
(
FRANÇAIS
)
Le développement d’un nouveau produit pharmaceutique est un processus long, complexe et très coûteux. Des organisations professionnelles, telles que l’EFPIA (European Federation of Pharmaceutical Industries and Associations) ou encore le LEEM (Les Entreprises du Médicament), estiment actuellement cette période à une quinzaine d’années en moyenne. Mais ce délai peut varier en fonction des caractéristiques du produit, de l’indication thérapeutique pour laquelle le médicament est initialement développé. Ce processus nécessite un énorme investissement humain et financier dans un secteur industriel considéré depuis quelques années comme peu productif. En 2011, seules 30 nouvelles molécules ont obtenu le statut « New Molecular Entities » (NME) délivré par la FDA alors les dépenses R&D ont dépassé les 70 milliards de dollars.
Différentes causes peuvent expliquent ce manque de résultat auquel les industriels doivent faire face, renforcé par la crise économique actuelle :
- des coûts de plus en plus élevés
- un taux de réussite inférieur à celui des autres secteurs de haute technologie - un temps de développement qui ne cesse de s’allonger, entraînant par ricochet un
temps de commercialisation considérablement réduit - de fortes contraintes inhérentes aux essais cliniques
- un nombre d’autorisations qui tend à diminuer depuis ces dernières années
- une pression toujours plus importante des agences de santé pour réduire les dépenses liées aux remboursements tout en requérant des produits toujours plus sûrs.
Ces différents challenges ont profondément changé l’environnement et la dynamique du marché pharmaceutique, influençant ainsi les orientations stratégiques des décisionnaires industriels: ces dernières se dirigeront préférentiellement vers :
- le développement de molécules complexes, en particulier la conception de médicaments biologiques
- le traitement de maladies chroniques et/ou pour lesquelles la thérapie est particulièrement lourde,
- la prise en charge d’une pathologie affectant un nombre significatif de patients, Grâce à ces orientations, les industriels s’attendent à obtenir un retour sur investissement (ROI) suffisant.
Ces orientations peuvent être choisies aux détriments d’autres pathologies, notamment les pathologies de courte durée.
En plus de ces challenges liés au développement réussi, les managers industriels doivent également faire face à de nombreux facteurs qui peuvent avoir un impact sur la pérennité du médicament sur le marché : une diminution de la durée de la protection par un brevet, une compétition de plus en plus forte et diversifiée (les médicaments "me-too", génériques et biosimilaires,…).
Tout au long des différentes étapes de développement et de commercialisation d’un nouveau produit, les industriels doivent étudier et analyser les influences internes et externes, aussi bien positives que négatives, afin d’augmenter les chances de succès et de réussite commerciale. Une des solutions pour optimiser le retour sur investissement se situerait dans la capacité des industriels à gérer les risques et les opportunités liés au produit et à son marché via son cycle de vie.
Cycle de vie du produit (ou « Product Life Cycle » –PLC-)
Le Concept PLC a largement été décrit et analysé par la communauté scientifique depuis des décennies. Il met en avant les différentes étapes auxquelles est confronté un produit (dans cette situation, le mot « produit » est un terme générique puisque le PLC est également applicable pour une marque, une ligne de produit, un service…) :
- phase de développement
- lancement du produit sur le segment de marché prédéfini, - phase de croissance (la plus rapide possible),
- stade de maturité (le plus longtemps possible), - phase de déclin.
La figure ci-dessous représente les différentes étapes du PLC associées aux courbes d’évolution du chiffre d’affaires et du volume de ventes du produit tout au long de son cycle :
Chacune de ces étapes a ses propres spécificités en termes de : - coûts et dépenses requis,
- possibilité ou non d’un retour financier, - objectifs stratégiques…
Mais le PLC est en réalité plus complexe que cette « simple » succession de 5 étapes : aujourd’hui les industriels tendent à intégrer des éléments qui ne font pas partie du cycle de vie du produit mais qui dépendent de ce même produit pendant son cycle et au-delà (comme par exemple le développement durable). Ces éléments peuvent être :
- tangibles (ex. gestion des déchets, recyclage,…)
- intangibles (ex. gestion des conséquences sanitaires suite à l’exposition à un produit chimique).
Par ailleurs, dans tous les types de secteurs industriels, un produit est rarement développé et commercialisé seul. La majorité des entreprises possède en effet un portefeuille de produits et/ou de services, implémentés sur différents segments du marché. En outre, ces produits ne sont pas tous au même stade de leur cycle de vie,
investissements pour réussir ou maintenir leur présence sur le marché. Mais les ressources d’une entreprise, qu’elles soient financières, humaines ou matérielles, ne sont pas infinies. Les industriels doivent donc réfléchir à la répartition desdites ressources afin de maximiser leur performance et ainsi de pérenniser l’entreprise à court et long-terme. Que ce soit au niveau du portfolio ou plus spécifiquement au niveau d’un produit, différents facteurs apparaissent tout au long du cycle de vie (influençant la R&D, la production, le marketing…). Ceux-ci doivent donc être managés afin de réaliser les objectifs stratégiques sélectionnés par l'entreprise (investir, dégager au mieux des bénéfices, diversifier, "désinvestir",…) : pour cela est utilisée la « gestion du cycle de vie du produit » (Product Life Cycle Management). Dans le secteur industriel, il correspond à un ensemble de processus et d’activités dans le but est de créer un produit et de le maintenir durant tout son cycle de vie, depuis les premiers stades de développement jusqu’à sa fin de vie.
La gestion du cycle de vie du produit peut être scindée en 2 parties distinctes :
- la gestion appliquée à la partie « fabrication » de l’entreprise, comprenant la R&D et la partie production (item non abordé dans ce document)
- le Product Life Cycle Management utilisé en marketing (PLCM)
Le PLCM est une succession de stratégies (et tactiques associées) mises en place tout au long du cycle de vie. Les principaux objectifs du PLCM sont d’optimiser la période de commercialisation, réduire les coûts, identifier et se positionner sur les opportunités commerciales…
Les stratégies du PLCM
La planification des stratégies employées dans le PLCM a fait l'objet d’un certain nombre d’études et d’analyses de la part de la communauté scientifique. Dans ces études, certains ont émis l’hypothèse que les variables associées à cette planification étaient identiques à chacune des phases du cycle de vie mais leur importance, elle, varie en fonction des phases du cycle et des objectifs de performance associés.
Ces stratégies sont réalisées par la mise en place d’outils opérationnels de gestion ou tactiques. Ceux-ci présentent deux intérêts majeurs :
- participer et améliorer la différenciation du produit tout au long de sa commercialisation (de son lancement jusqu’à sa phase de déclin),
- augmenter et prolonger la courbe d’évolution du chiffre de ventes durant tout le cycle.
Ces tactiques sont classées en différentes catégories :
- nouvelles utilisations. Habituellement, cette tactique est employée lorsque le produit est déjà « avancé » sur son cycle de vie, généralement durant sa phase de maturité. Si cette tactique réussit, cela aura deux conséquences sur la courbe du cycle :
o prolongation de la durée de la phase de maturité du produit
o augmentation du volume des ventes (et par conséquent du chiffre d’affaire) en accroissant la taille de la population ciblée par le produit - développement de nouvelles variations pour améliorer le produit et/ou diversifier
la réponse à la demande. Cette tactique permet notamment de : o étendre la protection en additionnant les brevets,
o maintenir un certain intérêt des consommateurs vis-à-vis du produit grâce à l’attrait de la nouveauté,
o maintenir un avantage compétitif du point de vue technologique.
- réduction des prix pour faire face à la concurrence et rester attractif (notamment durant les phases de croissance et de maturité, phases durant lesquelles la compétition est la plus forte)
- fidélité à la marque. Tout comme le produit, la marque a un cycle de vie qui lui est propre (développement de l’identité de la marque, reconnaissance, fidélité, déclin). Ce cycle peut aussi avoir un impact sur les différentes étapes du cycle de vie du produit :
o la reconnaissance d’une marque favorise l’adoption du produit
o la fidélité peut ralentir le déclin du produit et donc de prolonger au maximum le ROI.
Toutefois, bien qu’utilisé largement dans les différents secteurs industriels, le modèle PLCM doit faire face à certaines critiques :
- les managers pourraient avoir des difficultés pour déterminer avec précision et fiabilité la place du produit sur son cycle de vie et évaluer quelle sera la durée de chacune des différentes phases.
- Il serait erroné de considérer que tous les produits suivent systématiquement la courbe classique d’évolution des ventes durant le cycle.
- Il se pourrait que dans certaines situations ce soit le management du marketing qui influence le cycle de vie du produit et non l’inverse.
Au final, en regard de ces limites, la stricte application du modèle PLC peut conduire les entreprises vers des décisions stratégiques inappropriées..
Le PLCM appliqué au marché pharmaceutique.
Il est facile d’imaginer que ce modèle puisse être appliqué au secteur pharmaceutique. Le marché pharmaceutique est un marché « comme un autre » : les fabricants vendent leurs produits aux clients tout en œuvrant pour supplanter la concurrence.
Cependant le médicament est un produit particulier :
- Un « client » atypique puisqu’il s’agit d’une « association tripartite » : le médecin qui « choisit » le composé, l’organisme de soins qui le paie et le patient qui finalement le consomme.
- Une surveillance stricte est appliquée. Que ce soit au niveau de son développement, de son lancement et de sa commercialisation, le produit ainsi que son fabricant doivent répondre à un certain nombre de pré-requis établis par des réglementations nationales et internationales.
Ces spécificités n’ont toutefois pas vraiment d’impact sur un changement de modélisation du cycle de vie du médicament. Néanmoins, elles peuvent influencer les différentes tactiques qui seront mises en place afin d’améliorer et de prolonger la courbe des ventes.
N.B : Seul le médicament soumis à prescription sera analysé par la suite.
Eléments influençant le cycle de vie du médicament
Durant le cycle de vie du médicament (après son lancement), différents facteurs peuvent l’influencer :
- certains éléments sont volontairement mis en place par les industriels en charge du produit afin d’optimiser le ROI (par exemple, multiplier les indications, diversifier le dosage et la formulation…),
- mais ils doivent également tenir compte des facteurs externes qui affecteront la croissance et la pérennité du médicament princeps sur le marché (exemple, la compétition liée aux produits « me-too », ou encore celle liée aux génériques et biosimilaires).
Tactiques utilisées pour augmenter le ROI
Ces tactiques devraient être mises en place le plus tôt possible au cours du cycle de vie : plus tôt elles sont implémentées, plus le retour financier sera maximisé.
Il existe un certain nombre de tactiques employées dans le secteur industriel qui peuvent également être utilisées dans le secteur pharmaceutique.
o multiplication des indications, o amélioration continue du produit, o évolution des prix,
o fidélité à la marque.
Toutefois, dans ce secteur, certaines d’entre elles ont moins d’influence sur l’évolution de la courbe. Par ailleurs, il existe certaines tactiques spécifiques au marché pharmaceutique :
o passage au libre-accès, o association thérapeutique.
Indication multiple. Si elle est réalisée avec succès, elle apporte plusieurs bénéfices notamment :
- augmentation du volume des ventes en augmentant la population ciblée par ces indications
- prolongation de la période d’exclusivité du marché (période pouvant s’étendre jusqu’à un an)
Amélioration continue (ciblant le dosage, la formulation,…). Cela permet notamment de diversifier la réponse à la demande tout en essayant de prolonger la période de protection liée au brevet.
Evolution des prix. A la différence d’un produit lambda, le prix associé à un médicament (ainsi que son remboursement) a été négocié et fixé au préalable, avant son lancement sur le marché. Son prix va évoluer tout au long de son cycle de vie, mais selon un calendrier préétabli et agréé par les autorités de santé. Elle n’est donc pas dépendante de facteurs qui pourraient apparaître au cours du cycle. Cette évolution n’a pas d’influence quant à la perte ou non d’attractivité du médicament (à la différence de produits d’autres secteurs industriels).
Fidélité à la marque. Tout comme avec l’évolution du prix, l’importance de cette tactique dans la démarche marketing est plus faible comparée à celle des autres secteurs non pharmaceutiques. Ceci peut s’expliquer par :
- Une limitation réglementaire des actions promotionnelles,
- Une population avertie (les médecins) également influencée par des directives réglementaires et des consensus professionnels.
Passage au libre-accès. Le passage du médicament soumis à prescription au marché du libre-accès génère de profonds changements dans le cycle de vie du médicament et des actions marketings qui lui sont associées :
- Le PLC n’est plus limité par la fin de la période d’exclusivité du marché suivie de l’entrée inéluctable des génériques,
- Et la réglementation du libre-accès offre plus de liberté en termes de promotion et d’utilisation des outils publicitaires.
Association thérapeutique. Elle permet l’entrée du produit sur un nouveau segment du marché (amélioration de l’observance et/ou de la facilité de prise), tout en offrant des avantages en termes de protection par un brevet. Cependant, cette tactique tend à être abandonnée en raison de la perte d’intérêt des autorités et des professionnels de santé.
La « gestion du cycle de vie du produit » en pratique
En marketing, les différentes tactiques utilisées peuvent être divisées en 2 sous-catégories :
- Le « Life Cycle Management » (LCM) focalisé sur l’élaboration et la mise ne place des indications complémentaires,
- Le « Life Cycle Prolongation » (LCP) qui rassemble les autres tactiques. Toutes sont managées entre deux périodes-clé :
- Le pré-marketing, commencé habituellement lorsque la phase III de l’indication pivot est lancée ;
- Le post-marketing qui regroupe les actions à partir du lancement du nouveau médicament.
Comme indiqué précédemment, ces tactiques devraient être étudiées et instaurées le plus tôt possible au cours du cycle, au cours du pré-marketing. Pourtant, dans la réalité, ces mises en place ne sont pas aussi précoces.
Pour les indications LCM, les décideurs préfèrent attendre un retour suffisant concernant la stabilité et la pérennité du produit sur le marché avant d’autoriser le lancement de nouvelles études dans un souci de rentabilité.
Cette volonté de rentabilité est également avancée pour justifier délai dans l’instauration des tactiques LCP.
Différents moyens qualitatifs et quantitatifs sont utilisés en pré et post-marketing pour mesurer et évaluer la performance des tactiques mises en place. Certaines sont appliquées tout au long de ces deux phases, d’autres sont employées uniquement en post-marketing :
- Outils prévisionnels (prévisions des ventes, calcul de la Valeur Actuelle Nette – VAN,…)
- Outils mesurant la notoriété du produit auprès des professionnels de santé (en particulier auprès des médecins)
- Analyses des ventes, uniquement en post-marketing (unités de volume vendues, chiffres d’affaires, parts de marché, nombre de patients,…)
Certains professionnels du domaine pharmaceutique s'interrogent sur la pertinence de décrire un seul et unique modèle de PLC alors qu’il existe actuellement plusieurs catégories de médicaments qui s’adressent à plusieurs types de marché.
Un second débat tend à s’installer depuis quelques temps parmi les spécialistes du médicament concernant la pérennité du modèle actuel du cycle de vie du produit (de sa phase de développement jusqu’à la fin de sa commercialisation). Celui-ci semble ne plus être parfaitement adapté au regard de son incapacité à répondre efficacement aux challenges actuels malgré des investissements conséquents dans une tentative de « survie » à court terme.
I
NTRODUCTION
L’industrie pharmaceutique a longtemps été considérée comme un secteur attractif, notamment grâce à un retour sur investissement spécialement significatif. Pourtant, ces dernières années ont particulièrement été difficiles pour le marché pharmaceutique. Les entreprises rencontrent un certain nombre de difficultés qui affectent à la fois leur croissance et leur stabilité sur le marché :
- Un investissement en R&D particulièrement élevé, - Une réglementation toujours plus contraignante,
- Une pression gouvernementale pour limiter les coûts liés aux dépenses de santé, - Une perte de brevet des spécialités « blockbuster » induisant une perte
conséquente de revenus.
Afin d’optimiser les différentes étapes et les investissements liés au développement et à la commercialisation, les industriels utilisent le « Product Life Cycle Management ». Concept caractérisé depuis longtemps et largement utilisé, il décrit les différents stades du produit tout au long de son cycle de vie. Les managers mettent en place les différentes actions et tactiques afin de réaliser les objectifs stratégiques rattachés à chacune des étapes du cycle.
Le « Product Life Cycle Management » est adapté et appliqué dans différents secteurs industriels. Pourtant, dans le domaine pharmaceutique, il présente des particularités qu’il est important d’identifier. En effet, Le médicament n’est pas un produit comme un autre. Mais quelles sont ses spécificités et en quoi ont-elles un impact sur le cycle de vie du médicament et son management ?
Après avoir identifié les différentes caractéristiques du médicament, du marché pharmaceutique et leur impact sur le marketing, deux mises en situation seront décrites : 2 exemples de management marketing sur 2 médicaments développés et commercialisés par l’entreprise Sanofi®.
C
HAPTER
I
-
D
RUG
D
EVELOPMENT AND CURRENT ISSUES
1.1. DEVELOPMENT & LAUNCH OF A DRUG
The drug development is a long and complex process. To commercialize only one drug, 10,000 compounds were tested and removed through process. The various steps of the development are numerous and long: from the start of drug discovery to the commercialization, fifteen years (on average) are necessary.1
This figure below describes simply the overall traditional process of a drug development from the first step of discovery until the post-marketing phase. More exactly, this description represents the development process of the classic new drugs, the New Chemical Entities (NCE) or the New Molecular Entities (NME). According the official definition of human medicine “Any substance or combination of substances – of human, animal, vegetable or chemical origin, presented as having properties for treating or preventing disease in human beings” (European Directive 2001/83/EC), other types of products are currently considered as a medicine: biologic medicines (“substances produced by living systems”) and biotherapies (“advanced therapy medicinal products”). For both of them, the discovery and development parts of process are different and more complex.
The development of a new drug requires incredible resources (human, material and financial). Which is characterized the pharmaceutical market is not only the significant investment put in any drug development (on average, more than 15% of revenues of the biggest pharmaceutical companies3) but also its large cycle time of development (around 10 to 15 years on average), starting with the discovery and ending with the launch of product on the market.
The average cost to the Research and Development (R&D) of a successful drug is usually estimated to be around $1 billion to $2 billion. This includes the cost of thousands of failed drug candidate. For every 5,000-10,000 compounds that will be analyzed and tested in the R&D, only one will be approved by the health authorities.
The number of candidates, the timeframe to develop and commercialize only one drug seem enormous but can be explained when we analyze the R&D process.
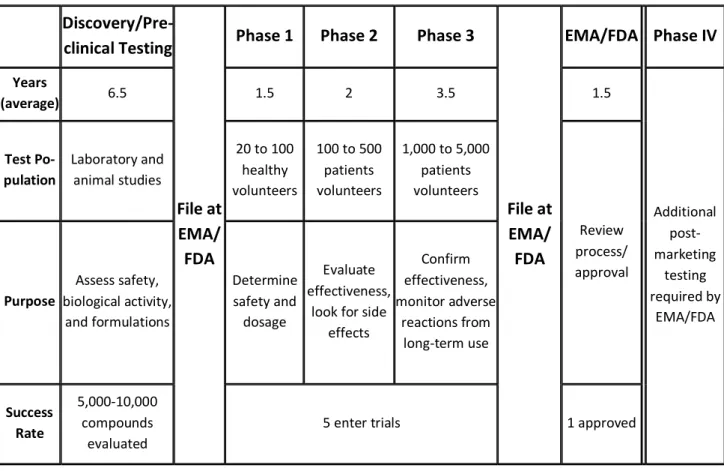
The table below summarizes the different main steps realized through the drug development process and highlights the key elements which describe each of them:
Discovery/Pre-clinical Testing
File at EMA/ FDA
Phase 1 Phase 2 Phase 3
File at EMA/ FDA EMA/FDA Phase IV Years (average) 6.5 1.5 2 3.5 1.5 Additional post-marketing testing required by EMA/FDA Test Po-pulation Laboratory and animal studies 20 to 100 healthy volunteers 100 to 500 patients volunteers 1,000 to 5,000 patients volunteers Review process/ approval Purpose Assess safety, biological activity, and formulations Determine safety and dosage Evaluate effectiveness,
look for side effects Confirm effectiveness, monitor adverse reactions from long-term use Success Rate 5,000-10,000 compounds evaluated
5 enter trials 1 approved
1.1.1. DRUG DISCOVERY &DEVELOPMENT
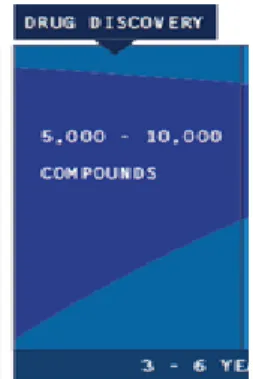
Drug discovery
The discovery process includes all early research to identify a new drug candidate and testing it in the research laboratory. The process takes approximately 3 to 6 years. By the end, the ideal situation is to be able to purpose a candidate drug to test in people.
Figure 2 Drug Discovery step5
This part can be divided into different steps: 1. target identification,
2. target validation and 3. drug discovery.
The two first steps aims to identify and target an element involved in the mechanism involved in the disease. After this identification, the next step is to find a promising molecule (a “lead compound”) that may act on this target and then may be able to modify the disease course. There are few ways to find a lead compound:
Non clinical trials
This step gives information about the safety, toxicity, pharmacokinetics and metabolism profile of this NCE thanks to lab and animal testing. These parameters have to be assessed prior to human clinical trials. Another major objective of the preclinical phase of drug development is to make a recommendation of the dose and schedule of administration which are used the first time in the first phase of the human clinical trial. It is called "first-in-man" or First Human Dose.
In vitro and in vivo tests are used during this phase. The competent health authorities
require exhaustive data, in particular about the safety profile of candidates, before the candidate drug will be authorized to be studied in humans.
During this stage researchers also have to formulate the process necessary to the production of large enough quantities of the drug for clinical trials. Techniques for producing a drug in the laboratory on a small scale do not translate easily to larger production. This is the first scale up.
Drug Development
Figure 4 Clinical Trials
A candidate drug must go through extensive studies in humans, and it must prove to be safe and effective before being submitted and approved by the health authorities. This process involves a series of clinical studies, each with its own specific goals and requirement.
The clinical trials process is both expensive and time-consuming and has a high level of attrition rate. From start to end it, this process takes an average of 6-7 years.
During all the clinical phases, the company sponsoring the research must provide regular reports to the health regulatory agencies and the official institutions giving the authorization for the medical institutions to perform clinical studies.
Phase 1 Clinical Trial:
The aim of this phase is to perform initial human testing in a small group of healthy volunteers.
In Phase 1 trials the candidate drug is tested in human population for the first time. These studies are usually conducted with about 20 to 100 healthy volunteers. The main goal of a Phase 1 trial is to determine if the drug is safe in humans.
The pharmacokinetics properties of the drug are also studied. This trial is closely monitored to help to determine what the safe dosing range is and if it should move on to further development.
Phase 2 Clinical Trial:
Test in a small group of patients
Phase 2 trials are designed to determine the candidate drug’s effectiveness and evaluated in about 100 to 500 patients affected by the disease or condition under study, and analyze the potential short-term side effects (adverse events) and risks associated with taking the drug.
They also try to answer these questions: Is the drug working by the expected mechanism? Does it improve the condition in question? Researchers also determine optimal dose and schedules for using the drug. If the drug continues to show promise, they prepare for the much larger Phase 3 trials.
Phase 3 Clinical Trial:
In Phase 3 trials the drug candidate is tested in a larger number of patients (about 1,000-5,000) to generate statistically significant data about safety, efficacy and the overall benefit-risk relationship of the drug. Phase 3 is the key step of drug development in determining if the drug candidate is safe and effective. It also provides the basis for labeling instructions to give advice and recommendations to ensure proper use of the drug (e.g., contraindications, information on potential interactions with other medicines…). Phase 3 trials are both the costliest and longest trials.
1.1.2. APPROVAL
Figure 5 Drug Development stages
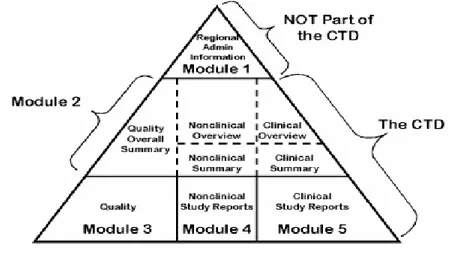
At the end of the drug development and if the data resulting of this process are considered as satisfactory by the company sponsoring the drug candidate, application to market is submitted. An official document is drafted: the Common Technical Document (CTD). It is a set of specification for application dossier for the registration of medicines. It is used across Europe, Japan and the United States (US). This application document must present substantial evidence about the characteristics of the drug: it has to contain obviously safety and efficacy data of the drug candidate but also all the information collected during the drug development process (conditions of use, recommendation about the prescription…).
The organization of the CTD is internationally harmonized. It is divided into five modules6: 1. Administrative and prescribing information. This module is not really a part of the
CTD because it is specific each country (Europe, US, Japan…) 2. Overview and summary of modules 3 to 5
4. Non clinical data 5. Clinical data
Figure 6 CTD Triangle6
The condition and the timeframe to get or not the approval are dependant of the procedure selected for the applicant and the applicable committee which delivers it.
Submit application for approval to Food & Drug Administration (FDA)
If these clinical data demonstrate that the experimental drug is both safe and effective, the company files a New Drug Application (NDA) or a Biological License Application (BLA) to get required approval to commercialize the drug.
The NDA (or BLA) includes all of the information from the previous years of study, as well as the proposals for manufacturing and labeling of the new medicine.
The application is reviewed by FDA’s Center for Drug Evaluation and Research (CDER)7 which assess all the information included in the file to determine if the demonstration that the medicine is safe and effective is enough relevant and reliable to be approved. Following rigorous review, the FDA can either:
1) approve the medicine,
2) send the company an “approvable” letter requesting more information or studies before approval can be given, or
On average, 6 months are necessary for reviewing priority approval and almost one year in case of standard approvals8.
European Medicines Agency (EMA) Drug Approval Process
In Europe, there are four different types of procedure to get the marketing approval (MA)9:
- National procedure. The procedure for getting approval is submitted to each European Union (EU) member states in which the company expects to commercialize its drug candidate. It is significant time-consuming procedure to get only nationally marketed products.
- Decentralized procedure. It is used for products which fall outside the scope of the EMA centralized procedure. It corresponds to a simultaneous authorization in numerous countries in the EU.
- Mutual recognition procedure. Only one request is submitted to one country in the EU. The final decision will be accepted by the other countries.
- Centralized procedure10. The EMA has selected a numerous categories of medicines for which this procedure is mandatory: biotechnology products, orphan medicines, and new substances for the treatment of some diseases – oncology, AIDS, diabetes & CNS… One authorization applied to all countries in the EU. The market application is evaluated by the Committee for Medicinal Products for Human Use (CHMP) which gives a recommendation to the final decision maker, the European Commission.
According to the characteristics of the drug candidate (chemical characteristic of the Active Ingredient, indication submitted, type of population targeted…) and the strategic plan associated with it (national, international…), the company can choose one of these procedures, national or international.
Market Exclusivity
A new brand drug is protected thanks two different ways which can be existed alone but usually combined11:
- Patent protection
- Protection of clinical data, particularly relevant for the off-patent products The procedures are different between the US and the EU.
United States
- Protection of product. Two elements can be applied: patent (period of 20 years maximum) potentially adjusted by a Patent-Term Extension (PTE) estimated according to some specific requirements12.
- Marketing exclusivity. The period is between three and five years (new indication/new formulation form and new NME status respectively) from the date of FDA’s approval13.
European Union
- Protection of product: a 20-year period of patent protection, plus the Supplementary Protection Certificate (SPC) which extends the effective patent life up to a maximum of 15 years from the first approval in the EU, in order to compensate for delays in bringing new products to market caused by regulatory requirements (but does not exceed 5 year after the expiry of patent) 11.
- Data protection – 8+2+ (1). Data of the originator product are protected for a 10-year period from the date of the first approval in the European Community (generic company can use these data during the two last years to draft its application file). A one-year period of extension can be approved if a new significant application is approved during the eight first years of exclusivity11.
1.1.3. POST AUTHORIZATION ACTIVITIES
Figure 7 Drug Development & Commercialization
After getting the approval, 2 to 3 years of administrative procedures are needed before drug marketing14. These procedures include price & reimbursement processes and the launch of product.
Pricing & reimbursement stage
The MA (or NME in US) is the essential step for the success and the commercialization of a new medicine. But it is not the last one for the prescribed drug before commercialization. The further main step is the negotiation around the price and the reimbursement of the new drug. Getting the approval does not mean getting a reimbursement. This negotiation takes place at the national level and governmental institutions may significantly influence drug’s prices
This step is critical because it determines the potential access to the drug by patients (limitations of the size of population if the reimbursement is too low and/or the drug too expensive). It is also essential because the agreement about the evolution of new drug’s price through its marketing exclusivity is also negotiated between company and national agency.
Three elements may influence this negotiation:
- The application document including various information (CTD, targeted population…)
- The recommendation given by the health authority which has assessed the previous file
- The forecasted assessed by the pharmaceutical company concerning the revenues and market share related to the new drug
Commercialization & Pharmacovigilance
After complying with all these stages, the drug is then launched and managed on the market. Two activities are taking place around it: the medical and marketing activities.
- Medical activities include two parts. The first focuses on further clinical studies undertaken to clarify the characteristics of the compound and try to increase the size of the population targeted by the drug. The second phase corresponds to the pharmacovigilance (or Phase IV). Starting from the clinical stage, this activity is pursued throughout the product life cycle of the drug. Its aim is to collect, monitor, assess and report information from physicians and patients about the adverse effects of medications and reporting them to competent authorities and healthcare professionals.
- Marketing activities. They gather all actions undertaken by marketers to succeed the launch of the drug, its recognition by health professionals and maintain its position on the market.
1.2. CURRENT ISSUES OF THE PHARMACEUTICAL MARKET
The pharmaceutical companies are under pressure from a various issues, including losses of revenue (due to patent expirations, increasingly constraints of reimbursement) and an increase of regulatory requirements.
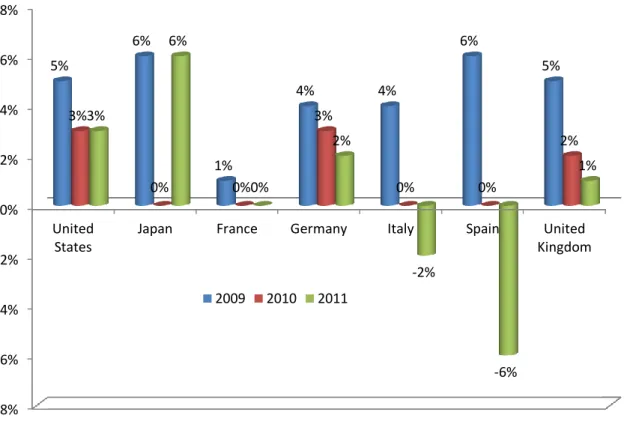
The results of the pharmaceutical industry’s profitability and its growth are the consequences of these issues as we can see with the graph below:
Figure 8 Evolution of the growth rate of revenues in the main pharmaceutical markets (LEEM 2012)
In US, the annual growth rate has decreased down to 3% in 2011 compared to 8% of growth between 2002 and 2006 (EFPIA 2012)
In Europe, the pharmaceutical industry is much more slowed:
- In Germany and in the UK, their annual growth is still positive (2% and 1% respectively)
- In France, the evolution of the market is completely stopped since 2010 - In Italy and Spain, the sales revenues decreased in 2011
The trend of the overall slowdown in the pharmaceutical market is confirmed by a low level of production in 2011: -8% -6% -4% -2% 0% 2% 4% 6% 8% United States
Japan France Germany Italy Spain United Kingdom 5% 6% 1% 4% 4% 6% 5% 3% 0% 0% 3% 0% 0% 2% 3% 6% 0% 2% -2% -6% 1% 2009 2010 2011
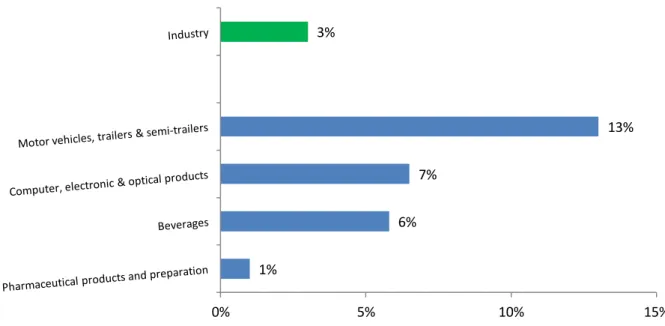
Figure 9 Annual growth rate for the index of industrial production (IPI), EU-27, 2011 (Eurostat data)
In the EU, the growth rate for the IPI in the pharmaceutical field reached only 1 % compared to the growth for the IPI in the overall European industrial sector which is 3 %15.
This lack of dynamism in the pharmaceutical field may be explained by various issues associated to the drug development described below:
Figure 10 R&D model yielding costs to successfully discover and develop a single NME16
1% 6% 7% 13% 3% 0% 5% 10% 15%
The model16 describes the different steps into the drug discovery and development, from the initial stage of target-to-hit to the final stage, launch.
It highlights some internal factors (R&D parameters) which have an impact on company’s profitability:
- Cost
- Attrition rate - Cycle time - Clinical trials
These factors are intimately related to the substantial and sustainable R&D productivity16. Other external parameters influence the profitability and sustainability of pharmaceutical market: payer pressure and generic & biosimilar erosion.
1.2.1. R&DPRODUCTIVITY
Since few years, various shareholders of the pharmaceutical market have noticed a slowdown of the new drug’s production: the long-term average is merely one new remedy drug a year per company, despite R&D spending at a high of 18% of revenues16. Among all the challenges faced by the pharmaceutical industry, improving R&D productivity may be one of the most important. Even if the company is able to manage and ideally reduce the impact of the factors which influence its profitability and its growth (patent expiration, payer pressure)… without manage and optimize the R&D productivity, the company may not be sustainable.
Definition of R&D productivity16
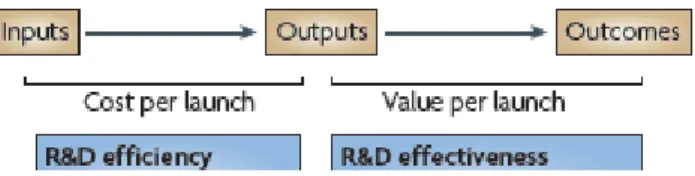
R&D productivity can be simply defined as the relationship between the value (medical and commercial) created by a new medicine (considered here to be an NME) and the investments required to generate that medicine. However, R&D productivity can be elaborated in two important dimensions: inputs leading to outputs, or R&D efficiency; and outputs leading to outcomes, or R&D effectiveness (figure below).
Figure 11 Dimensions of R&D Productivity16
R&D efficiency represents the ability of an R&D system to translate inputs (for example, ideas, investments, effort) into defined outputs (as internal milestones), generally over a defined period of time. The question related to this dimension is “if commercialization (after getting the regulatory approval) of an NME is the desired output, how can this be achieved with greater efficiency (that is, at a lower cost)? “
R&D effectiveness can be defined as the ability of the R&D system to produce outputs with certain intended and desired qualities (for example, medical value to patients, physicians and payers, and substantial commercial value).
Thus, R&D productivity can be viewed as a combination of both the efficiency and effectiveness of the drug discovery and development process; the goal of a highly productive R&D system is to efficiently translate inputs into the most desired and valuable outputs.
So, the key questions are where, how and by how much can R&D productivity be improved?
Below is detailed an analysis of R&D productivity (previously described) which modeling the essential elements of contemporary drug discovery and development that account for the current cost of a new medicine.
Figure 12 R&D model yielding costs to successfully discover and develop a single new molecular entity16
R&D parameters include:
- the attrition rate related to the each stage,
- number of candidates (work in process WIP) needed in each stage of development to succeed one product launch,
- the cost assigned at each step,
- the cycle time required to progress through each stage of development
- and the cost of capital (reflecting the returns required by shareholders to use their money during the lengthy R&D process)
These factors are intimately related to the substantial and sustainable R&D productivity. Based on the assumptions for success rate, cycle time and cost, the model further calculates the ‘out of pocket’ cost per phase as well as the total cost to achieve one NME per year (US$873 million).
By capitalizing the cost (cost out of pocket multiplied by the cost of capital), the account of drug development to launch successfully one medicine is $1,178 million (this model does not integrate the costs related to exploratory discovery research, fees not directly linked to R&D activities and post launch expenses).
Cost issues
Figure 13 Pharmaceutical R&D Expenditure in Europe & USA ($ million), 1990-2011 (source EFPIA)
(e): estimate
For twenty years, the pharmaceutical R&D expenditure has never stopped to reach in 2010 more than 74 $ billion in countries which invest the most in the pharmaceutical R&D department (EFPIA 2012):
- in Europe, the financial investment has been multiplied by 3.6 between 1990 and 2010
- in the USA, the R&D budget was been multiplied by 6.
Since last year, the R&D expenses in USA and Europe is decreasing slightly. Between 2010 and 2011, the expenses decreased of:
- 5% in USA - 1% in Europe
This decrease is likely related to the reduction of the overall pharmaceutical profits. Previously, the significant growth of expenditure was supported by the large sales revenues generated mainly by blockbusters. But with the loss of patent and marketing
10096 14929 23204 28534 36135 35750 (e) 6803 11874 21364 30969 40688 38530 (e) 0 5000 10000 15000 20000 25000 30000 35000 40000 45000 1990 1995 2000 2005 2010 2011 Europe USA
protection of major blockbuster (without competitive replacement), the manufacturers have no longer enough budget to maintain the high level of financial investment to develop a new drug.
With the current model, how be able to produce successfully new drugs in the next years which could generate enough cash return for the industry’s survival?
Current cost of development:
Figure 14 Cost required at each step of the drug development process
While it used to cost less than $1 billion ($842m) to launch a drug in 1999, the cost went as high as nearly $2 billion ($1,778m) in 2010.17
The large investment required for the successful development of only one drug influences the decision making about the nature and the characteristic of potential drug selected to be developed. Decision making will be based on criteria considered as reliable to get sufficient return on investment:
- Targeting a large population who would treat by the medicine - Duration of therapy (chronic versus acute)
- Product with high level of complexity which could justify its high price
According to this, pharmaceutical companies would disregard some indications considered as less relevant for sufficient cash return.
Attrition rate
Figure 15 Attrition rate at each step of drug development
The major causes of attrition in the clinic were lack of efficacy (accounting for approximately 30% of failures) and safety (toxicology and clinical safety accounting for a further approximately 30%)16. The lack of efficacy might be contributing more significantly to therapeutic areas in which animal models of efficacy are notoriously not predictive, such as CNS and oncology, both of which have relatively higher failure rates in Phase II and III trials.
Cycle Time
Figure 16 Average time span of every stage of drug development
The average time from synthesis of a self-originated NME to approval of a NDA has increased significantly, from an average 7.9 years in the 1960s to 12.8 years in the 1990s. Much of the increase is due to increases in clinical trial length (the time from filing of an Investigational New Drug (IND) application to NDA submission). This can be attributed to a variety of factors, including increased regulatory requirements, the need for more study subjects in clinical trials, an increasing difficulty of recruiting subjects for clinical trials, and the nature of the diseases being investigated. In addition, the average number of
procedures performed on patients has increased by 118% in Phase II and 51% in Phase III clinical trials18.
1.2.2. CLINICAL TRIALS CONSTRAINTS
As we can see with the model previously described, clinical trials are the critical steps of drug development, due to:
- Highest attrition rates - Highest costs
- Highest cycle times
These parameters are inherently linked to the characteristics of the clinical trials themselves:
- Sample. To have significant statistical data and be considered reliable, the sample of population must be sufficiently important in term of size. But this is will have an impact on the logistic aspect (and fees around it) and the duration of studies (time for inclusion…)
- Multicenter. - Attrition rate
- Long term safety. With the last decades, the regulatory agencies (and physicians) are more and more concerned about safety profile of the administered drugs. The companies have to include significant long term safety data in their application file which has an impact on the cost and the cycle time of drug development.
1.2.3. APPROVAL
To be competitive, pharmaceutical companies have had to re-think the allocation of resources to:
- Invest sufficiently to maintain performance in term of technologies, knowledge, know-how
- Increase the timeframe of development
- Increase the R&D spending to produce and commercialize successfully one new drug
But, despite those significant efforts, the number of New Molecular Entities (which include NDA & BLA) approved by the competent agencies seems to reach a limit: for a decade, around 30 NME are approved every year in worldwide.
Figure 17 Number of New Chemical or Biological Entities, 1992-2011
- calculations according to nationality of mother company- (EFPIA 2012)
And the decrease seems to be confirmed when the NME approvals granted by the FDA’s CDER:
Figure 18 NME Applications Filed and Approved by FDA’s Center for Drug Evaluation & Research (1997-2012)19, 20
N.B: NMEs include both New Drug Applications (NDAs) and Biologics License Applications (BLAs). 219 196 148 149 0 50 100 150 200 250 1992-1996 1997-2001 2002-2006 2007-2011 Europe USA Japan Others
0 5 10 15 20 25 30 35 40 45 50 1997 1998 1999 2000 2001 2002 2003 2004 2005 2006 2007 2008 2009 2010 2011 Jan-Nov 2012
For the past decade, CDER has approved an average of 23 NMEs per year. This includes applications for both New Drug Applications (NDAs) and Biologics License Applications (BLAs). This situation may be explained by the stable number of applications filed for NMEs7.
But this number should be weighted because the term “NME” gathers a large number of various “new drugs”. For example, it integrates the me-too drugs which are rarely a real innovation for taking care patients and their diseases.
In 2012 (from January to November), 26 NMEs have been approved. But only 5 of them have gained a “Priority Review” status. This designation integrates drugs that appear to represent an advance in medical care over available therapy20.
1.2.4. PAYERS PRESSURE
Over the past decade, serious concerns have appeared about the pharmaceutical industry’s integrity and transparency. During these years, this industry has faced accusation and preoccupation about drugs, in particular concerning their safety and efficacy. To illustrate this, the most recent event is Servier©’s case and the misuse of Mediator®. These troubles have altered the industry’s image and its reliability, resulting in increased regulatory pressure.
Furthermore, in addition to the pressure to reacquire the confidence of payers and patients, pharmaceutical companies have now to face economic issues.
For several years, governments have tried to find solutions to decrease health expenditures and limit budget healthcare deficits. Political pressure has increased during the recent economic and health crisis. This pressure focuses on:
- Limitations price and reimbursement - Requirement of more safety data - Promote further health cost savings
- It induce significant cost and/or benefits over existing treatments
One of the strategies proposed by pharmaceutical industry is to change their drug portfolio from primary care driven blockbusters (painkillers, anxiolytics, hypolipemia drugs…) towards specialties such as oncology, immunology and inflammation, where the medical need is so high that prices are more easily accepted by regulators.
But it is a short-term solution due to the arrival of competition which will offer arguments to payer for limiting price of new medicines.
1.2.5. GENERICS AND BIOSIMILARS
With a growing need for countries to limit expenses, the generic penetration is as strong as ever (generic penetration including generic drugs and biosimilars)21:
- In Germany and the UK, the generics represents more than 60% of the global pharmaceutical market22
- In France, the generics in the reimbursable drug market will exceed 24% of market share23
- In the USA, the generic market approaches 70% of all prescriptions written16 - In China, generic drugs represent 63% of the pharmaceutical market24.
Moreover, with the key patent expirations between 2010–2014 (i.e. Lipitor® or Zyprexa®), a diminishment of sales revenues estimated to $113 billion would be noticed following the generic substitution. Indeed, for every dollar lost in declining product revenues due to patent expirations by 2012, it has been estimated that large-cap pharmaceutical companies will only be able to replace on average 26% with new product revenues16. Generics
Through incentive policies (e.g. “Hatch-Waxman Act "or" Drug Price Competition and Patent Term Restoration Act" in 1984 which has authorized generic manufacturers to use the data of originator drugs), generics have become an inalienable component in the environment of the prescription medicines.
- Price of a generic may be around 60% less than that of the original brand just after the loss of patent protection. After one year, when several generic copies have been marketed, the average price may have decrease to less than 20% of the original21.
- Governments measures fostering the use of generics towards28:
o Generic manufacturers (pressure to introduce generics and fast generic approval)
o Physicians which have recommendation to use active ingredient formularies and prescription ceilings
o Pharmacists with substitution rights and financial incentives to increase generics’ sales in their business.
o Patients (increased copayment, generic campaign)
- Adequate Market Size. Because the main interest of generics is the reduction of costs inversely proportional to volume, the size of the market is an important consideration. For example, a common and chronic condition that requires long-term treatment implies a sustainable and large-scale demand for appropriate products.
- Categories of drugs. The generics target more often drugs that are prescribed mainly by family doctors than those prescribed by specialists. Two main factors may explain this selection:
o Specialists are often the first prescribers of newly developed drugs. Thus, awareness of generics is relatively low among these physicians.
o The cost of generics is low. Primary care doctors tend to be more aware of medicine costs than the specialist community. The pressure to monitor the health costs under control is more intense for primary healthcare.
For few years, a new type of generic product has been commercialized: the biosimilar drugs. But these new products differ significantly from classic generics in term of development (cost and timeframe) and regulatory requirements.
Biosimilar particularities
Biosimilars are copies of biologic drugs. They are also known as biogenerics and follow-on biologics. Unlike a conventional generic, which is an identical copy of the original molecule, a biosimilar is an approximation.
In the follow-on biologics market, the first drug has been approved only in 200621. Even today, there are still only few categories of drugs in which biosimilars have been approved (EPO, G-CSF, hGH).
In 2011, the total biosimilar product sales will amount to $250 million (half at least in the U.S.) which corresponds roughly to only on thousandth of the total generic market estimated to $225 billion21. Beyond 2016, biosimilars of expensive biologics should be commercialized, which would significantly increase these estimates.
The low development of biosimilars can be explained by many challenges that generic companies have to deal with:
- Ability to develop a follow-on version. Because biologic drugs are more complex than the traditional chemical medicines, it requires more competencies. It is complex both to isolate and characterize the various components of the originator drug and to be able to reproduce one.
- Processing a biologic molecule. Because almost all generic companies came from the chemistry industry, they have to make significant investments to change their infrastructures to be able to receive a biosimilar product in their production line. But organizing successfully a production channel and manufacturing biologics require skills and know-how dramatically different from generic products.
- Regulatory hurdles for the introduction of biosimilar:
o Requirements to get biosimilar’s approval are stronger than those for generic compound (addition of toxicology, non-clinical and clinical studies) o In US, a very long period without of a well-defined statutory framework for obtaining regulatory approval until recently (in February 2012, publication of three guidance documents to assist industry in developing biosimilar products26)