Primary sclerosing cholangitis (PSC) is a severe liver disease
of unknown etiology leading to fibrotic destruction of the bile
ducts and ultimately to the need for liver transplantation
1–3.
We compared 3,789 PSC cases of European ancestry to 25,079
population controls across 130,422 SNPs genotyped using
the Immunochip
4. We identified 12 genome-wide significant
associations outside the human leukocyte antigen (HLA)
complex, 9 of which were new, increasing the number of known
PSC risk loci to 16. Despite comorbidity with inflammatory
bowel disease (IBD) in 72% of the cases, 6 of the 12 loci
showed significantly stronger association with PSC than with
IBD, suggesting overlapping yet distinct genetic architectures
for these two diseases. We incorporated association statistics
from 7 diseases clinically occurring with PSC in the analysis and
found suggestive evidence for 33 additional pleiotropic PSC
risk loci. Together with network analyses, these findings add
to the genetic risk map of PSC and expand on the relationship
between PSC and other immune-mediated diseases.
The pathogenesis of PSC is poorly understood, and, owing to the
lack of effective medical therapy, PSC remains a leading
indica-tor for liver transplantation in northern Europe and the United
States
5, despite its relatively low prevalence (1 in 10,000). Affected
individuals are diagnosed at a median age of 30–40 years and suffer
from an increased frequency of IBD (60–80%)
5,6and autoimmune
diseases (25%)
7. Conversely, approximately only 5% of
individu-als with IBD develop PSC
5,6. Sibling relative risk of 9- to 39-fold
indicates a strong genetic component to PSC risk
8. In addition
to multiple strong associations within the HLA complex, recent
association studies have identified genome-wide significant loci at
1p36 (MMEL1-TNFRSF14), 2q13 (BCL2L11), 2q37 (GPR35), 3p21
(MST1), 10p15 (IL2RA) and 18q21 (TCF4)
9–13.
Several theories have been proposed to explain the development
of PSC
5. The strong HLA associations and the clinical occurrence
of PSC with immune-mediated diseases suggest that autoimmunity
has a role in pathogenesis. To further characterize the genetic
etio-logy of PSC, we recruited individuals with PSC throughout Europe
and North America, more than doubling the number of ascertained
cases included in previous genetic studies
11. We genotyped 196,524
SNPs in 4,228 PSC cases and 27,077 population controls (Online
Methods and Supplementary Note) using the Immunochip
4,14,
a targeted genotyping array with dense marker coverage across 186
known disease loci from 12 immune-mediated diseases. Outside
these 186 loci, the Immunochip also assays thousands of SNPs of
intermediate significance from multiple meta-analyses of
immune-mediated diseases.
Dense genotyping of immune-related disease regions
identifies nine new risk loci for primary sclerosing cholangitis
A full list of authors and affiliations appears at the end of the paper.
Received 9 October 2012; accepted 29 March 2013; published online 21 April 2013; doi:10.1038/ng.2616
table 1 Association results of 12 non-HlA genome-wide significant risk loci for PsC
Chr. SNPa alleleRisk casesRAF controlsRAF P value OR (95% CI) LD regionb
(kb) RefSeq genes in LD region Notable nearby genesc annotationFunctional d
1p36 rs3748816 A 0.698 0.656 7.41 × 10⁻¹² 1.21 (1.14–1.27) 2,398–2,775 9 MMEL1-TNFRSF14 eQTL, MS, OC, PB, HM
2q33 rs7426056 A 0.277 0.229 1.89 × 10⁻²⁰ 1.30 (1.23–1.37) 204,155–204,397 1 CD28 HM, OC 3p21 rs3197999 A 0.352 0.285 2.45 × 10⁻²⁶ 1.33 (1.26–1.40) 48,388–51,358 89 MST1 eQTL, MS, OC, PB, HM 4q27 rs13140464 C 0.871 0.836 8.87 × 10⁻¹³ 1.30 (1.21–1.40) 123,204–123,784 4 IL2-IL21 OC, PB 6q15 rs56258221 G 0.213 0.183 8.36 × 10⁻¹² 1.23 (1.16–1.31) 90,967–91,150 1 BACH2 OC, PB 10p15 rs4147359 A 0.401 0.349 8.19 × 10⁻¹⁷ 1.24 (1.18–1.30) 6,070–6,206 2 IL2RA PB 11q23 rs7937682 G 0.298 0.265 3.17 × 10−09 1.17 (1.11–1.24) 110,824–111,492 19 SIK2 OC, PB, HM 12q13 rs11168249 G 0.506 0.466 5.49 × 10−09 1.15 (1.10–1.21) 46,442–46,534 3 HDAC7 OC, PB, HM 12q24 rs3184504 A 0.527 0.488 5.91 × 10⁻¹¹ 1.18 (1.12–1.24) 110,186–111,512 16 SH2B3-ATXN2 MS, OC, HM 18q22 rs1788097 A 0.518 0.483 3.06 × 10−08 1.15 (1.10–1.21) 65,633–65,721 2 CD226 MS, OC, PB, HM 19q13 rs60652743 A 0.864 0.836 6.51 × 10⁻¹⁰ 1.25 (1.16–1.34) 51,850–51,998 6 PRKD2-STRN4 OC, PB, HM 21q22 rs2836883 G 0.777 0.728 3.19 × 10⁻¹⁷ 1.28 (1.21–1.36) 39,374–39,404 – PSMG1 OC, PB, HM
Chr., chromosome; RAF, risk allele frequency; OR, odds ratio; CI, confidence interval; HM, overlaps a region of histone modification; MS, missense mutation; OC, overlaps a known region of open chromatin; PB, overlaps a region of protein binding.
aSNPs from new PSC-associated loci are shown in bold. bLD regions around lead SNPs were calculated by extending a distance of 0.1 cM in both directions as defined by the HapMap
recombination map. cCandidate genes within the same LD region as the associated SNPs. dDenotes whether there are SNPs with r2 > 0.8 with the top SNP that have functional annotations
(supplementary tables 4–7).
npg
© 2013 Nature
America, Inc.
After quality control (Online Methods), 130,422 SNPs from 3,789
PSC cases and 25,079 population controls were available for analysis
(Supplementary Figs. 1 and 2 and Supplementary Tables 1 and 2). We
imputed a further 80,183 SNPs located in the Immunochip fine-mapping
regions using the 1000 Genomes Project reference panel (Online
Methods). We performed case-control association tests using a linear
mixed model as implemented in MMM
15to minimize the effect of
popu-lation stratification and sample relatedness (genomic infpopu-lation factor
λ
GC= 1.02, estimated using 2,544 ‘null’ SNPs, that is, SNPs located outside
of known risk loci for immune-mediated diseases; Online Methods).
We identified 12 non-HLA genome-wide significant (P < 5 × 10
−8)
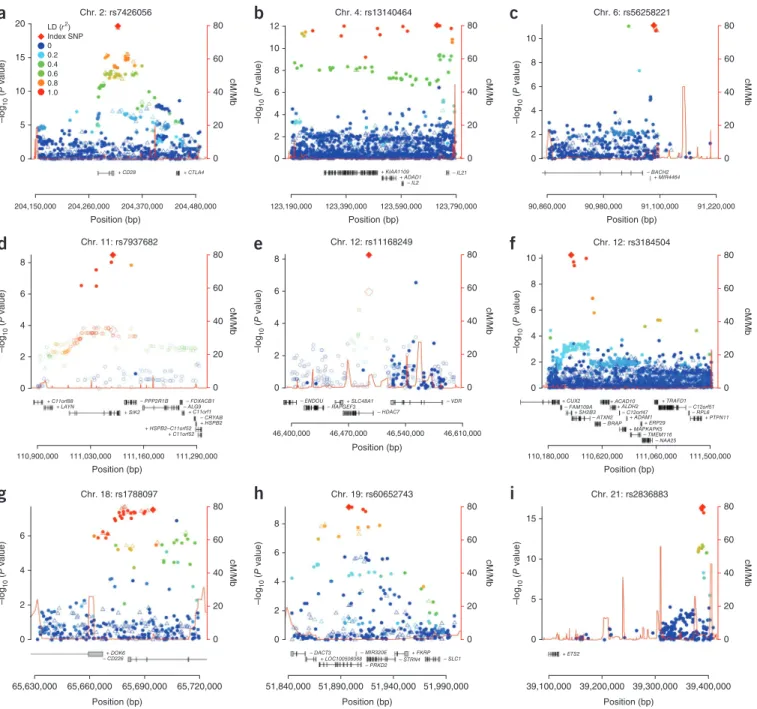
susceptibility loci (Table 1), 9 of which were new (Fig. 1). The most
associated SNP within each locus was a common variant (all risk allele
frequencies > 0.18) of moderate effect (odds ratios (ORs) between 1.15
and 1.33) (Table 1). Genotype imputation and stepwise conditional
regression analyses
16within each locus did not identify additional
independent genome-wide significant signals, nor did
genotype-genotype or sex-genotype-genotype interaction analyses (Online Methods).
For seven of the nine new loci, the most significantly
associ-ated SNP in the locus was the same SNP or was in strong linkage
80 60 40 20 0 8 6 4 2 0 46,400,000 46,470,000 46,540,000 46,610,000 Chr. 12: rs11168249
e
+ SLC48A1 – ENDOU – RAPGEF3 – HDAC7 – VDR Position (bp) –log 10 ( P value) cM/Mb 80 60 40 20 0 10 8 6 4 2 0 110,180,000 110,620,000 111,060,000 111,500,000 Chr. 12: rs3184504 – NAA25 – TMEM116f
+ CUX2 + SH2B3 + ACAD10 + ALDH2 + ADAM1 + ERP29 + MAPKAPK5 + TRAFD1 + PTPN11 – FAM109A – ATXN2 – BRAP – RPL6 – C12orf51 – C12orf47 Position (bp) –log 10 ( P value) cM/Mb 80 60 40 20 0 8 6 4 2 0 110,900,000 111,030,000 111,160,000 111,290,000 Chr. 11: rs7937682 + C11orf52d
+ C11orf88 + LAYN + SIK2 + C11orf1 + HSPB2–C11orf52 + HSPB2 – PPP2R1B – FDXACB1 – ALG9 – CRYAB Position (bp) –log 10 ( P value) cM/Mb Position (bp) –log 10 ( P value) cM/Mbb
+ KIAA1109 + ADAD1 – IL2 – IL21 12 10 8 6 4 2 0 80 60 40 20 0 123,190,000 123,390,000 123,590,000 123,790,000 Chr. 4: rs13140464 Position (bp) –log 10 ( P value) cM/Mbc
+ MIR4464 – BACH2 10 8 6 4 2 0 80 60 40 20 0 90,860,000 90,980,000 91,100,000 91,220,000 Chr. 6: rs56258221 Position (bp) –log 10 ( P value) cM/Mb 20a
Chr. 2: rs7426056 LD (r2) Index SNP 0 0.2 0.4 0.6 0.8 1.0 15 10 5 0 + CD28 + CTLA4 204,150,000 204,260,000 204,370,000 204,480,000 80 60 40 20 0 Position (bp) –log 10 ( P value) cM/Mb 80 60 40 20 0 8 6 4 2 0 51,840,000 51,890,000 51,940,000 51,990,000 Chr. 19: rs60652743h
– DACT3 – MIR320E – PRKD2 – STRN4 – SLC1 + FKRP + LOC100506068 Position (bp) –log 10 ( P value) cM/Mb 80 60 40 20 0 0 5 10 15 39,100,000 39,200,000 39,300,000 39,400,000 Chr. 21: rs2836883i
+ ETS2 Position (bp) –log 10 ( P value) cM/Mb 80 60 40 20 0 6 4 2 0 65,630,000 65,660,000 65,690,000 65,720,000 Chr. 18: rs1788097g
+ DOK6 – CD226Figure 1 Regional association plots of the nine loci newly associated with PSC at genome-wide significance (P < 5 × 10
−8). (
a–i) Filled circles represent
directly genotyped SNPs, and unfilled triangles represent imputed SNPs (Online Methods). The color of the markers shows LD with the most strongly
associated SNP. Results are shown for SNPs rs7426056 (
a), rs13140464 (b), rs56258221 (c), rs7937682 (d), rs11168249 (e), rs3184504 (f),
rs1788097 (
g), rs60652743 (h) and rs2836883 (i). Because the most strongly associated SNPs in d and e are located outside Immunochip
fine-mapping regions, association results from the discovery panel of the largest PSC genome-wide association study (GWAS) so far
12are shown as unfilled
circles, and the most associated SNP at each locus is shown as an unfilled diamond (genotyped and imputed HapMap release 22 SNPs; cases overlap
with those in the current study). Plus and minus signs by the gene symbols refer to the direction of gene transcription.
npg
© 2013 Nature
America, Inc.
disequilibrium (LD; r
2> 0.8) with the original association reported
for another disease (Supplementary Table 3). The two exceptions
were 11q23, where only independent disease associations (r
2< 0.01)
have so far been reported
17, and 6q15, where the most significantly
associated PSC variant, rs56258221 (OR = 1.23; P = 8.36 × 10
−12),
was in low-to-moderate LD with the previously reported BACH2
variants in Crohn’s disease (r
2= 0.23) and type 1 diabetes (r
2= 0.12).
Three out of four known non-HLA PSC risk loci present on the
Immunochip passed genotyping quality control and were confirmed
in our analysis (1p36, 3p21 and 10p15; Supplementary Fig. 3 and
Supplementary Note).
To prioritize candidate genes within the non-HLA
genome-wide significant loci, we searched for the functional consequences
of the most associated SNPs or the SNPs in high LD with these
(r
2> 0.8), focusing on missense SNPs (Supplementary Fig. 4 and
Supplementary Table 4) and expression quantitative trait loci
(eQTLs) (Supplementary Table 5), and we functionally annotated risk
loci using data from the Encyclopedia of DNA Elements (ENCODE)
Project (Supplementary Table 6 and Supplementary Note)
18. We also
constructed networks on the basis of functional similarity measures
(Online Methods and Supplementary Fig. 5), known protein-protein
interactions (DAPPLE
19; Supplementary Table 7 and Supplementary
Note) and the published literature (GRAIL
20; Supplementary Fig. 6
and Supplementary Note) to identify disease-relevant genes.
For 6 of the 12 genome-wide significant loci, the same gene
(MMEL1, CD28, MST1, SH2B3, CD226 and SIK2) was annotated by
more than 1 method (Supplementary Table 7), suggesting these as
candidates for further investigation at these loci.
Two newly associated loci are located outside of the Immunochip
fine-mapping regions (Fig. 1d,e). At 11q23, the most strongly
asso-ciated SNP, rs7937682 (OR = 1.17; P = 3.17 × 10
−9), is located in
an intron of SIK2 (encoding salt-inducible kinase 2), which
influ-ences the expression of both interleukin (IL)-10 in macrophages
and Nur77, an important transcription factor in leukocytes
21. The
association at 12q13 was with an intronic SNP, rs11168249 (OR =
1.15; P = 5.49 × 10
−9), within the HDAC7 gene (encoding histone
deacetylase 7), which has also been associated with IBD
22. HDAC7
has been implicated in the negative selection of T cells in the
thy-mus
23, a key process in the development of immune tolerance.
A role for HDAC7 in PSC etiology is supported by the new association
at 19q13, where the most associated SNP, rs60652743 (OR = 1.25;
P = 6.51 × 10
−10), is located within an intron of PRKD2 (encoding
serine-threonine protein kinase D2). When T cell receptors of
thy-mocytes are engaged, PRKD2 phosphorylates HDAC7, leading to
nuclear exclusion of HDAC7 and loss of its gene regulatory functions,
ultimately resulting in apoptosis and negative selection of immature
T cells
24,25. Notably, this negative selection takes place owing to a
loss of HDAC7-mediated repression of Nur77 (regulated by SIK2)
26,
linking three new PSC loci to this pathway.
The associations at the HLA complex at 6p21 were refined
by imputing alleles at HLA-A, HLA-B, HLA-C, HLA-DRB1,
HLA-DQB1, HLA-DQA1 and HLA-DPB1 (Supplementary Note)
27.
The top associated SNP (rs4143332) was in almost perfect LD
(r
2= 0.996) with HLA-B*08:01 (Supplementary Note). In stepwise
conditional analysis including both SNP and HLA allele genotypes,
rs4143332 (tagging HLA-B*08:01) and a complex HLA class II
asso-ciation signal determined by HLA-DQA1*01:03 and SNPs rs532098,
rs1794282 and rs9263964 (Supplementary Fig. 7) explained most
of the HLA association signal in PSC. When performing stepwise
regression of the HLA alleles only, the class II associations were
consistent with previous reports, apart from a new association with
HLA-DQA1*01:01 (Supplementary Tables 8–10 and Supplementary
Note)
9,28,29. The HLA-DRB1*15:01 association overlapped with the
allele for ulcerative colitis (risk increasing) and Crohn’s disease (risk
decreasing)
30,31. Because imputed genotypes in the class II region
were only available for 4 (HLA-DRB1, HLA-DQB1, HLA-DQA1 and
HLA-DPB1) out of 20 loci
32, further studies involving direct
sequenc-ing of all HLA class II loci along with assessments of protein structure
and peptide binding are required to causally resolve the link between
this HLA subregion and PSC development
33,34.
Although 72% of the PSC cases in this study have a diagnosis
of concomitant IBD (Supplementary Table 11), only half of our
genome-wide significant loci were associated with IBD in the recent
International IBD Genetics Consortium (IIBDGC) Immunochip
anal-ysis (Fig. 2a, Supplementary Fig. 8 and
Supplementary Table 3)
22,
despite the greater sample size of that study (25,683 cases and 15,977
controls). Across the 12 non-HLA PSC-associated loci, we observed
greater similarity between the OR estimates for PSC and ulcerative
colitis than for those of PSC and Crohn’s disease. We used the Crohn’s
disease and ulcerative colitis OR estimates for the 163 IBD-associated
1.4
PSC-only risk alleles PSC and IBD risk alleles PSC and
ulcerative colitis risk alleles 1.3
a
b
1.2 1.1 OR 1.0 rs7426056 2q33 CD28 rs56258221 6q15* BACH2 rs4147359 10p15* IL2RA rs7937682 11q23 SIK2 rs3184504 12q24 SH2B3 rs3197999 3p21 MST1 rs13140464 4q27 IL21 rs11168249 12q13 HDAC7 rs1788097 18q22 CD226 rs2836883 21q22 PSMG1 rs3748816 1p36 MMEL1 rs60652743 19q13* PRKD2 0.9 0.8 Crohn's disease Ulcerative colitis PSC 1.0 0.8 0.6 0.4 0.4 0.2 0 0.6False positive rate
0.8 1.0
True positive rate
0.2 0
Crohn's disease 0.559 Ulcerative colitis 0.624
Figure 2 Genetic similarity of loci associated with PSC and IBD. (a) Comparison of ORs for the most associated risk allele in PSC and the same allele
in Crohn’s disease and ulcerative colitis across the 12 genome-wide significant PSC-associated loci. Ulcerative colitis and Crohn’s disease ORs and
the designation of IBD loci as ulcerative colitis, Crohn’s disease or both (IBD) were obtained from Jostins et al.
22. Error bars represent 95% confidence
intervals of the ORs. *, the PSC associated alleles at 6q15 (BACH2), 10p15 (IL2RA) and 19q13 (PRKD2) are independent of the reported IBD
associations (r
2< 0.3) but are located in the same broad genetic region as the IBD-associated SNPs; for this reason, these loci are defined as PSC-IBD
loci in
supplementary Figure 9 but as PSC-only allelic associations here. (b) Predicting PSC using OR estimates across 163 IBD-associated loci.
The green and orange lines represent the ROC curves for discriminating PSC cases from population controls using ulcerative colitis or Crohn’s disease
ORs from 163 loci associated with IBD, respectively
22. The dashed diagonal line is y = x, and specifies the ROC curve of a random predictor.
npg
© 2013 Nature
America, Inc.
loci to predict PSC case-control status in
our sample (Online Methods)
22and found a
significantly greater area under the receiver
operating characteristic (ROC) curve (AUC) when applying
ulcera-tive colitis ORs compared to Crohn’s disease ORs (ulceraulcera-tive colitis
AUC = 0.62, Crohn’s disease AUC = 0.56; P = 1.2 × 10
−57; Fig. 2b).
This suggests that PSC is genetically more similar to ulcerative colitis
than to Crohn’s disease and is consistent with clinical observations of
greater comorbidity of PSC with ulcerative colitis than with Crohn’s
disease
35. To further compare the genetic profiles of PSC and IBD, we
combined our genome-wide significant PSC-associated loci with the
163 confirmed IBD-associated loci
22in a functional similarity network
(Supplementary Fig. 9 and
Supplementary Table 12). We found that
the PSC loci were distributed throughout the IBD loci (Supplementary
Fig. 9), suggesting that there is no particular functional subcluster of
IBD susceptibility genes associated with PSC and vice versa.
Although we consider only those loci reaching a stringent
sig-nificance threshold (P < 5 × 10
−8) to be conclusively associated with
PSC, it is likely that additional true associations lie among SNPs with
weaker associations. An alternative approach for controlling for
mul-tiple hypothesis testing is false discovery rate (FDR) control, which
regulates the expected proportion of incorrectly rejected null
hypo-theses. FDR control is well suited to focused genotyping platforms
such as the Metabochip
36and the Immunochip because it
implic-itly accounts for the expected enrichment in association. To further
increase this enrichment, we exploited the known pleiotropy between
related immune-mediated traits
37and calculated the FDR
38–40for
association with PSC conditional on previously published summary
statistics from each of the related phenotypes (yielding a per-SNP
conditional FDR)
41(Online Methods). We identified 33 non-HLA
loci with conditional FDR < 0.001 in this analysis (Fig. 3), all of which
showed suggestive levels of significance (5 × 10
−8< P < 5 × 10
−5) in
the standard association analysis (Supplementary Figs. 10–12 and
Supplementary Tables 13 and 14). These loci were integrated into
the functional similarity network analysis (Supplementary Fig. 13
and Supplementary Table 15), highlighting potential candidate
susceptibility genes.
In conclusion, the present study increases the number of
genome-wide significant loci in PSC from 7 to 16 (including the HLA
com-plex). The 9 new variants together explain 0.9% of variance in PSC
liability, increasing the total amount of variance explained by the
16 known loci to 7.3% (Online Methods). The data convincingly
show that genetic susceptibility to PSC extends considerably beyond
risk factors involved in the closely related IBD phenotype and into
autoimmune pathophysiology. Furthermore, analysis of pleiotropic
immune-related genetic variants highlights 33 additional suggestive
loci in PSC, overall representing major new avenues for research
into pathogenesis.
URLs. 1000 Genomes HumanOmni2.5M genotype data,
ftp://
ftp.1000genomes.ebi.ac.uk/vol1/ftp/technical/working/20110921_
phase2_omni_genotypes/Omni25_genotypes_1856_samples.
b36.20110921.vcf.gz
; Mangrove,
http://cran.r-project.org/web/
packages/Mangrove/
; DILGOM,
http://www.aka.fi/en-GB/A/
Programmes-and-Cooperation/Research-programmes/Ongoing/
ELVIRA/Projects/DILGOM/
; The Norwegian PSC Research Center,
http://ous-research.no/nopsc/
; PopGen Biobank (in German),
http://
www.popgen.de/
.
METHoDS
Methods and any associated references are available in the
online
version of the paper
.
Note: Supplementary information is available in the
online version of the paper
.
Acknowledgments
We thank all individuals with PSC and healthy controls for their participation,
and we are indebted to all physicians and nursing staff who recruited subjects.
We thank T. Wesse, T. Henke, S. Sedghpour Sabet, R. Vogler, G. Jacobs, I. Urbach,
W. Albrecht, V. Pelkonen, V. Barbu, K. Holm, H. Dahlen Sollid, B. Woldseth,
J.A. Anmarkrud and L.W. Torbjørnsen for expert help. U. Beuers, F. Braun,
W. Kreisel, T. Berg and R. Günther are acknowledged for contributing German
individuals with PSC. B.A. Lie and The Norwegian Bone Marrow Donor Registry
at Oslo University Hospital, Rikshospitalet (Oslo, Norway) and the Nord-Trøndelag
Health Study (HUNT) are acknowledged for sharing healthy Norwegian controls.
Banco Nacional de ADN (Salamanca, Spain) is acknowledged for providing
Spanish control samples. This study makes use of genotyping data generated by the
Dietary, Life style and Genetic determinants of Obesity and Metabolic syndrome
(DILGOM) consortium (see URLs), the Cooperative Research in the Region of
Augsburg (KORA) study and the Heinz Nixdorf Recall (Risk Factors, Evaluation of
Coronary Calcification, and Lifestyle) study. We acknowledge the members of the
International PSC Study Group, the National Institute of Diabetes and Digestive
and Kidney Diseases (NIDDK) Inflammatory Bowel Disease Genetics Consortium
(IBDGC), the UK-PSC Consortium and the Alberta IBD Consortium for their
participation. J. Barrett is acknowledged for contributions to the design of the
Figure 3 Pleiotropic PSC loci. Manhattan plot
of conditional associations in PSC calculated as
stratified FDRs on the basis of the results of the
present PSC analysis and genetic associations
previously reported in seven immune-mediated
diseases (Crohn’s disease, celiac disease,
psoriasis, rheumatoid arthritis, sarcoidosis,
type 1 diabetes and ulcerative colitis)
(Online Methods and
supplementary Figs. 10–12).
SNPs in red represent genome-wide significant
findings from the main association analysis
(
table 1), and SNPs in black are significantly
associated with PSC conditional on their
pleiotropic effects across the related
immune-mediated diseases. The horizontal red
line represents a threshold of FDR < 0.001
(
supplementary table 13), and the blue
horizontal line represents a threshold of FDR
< 0.01 (see
supplementary table 14 for a full
listing of identified loci).
1p36.32 1q23.3 2p16.1 2q33.2 2q35 2q36.3 3p21.31 3p14.1 3q13.33 3q29 4q25 4q27 6p25.3 6p25.3 6p22.1 6q21 8q24.21 8q24.21 8q24.21 9q32 10p15.1 10q23.33 10q24.2 11p15.5 11q13.1 11q23.1 11q23.3 12q13.11 12q23.3 12q24.12 13q31.1 14q32.33 16p13.13 16p12.1 16q22.1 17q12 18p11.21 18q22.2 19q13.11 19q13.32 19q13.33 20q13.2 21q22.2 21q22.3 21q22.3 rs2838519 rs11203203 rs2836878 rs715147 rs601338 rs425105 rs17694108 rs1788097 rs2847297 rs4795397 rs12149608 rs7404095 rs415595 rs4983425 rs7324586 rs3184504 rs12369214 rs11168249 rs633683 rs7937682 rs694739 rs11246286 rs10883371 rs7923837 rs4147359 rs6477901 rs2977035 rs13255292 rs10956390 rs535780 rs13195040 rs12210050 rs9378805 rs13140464 rs898518 rs7636495 rs4482697 rs9819066 rs3197999 rs7556897 rs11676348 rs7426056 rs12479056 rs4474277 rs3748816 –log 10 (FDR) 0 2 4 6 8 10 1 2 3 4 5 6 7 Chromosome8 9 10 11 12 13 14 15 16 17 18 19 202122
npg
© 2013 Nature
America, Inc.
Immunochip experiment. Individuals who have shared summary statistics and
statistical software are acknowledged in the Supplementary Note.
The study was supported by The Norwegian PSC Research Center (see URLs),
by the German Ministry of Education and Research through the National Genome
Research Network (01GS0809-GP7), by the Deutsche Forschungsgemeinschaft
(FR 2821/2-1), by the EU Seventh Framework Programme FP7/2007-2013
(262055) ESGI, by the Integrated Research and Treatment Center–Transplantation
(01EO0802) and by the PopGen Biobank (see URLs). J.Z.L., T.S. and C.A.A. are
supported by a grant from the Wellcome Trust (098051). Additional financial
support of the study and the coauthors is listed in the Supplementary Note.
AUtHoR contRIBUtIons
J.Z.L., J.R.H., T.F., E.E., N.T.D., I.T., G.M., I.R.K., O.A.A., W.K.T., A.M.D., T.S.
and C.A.A. performed data and statistical analyses. A. Franke, C.A.A. and T.H.K.
coordinated the project and supervised the data analysis. J.Z.L., J.R.H., T.F., E.E.,
A. Franke, C.A.A. and T.H.K. drafted the manuscript. S.M.R., R.K.W., T.J.W., B.E.,
P.I., G.M.H., D.N.G., A.P., D.E., B.D.J., P.M., C.R., C.S., T.M., B.S., G.D., M.M.N.,
S.H., J.W., M.M., F.B., C.Y.P., P.J.P.C., M. Sterneck, A.T., A.L.M., J.S., V.L., R.D., D.A.,
A. Floreani, S.O.-G., S.S.R., A.J.S., S.N., K.H., I.C., J.G.-A., I.R.-P., D.v.H., E.B.,
R.N.S., P.R.D., E.M., M.H.V., M.S.S., R.H.D., L.P., S.B., M. Sans, V.A., J.-P.A., K.M.B.,
H.-U.M., O.C., C.L.B., C.W., E.S., S.V., M.A., J.D.R., G.A., A.B., J.C., S.S., M.P.M.,
M.F., R.W.C., K.N.L., The UK-PSC Consortium, The International IBD Consortium
and The International PSC Study Group contributed to the ascertainment of affected
individuals and/or sample and clinical data collection. All authors revised the
manuscript for critical content and approved the final version.
comPetIng FInAncIAl InteRests
The authors declare no competing financial interests.
Reprints and permissions information is available online at http://www.nature.com/ reprints/index.html.
1. Aadland, E. et al. Primary sclerosing cholangitis: a long-term follow-up study. Scand.
J. Gastroenterol. 22, 655–664 (1987).
2. Broomé, U. et al. Natural history and prognostic factors in 305 Swedish patients with primary sclerosing cholangitis. Gut 38, 610–615 (1996).
3. Farrant, J.M. et al. Natural history and prognostic variables in primary sclerosing cholangitis. Gastroenterology 100, 1710–1717 (1991).
4. Cortes, A. & Brown, M.A. Promise and pitfalls of the Immunochip. Arthritis Res.
Ther. 13, 101 (2011).
5. Karlsen, T.H., Schrumpf, E. & Boberg, K.M. Update on primary sclerosing cholangitis.
Dig. Liver Dis. 42, 390–400 (2010).
6. Karlsen, T.H. & Kaser, A. Deciphering the genetic predisposition to primary sclerosing cholangitis. Semin. Liver Dis. 31, 188–207 (2011).
7. Saarinen, S., Olerup, O. & Broome, U. Increased frequency of autoimmune diseases in patients with primary sclerosing cholangitis. Am. J. Gastroenterol. 95, 3195–3199 (2000).
8. Bergquist, A. et al. Increased risk of primary sclerosing cholangitis and ulcerative colitis in first-degree relatives of patients with primary sclerosing cholangitis. Clin.
Gastroenterol. Hepatol. 6, 939–943 (2008).
9. Karlsen, T.H. et al. Genome-wide association analysis in primary sclerosing cholangitis. Gastroenterology 138, 1102–1111 (2010).
10. Srivastava, B. et al. Fine mapping and replication of genetic risk loci in primary sclerosing cholangitis. Scand. J. Gastroenterol. 47, 820–826 (2012).
11. Folseraas, T. et al. Extended analysis of a genome-wide association study in primary sclerosing cholangitis detects multiple novel risk loci. J. Hepatol. 57, 366–375 (2012).
12. Melum, E. et al. Genome-wide association analysis in primary sclerosing cholangitis identifies two non-HLA susceptibility loci. Nat. Genet. 43, 17–19 (2011). 13. Ellinghaus, D. et al. Genome-wide association analysis in sclerosing cholangitis and
ulcerative colitis identifies risk loci at GPR35 and TCF4. Hepatology published online; doi:10.1002/hep.25977 (23 July 2012).
14. Trynka, G. et al. Dense genotyping identifies and localizes multiple common and rare variant association signals in celiac disease. Nat. Genet. 43, 1193–1201 (2011).
15. Pirinen, M., Donnelly, P. & Spencer, C. Efficient computation with a linear mixed model on large-scale data sets with applications to genetic studies. Ann. Appl.
Stat. 7, 369–390 (2013).
16. Cordell, H.J. & Clayton, D.G. A unified stepwise regression procedure for evaluating the relative effects of polymorphisms within a gene using case/control or family data: application to HLA in type 1 diabetes. Am. J. Hum. Genet. 70, 124–141 (2002). 17. Peters, U. et al. Meta-analysis of new genome-wide association studies of colorectal
cancer risk. Hum. Genet. 131, 217–234 (2012).
18. Gerstein, M.B. et al. Architecture of the human regulatory network derived from ENCODE data. Nature 489, 91–100 (2012).
19. Rossin, E.J. et al. Proteins encoded in genomic regions associated with immune-mediated disease physically interact and suggest underlying biology. PLoS Genet. 7, e1001273 (2011).
20. Raychaudhuri, S. et al. Identifying relationships among genomic disease regions: predicting genes at pathogenic SNP associations and rare deletions. PLoS Genet. 5, e1000534 (2009).
21. Hanna, R.N. et al. The transcription factor NR4A1 (Nur77) controls bone marrow differentiation and the survival of Ly6C– monocytes. Nat. Immunol. 12, 778–785 (2011).
22. Jostins, L. et al. Host-microbe interactions have shaped the genetic architecture of inflammatory bowel disease. Nature 491, 119–124 (2012).
23. Kasler, H.G. et al. Histone deacetylase 7 regulates cell survival and TCR signaling in CD4/CD8 double-positive thymocytes. J. Immunol. 186, 4782–4793 (2011). 24. Dequiedt, F. et al. HDAC7, a thymus-specific class II histone deacetylase, regulates
Nur77 transcription and TCR-mediated apoptosis. Immunity 18, 687–698 (2003). 25. Dequiedt, F. et al. Phosphorylation of histone deacetylase 7 by protein kinase D
mediates T cell receptor–induced Nur77 expression and apoptosis. J. Exp. Med.
201, 793–804 (2005).
26. Clark, K. et al. Phosphorylation of CRTC3 by the salt-inducible kinases controls the interconversion of classically activated and regulatory macrophages. Proc. Natl.
Acad. Sci. USA 109, 16986–16991 (2012).
27. Raychaudhuri, S. et al. Five amino acids in three HLA proteins explain most of the association between MHC and seropositive rheumatoid arthritis. Nat. Genet. 44, 291–296 (2012).
28. Schrumpf, E. et al. HLA antigens and immunoregulatory T cells in ulcerative colitis associated with hepatobiliary disease. Scand. J. Gastroenterol. 17, 187–191 (1982).
29. Spurkland, A. et al. HLA class II haplotypes in primary sclerosing cholangitis patients from five European populations. Tissue Antigens 53, 459–469 (1999). 30. Stokkers, P.C., Reitsma, P.H., Tytgat, G.N. & van Deventer, S.J. HLA-DR and -DQ
phenotypes in inflammatory bowel disease: a meta-analysis. Gut 45, 395–401 (1999).
31. Okada, Y. et al. HLA-Cw*1202-B*5201-DRB1*1502 haplotype increases risk for ulcerative colitis but reduces risk for Crohn’s disease. Gastroenterology 141, 864–871. e1–5 (2011).
32. Horton, R. et al. Gene map of the extended human MHC. Nat. Rev. Genet. 5, 889–899 (2004).
33. Hov, J.R. et al. Electrostatic modifications of the human leukocyte antigen–DR P9 peptide–binding pocket and susceptibility to primary sclerosing cholangitis.
Hepatology 53, 1967–1976 (2011).
34. Hovhannisyan, Z. et al. The role of HLA-DQ8 β57 polymorphism in the anti-gluten T-cell response in coeliac disease. Nature 456, 534–538 (2008).
35. Broomé, U. & Bergquist, A. Primary sclerosing cholangitis, inflammatory bowel disease, and colon cancer. Semin. Liver Dis. 26, 31–41 (2006).
36. CARDIoGRAMplusC4D Consortium. Large-scale association analysis identifies new risk loci for coronary artery disease. Nat. Genet. 45, 25–33 (2013).
37. Zhernakova, A., van Diemen, C.C. & Wijmenga, C. Detecting shared pathogenesis from the shared genetics of immune-related diseases. Nat. Rev. Genet. 10, 43–55 (2009).
38. Benjamini, Y. & Hochberg, Y. Controlling the false discovery rate: a practical and powerful approach to multiple testing. J. R. Stat. Soc. B 57, 289–300 (1995). 39. Storey, J.D. The positive false discovery rate: a Bayesian interpretation and the
q-value. Ann. Stat. 31, 2013–2035 (2003).
40. Efron, B. Simultaneous inference: when should hypothesis testing problems be combined? Ann. Appl. Statist. 2, 197–223 (2008).
41. Sun, L., Craiu, R.V., Paterson, A.D. & Bull, S.B. Stratified false discovery control for large-scale hypothesis testing with application to genome-wide association studies. Genet. Epidemiol. 30, 519–530 (2006).
Jimmy Z liu
1,86
, Johannes Roksund Hov
2–5,86
, trine Folseraas
2–4,86
, eva ellinghaus
6,86
, simon m Rushbrook
7
,
nadezhda t doncheva
8
, ole A Andreassen
4,9
, Rinse k weersma
10
, tobias J weismüller
11,12,85
, Bertus eksteen
13
,
Pietro Invernizzi
14
, gideon m Hirschfield
15,16
, daniel nils gotthardt
17
, Albert Pares
18
, david ellinghaus
6
,
tejas shah
1
, Brian d Juran
19
, Piotr milkiewicz
20
, christian Rust
21
, christoph schramm
22
, tobias müller
23
,
Brijesh srivastava
24
, georgios dalekos
25,26
, markus m nöthen
27,28
, stefan Herms
27,28
, Juliane winkelmann
29–31
,
mitja mitrovic
32
, Felix Braun
33
, cyriel Y Ponsioen
34
, Peter J P croucher
35
, martina sterneck
36
,
Andreas teufel
37
, Andrew l mason
38
, Janna saarela
39
, Virpi leppa
40
, Ruslan dorfman
41
, domenico Alvaro
42
,
Annarosa Floreani
43
, suna onengut-gumuscu
44,45
, stephen s Rich
46,47
, wesley k thompson
48
,
npg
© 2013 Nature
America, Inc.
Andrew J schork
49
, sigrid næss
2–4
, Ingo thomsen
6
, gabriele mayr
8
, Inke R könig
50
, kristian Hveem
51
,
Isabelle cleynen
1,52
, Javier gutierrez-Achury
32
, Isis Ricaño-Ponce
32
, david van Heel
53
, einar Björnsson
54
,
Richard n sandford
24
, Peter R durie
55
, espen melum
2–4
, morten H Vatn
4,5,56
, mark s silverberg
57
,
Richard H duerr
58,59
, leonid Padyukov
60
, stephan Brand
61
, miquel sans
62
, Vito Annese
63,64
,
Jean-Paul Achkar
65,66
, kirsten muri Boberg
2,4,5
, Hanns-Ulrich marschall
67
, olivier chazouillères
68
,
christopher l Bowlus
69
, cisca wijmenga
32
, erik schrumpf
2,4,5
, severine Vermeire
52,70
, mario Albrecht
8,71
,
the Uk-Psc consortium
72
, the International IBd genetics consortium
72
, John d Rioux
73,74
,
graeme Alexander
75
, Annika Bergquist
76
, Judy cho
77
, stefan schreiber
6,78,79
, michael P manns
11,12
,
martti Färkkilä
80
, Anders m dale
81,82
, Roger w chapman
83
, konstantinos n lazaridis
19
, the International Psc
study group
72
, Andre Franke
6,87
, carl A Anderson
1,87
& tom H karlsen
2,3,5,84,87
1Wellcome Trust Sanger Institute, Wellcome Trust Genome Campus, Hinxton, Cambridge, UK. 2Norwegian PSC Research Center, Department of Transplantation
Medicine, Division of Cancer Medicine, Surgery and Transplantation, Oslo University Hospital, Rikshospitalet, Oslo, Norway. 3K.G. Jebsen Inflammation Research
Centre, Research Institute of Internal Medicine, Oslo University Hospital, Rikshospitalet, Oslo, Norway. 4Institute of Clinical Medicine, University of Oslo, Oslo,
Norway. 5Section of Gastroenterology, Department of Transplantation Medicine, Division of Cancer Medicine, Surgery and Transplantation, Oslo University Hospital,
Rikshospitalet, Oslo, Norway. 6Institute of Clinical Molecular Biology, Christian-Albrechts-University of Kiel, Kiel, Germany. 7Department of Gastroenterology and
Hepatology, Norfolk and Norwich, University Hospitals National Health Service (NHS) Trust, Norwich, UK. 8Max Planck Institute for Informatics, Saarbrücken, Germany. 9K.G. Jebsen Centre for Psychosis Research, Division of Mental Health and Addiction, Oslo University Hospital, Ulleval, Oslo, Norway. 10Department of Gastroenterology
and Hepatology, University of Groningen and University Medical Centre Groningen, Groningen, The Netherlands. 11Department of Gastroenterology, Hepatology and
Endocrinology, Hannover Medical School, Hannover, Germany. 12Integrated Research and Treatment Center–Transplantation (IFB-tx), Hannover Medical School,
Hannover, Germany. 13Snyder Institute of Chronic Diseases, Department of Medicine, University of Calgary, Calgary, Alberta, Canada. 14Center for Autoimmune Liver
Diseases, Humanitas Clinical and Research Center, Rozzano, Italy. 15Division of Gastroenterology, Department of Medicine, University of Toronto, Toronto, Ontario,
Canada. 16Centre for Liver Research, National Institute for Health Research (NIHR) Biomedical Research Unit, Birmingham, UK. 17Department of Medicine, University
Hospital of Heidelberg, Heidelberg, Germany. 18Liver Unit, Hospital Clínic, Institut d’Investigacions Biomèdiques August Pi i Sunyer (IDIBAPS), Centro de Investigación
Biomédica en Red en el Área Temática de Enfermedades Hepáticas y Digestivas (CIBERehd), University of Barcelona, Barcelona, Spain. 19Center for Basic Research in
Digestive Diseases, Division of Gastroenterology and Hepatology, Mayo Clinic, College of Medicine, Rochester, Minnesota, USA. 20Liver Unit and Liver Research
Laboratories, Pomeranian Medical University, Szczecin, Poland. 21Department of Medicine 2, Grosshadern, University of Munich, Munich, Germany. 221st Department
of Medicine, University Medical Center Hamburg-Eppendorf, Hamburg, Germany. 23Department of Internal Medicine, Hepatology and Gastroenterology, Charité
Universitätsmedizin Berlin, Berlin, Germany. 24Academic Department of Medical Genetics, University of Cambridge, Cambridge, UK. 25Department of Medicine,
Medical School, University of Thessaly, Larissa, Greece. 26Research Laboratory of Internal Medicine, Medical School, University of Thessaly, Larissa, Greece. 27Institute
of Human Genetics, University of Bonn, Bonn, Germany. 28Department of Genomics, Life & Brain Center, University of Bonn, Bonn, Germany. 29Institute of Human
Genetics, Technische Universität München, Munich, Germany. 30Department of Neurology, Technische Universität München, Munich, Germany. 31Institute of Human
Genetics, Helmholtz Zentrum München–German Research Center for Environmental Health, Neuherberg, Germany. 32Department of Genetics, University of Groningen
and University Medical Centre Groningen, Groningen, The Netherlands. 33Department of General, Visceral, Thoracic, Transplantation and Pediatric Surgery, University
Medical Centre Schleswig-Holstein, Campus Kiel, Kiel, Germany. 34Department of Gastroenterology and Hepatology, Academic Medical Center, Amsterdam,
The Netherlands. 35Department of Environmental Science, Policy, and Management, University of California, Berkeley, Berkeley, California, USA. 36Department of
Hepatobiliary Surgery and Transplantation, University Medical Center Hamburg-Eppendorf, Hamburg, Germany. 371st Department of Medicine, University of Mainz,
Mainz, Germany. 38Division of Gastroenterology and Hepatology, University of Alberta, Edmonton, Alberta, Canada. 39Institute for Molecular Medicine Finland (FIMM),
University of Helsinki, Helsinki, Finland. 40Public Health Genomics Unit, FIMM, University of Helsinki and National Institute for Health and Welfare, Helsinki, Finland. 41Program in Genetics and Genome Biology, Hospital for Sick Children, Toronto, Ontario, Canada. 42Division of Gastroenterology, Department of Clinical Medicine,
Sapienza University of Rome, Rome, Italy. 43Department of Surgical, Oncological and Gastroenterological Sciences, University of Padova, Padova, Italy. 44Center for
Public Health Genomics, Division of Endocrinology & Metabolism, University of Virginia, Charlottesville, Virginia, USA. 45Department of Internal Medicine, Division of
Endocrinology & Metabolism, University of Virginia, Charlottesville, Virginia, USA. 46Center for Public Health Genomics, University of Virginia, Charlottesville, Virginia,
USA. 47Department of Public Health Sciences, University of Virginia, Charlottesville, Virginia, USA. 48Department of Psychiatry, University of California, San Diego,
La Jolla, California, USA. 49Graduate Program in Cognitive Science, University of California, San Diego, La Jolla, California, USA. 50Institute of Medical Biometry and
Statistics, University of Lübeck, Lübeck, Germany. 51Department of Public Health, Faculty of Medicine, Norwegian University of Science and Technology, Trondheim,
Norway. 52Department of Clinical and Experimental Medicine, KU Leuven, Leuven, Belgium. 53Blizard Institute, Barts and The London School of Medicine and
Dentistry, Queen Mary University of London, London, UK. 54Division of Gastroenterology and Hepatology, Department of Internal Medicine, Landspitali University
Hospital, Reykjavik, Iceland. 55Physiology and Experimental Medicine, Research Institute, Hospital for Sick Children, Toronto, Ontario, Canada. 56EpiGen, Campus
Akershus University Hospital (AHUS), Akershus University Hospital, Nordbyhagen, Norway. 57Inflammatory Bowel Disease (IBD) Group, Zane Cohen Centre for Digestive
Diseases, Mount Sinai Hospital, Toronto, Ontario, Canada. 58Division of Gastroenterology, Hepatology, and Nutrition, Department of Medicine, University of Pittsburgh
School of Medicine, Pittsburgh, Pennsylvania, USA. 59Department of Human Genetics, Graduate School of Public Health, University of Pittsburgh, Pittsburgh,
Pennsylvania, USA. 60Rheumatology Unit, Department of Medicine, Karolinska Institutet and Karolinska University Hospital Solna, Stockholm, Sweden. 61Department
of Medicine II, University Hospital Munich-Grosshadern, Ludwig-Maximilians-University Munich, Germany. 62Department of Digestive Diseases, Centro Médico Teknon,
Barcelona, Spain. 63Division of Gastroenterology, Istituto di Ricovero e Cura a Carattere Scientifico, Casa Sollievodella Sofferenza Hospital, San Giovanni Rotondo, Italy. 64Unit of Gastroenterology SOD2, Azienda Ospedaliero Universitaria Careggi, Florence, Italy. 65Department of Gastroenterology and Hepatology, Digestive Disease
Institute, Cleveland Clinic, Cleveland, Ohio, USA. 66Department of Pathobiology, Lerner Research Institute, Cleveland Clinic, Cleveland, Ohio, USA. 67Department of
Internal Medicine, Institute of Medicine, Sahlgrenska Academy and University Hospital, Gothenburg, Sweden. 68Assistance Publique–Hôpitaux de Paris (AP-HP),
Hôpital Saint Antoine, Department of Hepatology, University Pierre et Marie Curie (UPMC) Université de Paris 6, Paris, France. 69Division of Gastroenterology and
Hepatology, University of California, Davis, Davis, California, USA. 70Department of Gastroenterology, University Hospitals Leuven, Leuven, Belgium. 71Department of
Bioinformatics, Institute of Biometrics and Medical Informatics, University Medicine Greifswald, Greifswald, Germany. 72Further details appear in the supplementary Note. 73Université de Montréal, Research Center, Montreal, Quebec, Canada. 74Montreal Heart Institute, Research Center, Montreal, Quebec, Canada. 75Division of
Hepatology, Department of Medicine, University of Cambridge, Cambridge, UK. 76Department of Gastroenterology and Hepatology, Karolinska University Hospital
Huddinge, Karolinska Institutet, Stockholm, Sweden. 77Section of Digestive Diseases, Department of Medicine, Yale University, New Haven, Connecticut, USA. 78Department for General Internal Medicine, Christian-Albrechts-University of Kiel, Kiel, Germany. 79PopGen Biobank, University Hospital Schleswig-Holstein,
Christian-Albrechts-University of Kiel, Kiel, Germany. 80Division of Gastroenterology, Department of Medicine, Helsinki University Hospital, Helsinki, Finland. 81Department of Radiology, University of California, San Diego, La Jolla, California, USA. 82Department of Neurosciences, University of California, San Diego, La Jolla,
California, USA. 83Department of Hepatology, John Radcliffe University Hospitals NHS Trust, Oxford, UK. 84Division of Gastroenterology, Department of Clinical
Medicine, University of Bergen, Bergen, Norway. 85Present address: Department of Internal Medicine 1, University Hospital of Bonn, Bonn, Germany. 86These authors
contributed equally to this work. 87These authors jointly directed this work. Correspondence should be addressed to T.H.K. (t.h.karlsen@medisin.uio.no) or
C.A.A. (carl.anderson@sanger.ac.uk).
npg
© 2013 Nature
America, Inc.
Table 16 and the Supplementary Note.
Ethical approval. Subject recruitment was approved by the ethics committees
or institutional review boards of all participating centers. Written informed
consent was obtained from all participants.
Quality control. SNPs with call rate < 80% were removed before
commenc-ing sample quality control (n = 235). Per-individual genotype call rate and
heterozygosity rate were calculated using PLINK
42, and outlying samples
were identified using Aberrant
43, which automatically identifies outliers in
otherwise Gaussian distributions (Supplementary Fig. 1). A set of 20,837
LD-pruned (r
2< 0.1) SNPs with MAF > 10% present on both the Immunochip
and the Illumina HumanOmni2.5-8 array used in the 1000 Genomes Project
(see URLs) were used to estimate identity by descent and ancestry. For each
pair of individuals with estimated identity by descent ≥0.9, the sample with
the lower call rate was removed (unless case-control status was discordant
between the pair, in which case, both samples were removed, n = 92). Related
individuals (0.1875 < identity by descent <0.9) remained in the analysis to
maximize power because mixed model association analysis can correctly
account for relatedness. Principal-components analysis, implemented in
SMARTPCA (Eigenstrat)
44, was used to identify samples of non-European
ancestry. Principal components were defined using population samples from
the 1000 Genomes Project
45genotyped using the Illumina
HumanOmni2.5-8 genotyping array (see URLs) and then projected into cases and controls
(Supplementary Fig. 2)
14,22,46. After sample quality control, 3,789 PSC cases
and 25,079 controls remained. SNPs with MAF of less than 0.1%,
Hardy-Weinberg equilibrium P <1 × 10
−5or call rate lower than 98% and those that
failed the PLINK v1.07 non-random differential missing data rate test between
cases and controls (P < 1 × 10
−5) were excluded. After the completion of
marker quality control (Supplementary Table 2), 131,220 SNPs were available
for analysis, further reduced to 130,422 after cluster plot inspection.
Statistical methods. Genomic inflation factor. The Immunochip contains 3,120
SNPs that were part of a bipolar disease replication effort and other studies
that were not immune related. After quality control, 2,544 of these were used
as null markers to estimate the overall inflation of the distribution of
associa-tion test statistics.
Imputation. Using 85,747 SNPs after quality control located in the Immunochip
fine-mapping regions, additional genotypes were imputed using IMPUTE2
with the 1000 Genomes Project Phase 1 (March 2012) reference panel of
1,092 individuals
47and 744,740 SNPs. Imputation was performed separately
in ten batches, with the case:control and country of origin ratios constant
across batches. SNPs with a posterior probability less than 0.9 and those with
differential missingness (P < 1 × 10
−5) in the ten batches were removed, as
were SNPs that did not pass the exclusion thresholds used for genotyped SNP
quality control. After imputation, a total of 163,379 SNPs in the Immunochip
fine-mapping regions, including 153,857 SNPs from the reference panel, were
available for analysis.
Association analysis. Case-control association tests were performed using a
linear mixed model as implemented in MMM
15. A covariance matrix, R, of a
random-effects component was included in the model to explicitly account for
confounding due to population stratification and cryptic relatedness between
individuals. This method has been shown to better control for population
stratification than correction for principal components or meta-analyses of
matched subgroups of cases and controls
48–50. R is a symmetric n × n matrix
with each entry representing the relative sharing of alleles between two
indi-viduals compared to the average in the sample, and it is typically estimated
using genome-wide SNP data
15. To avoid biases in the estimation of R due to
the design of the Immunochip, SNPs were first pruned for LD (r
2< 0.1). Of
the remaining SNPs, we then removed those that were in the HLA region or
had MAF <10%. Finally, we excluded SNPs that showed modest association
(P < 0.005) with PSC in a linear regression model fitting the first ten principal
components as covariates. A total of 17,260 SNPs were used to estimate R.
non-UK (n = 19,172) samples and then combined the results using a
fixed-effects (inverse variance–weighted) meta-analysis, as carried out previously
48.
This reduced the λ
GCinflation factor, estimated using the 2,544 null SNPS,
from 1.24 to 1.02 (Supplementary Fig. 14), showing excellent control for
population stratification. Stepwise conditional regression was used to identify
possible independent associations at genome-wide significant loci. SNP × SNP
interactions between all pairs of genome-wide significant SNPs were tested
using the PLINK-epistasis command. Signal intensity plots of all non-HLA
loci with association P value <5 × 10
−6were visually inspected using Evoker
51.
SNPs that clustered poorly were removed (n = 798).
Prediction of PSC using IBD SNPs. OR estimates for Crohn’s disease and
ulcera-tive colitis in 163 IBD-associated SNPs were obtained from Jostins et al.
22. We
used the R package Mangrove (see URLs) to estimate each individual’s
prob-ability of developing PSC in our 3,789 PSC cases and 25,079 controls, assuming
additive risk (log-additive OR). The performance of our predictor using either
Crohn’s disease or ulcerative colitis ORs was assessed by constructing a ROC
curve, showing the proportion of true and false positives at each probability
threshold. The AUC was calculated to compare the predictive powers of the
ulcerative colitis and Crohn’s disease ORs. The DeLong method was used to
test whether the AUC was significantly greater using ulcerative colitis ORs
compared to Crohn’s disease ORs
52.
Functional similarity networks. In functional similarity networks, each edge
represents the strong functional similarity of two genes based on annotated
Gene Ontology (GO) terms as determined by the functional similarity measure
rfunSim
53. rfunSim similarity values above the recommended cutoff of 0.8
were retrieved using the FunSimMat web service
54. Resulting networks were
visualized and analyzed using Cytoscape
55.
To construct PSC-specific networks from functional similarity networks
that contained more than one gene per locus (Supplementary Figs. 5 and 13),
the connectivity of each gene was assessed by computing different topology
measures for the corresponding node: (i) degree (number of direct edges to
other nodes), (ii) shortest path closeness (inverted average shortest path
dis-tance to other nodes) and (iii) shortest path betweeness (fraction of shortest
paths passing through the node). Similarity edges between genes in the same
locus and gene nodes that were not contained in the resulting largest connected
subnetworks were ignored. Genes were first ranked according to each measure
and were then assigned the best of the three ranks. The PSC-specific network
was generated from the top ranked genes in their respective loci.
Pleiotropy analysis. We included summary statistics from GWAS of seven
PSC-associated diseases (Crohn’s disease, celiac disease, psoriasis, rheumatoid
arthritis, sarcoidosis, type 1 diabetes and ulcerative colitis; Supplementary
Table 17). For all diseases, we constructed conditional stratified
quantile-quantile plots of the empirical quantile-quantiles of nominal −log
10(P values) for SNP
association with PSC for all SNPs (Supplementary Fig. 10) and for different
overlapping subsets of SNPs determined by the significance of their association
with the PSC-associated autoimmune disorder (SNP subsets defined by P <1,
P <0.1, P <0.01 and P <0.001 in the pleiotropic phenotype). For a given
PSC-associated phenotype, enrichment for pleiotropic signals in PSC can be
observed as an increasing leftward deflection from the expected null
distribu-tion with lower P-value thresholds in the second phenotype (Supplementary
Note). Enrichment in the stratified quantile-quantile plots is directly
inter-pretable in terms of the true discovery rate (TDR), equivalent to 1–FDR
56.
Specifically, it can be shown that a conservative estimate of FDR can be
calculated from the horizontal shift of the quantile-quantile curve from the
expected line y = x, with a larger shift corresponding to a smaller FDR for a
given nominal P value (Supplementary Note). We calculated the conditional
TDR as a function of P value in PSC across a series of P-value thresholds in
the pleiotropic trait (Supplementary Fig. 10).
To assess the significance of the association with PSC, we assigned a
pleio-tropic (conditional) FDR value for PSC for each SNP. The pleiopleio-tropic FDR
value for each SNP was based on the P value of the SNP in PSC relative to the
P-value distribution of other SNPs in the same conditioning subset, where
npg
© 2013 Nature
America, Inc.
blind to the P value of the SNP with respect to PSC. The pleiotropic FDR
was then interpolated from conditional FDR curves using established
strati-fied FDR methods
41,57(Supplementary Note). The increase in power from
using pleiotropic FDR is demonstrated by dividing the total sample in half and
observing that empirical replication rates between the training and test halves
increase with decreasing P value in the pleiotropic disease (Supplementary
Fig. 15). The SNP with the lowest FDR within each LD block (as defined by
1000 Genomes Project data) was considered the lead SNP of a new pleiotropic
PSC locus, if below a threshold of 0.001 (loci defined by FDR < 0.001 and FDR
< 0.01 are shown in Supplementary Tables 13 and 14). All test statistics were
adjusted for population stratification by genomic control (Supplementary
Fig. 16 and Supplementary Note).
Variance explained and heritability. The proportion of variance explained
by the genome-wide significant loci and HLA alleles was calculated using
a liability threshold model
58assuming a disease prevalence of 10 in 100,000
and multiplicative risk.
biliary cirrhosis. Nat. Genet. 44, 1137–1141 (2012).
47. Howie, B.N., Donnelly, P. & Marchini, J. A flexible and accurate genotype imputation method for the next generation of genome-wide association studies. PLoS Genet. 5, e1000529 (2009).
48. Sawcer, S. et al. Genetic risk and a primary role for cell-mediated immune mechanisms in multiple sclerosis. Nature 476, 214–219 (2011).
49. Korte, A. et al. A mixed-model approach for genome-wide association studies of correlated traits in structured populations. Nat. Genet. 44, 1066–1071 (2012). 50. Tsoi, L.C. et al. Identification of 15 new psoriasis susceptibility loci highlights the
role of innate immunity. Nat. Genet. 44, 1341–1348 (2012).
51. Morris, J.A., Randall, J.C., Maller, J.B. & Barrett, J.C. Evoker: a visualization tool for genotype intensity data. Bioinformatics 26, 1786–1787 (2010).
52. DeLong, E.R., DeLong, D.M. & Clarke-Pearson, D.L. Comparing the areas under two or more correlated receiver operating characteristic curves: a nonparametric approach. Biometrics 44, 837–845 (1988).
53. Schlicker, A., Domingues, F.S., Rahnenfuhrer, J. & Lengauer, T. A new measure for functional similarity of gene products based on Gene Ontology. BMC Bioinformatics
7, 302 (2006).
54. Schlicker, A. & Albrecht, M. FunSimMat update: new features for exploring functional similarity. Nucleic Acids Res. 38, D244–D248 (2010).
55. Shannon, P. et al. Cytoscape: a software environment for integrated models of biomolecular interaction networks. Genome Res. 13, 2498–2504 (2003). 56. Efron, B. Size, power and false discovery rates. Ann. Stat. 35, 1351–1377 (2007). 57. Yoo, Y.J., Pinnaduwage, D., Waggott, D., Bull, S.B. & Sun, L. Genome-wide
association analyses of North American Rheumatoid Arthritis Consortium and Framingham Heart Study data utilizing genome-wide linkage results. BMC Proc. 3 (suppl. 7), S103 (2009).
58. So, H.C., Gui, A.H., Cherny, S.S. & Sham, P.C. Evaluating the heritability explained by known susceptibility variants: a survey of ten complex diseases. Genet. Epidemiol.
35, 310–317 (2011).
42. Purcell, S. et al. PLINK: a tool set for whole-genome association and population-based linkage analyses. Am. J. Hum. Genet. 81, 559–575 (2007).
43. Bellenguez, C., Strange, A., Freeman, C., Donnelly, P. & Spencer, C.C. A robust clustering algorithm for identifying problematic samples in genome-wide association studies. Bioinformatics 28, 134–135 (2012).
44. Patterson, N., Price, A.L. & Reich, D. Population structure and eigenanalysis. PLoS
Genet. 2, e190 (2006).