THE
INFLUENCE
OF
ENVIRONMENTAL
HYPOXIA
IN
THE
PHYSIOLOGICAL
RESPONSES
OF
LABORATORY
RATS
AND
MICE
DURING
POSTNATAL
LIFE
AND
ADULTHOOD
Thèse
Alexandra Lemoine
Doctorat en Médecine expérimentale Philosophiae Doctor (Ph.D.)
RÉSUMÉ
Il existe chez les différentes espèces de rongeurs une importante variabilité dans les capacités à établir des colonies stables en haute altitude (HA). Par exemple, on trouve des souris (Mus) jusqu'à 4000m alors qu’il n’y a pas de rats (Rattus).
La capacité des animaux à survivre et réaliser des activités physiques en HA dépend d’adaptations biologiques physiologiques (plasticité phénotypique) et génétiques ou épigénétiques. Des rats Sprague Dawley (SD) maintenus en HA dans des conditions de laboratoire survivent pendant plusieurs générations (La Paz, Bolivia – 3600m) mais présentent des signes de maladaptations physiologiques (érythrocytose excessive, hypertrophie ventriculaire droite – signe d’hypertension artérielle pulmonaire – et altération des structures alvéolaires avec élargissements des espaces pulmonaires). Ces réponses sont principalement liées à une hypersensibilité au niveau d’oxygène (O2) ambient au cours de la période postnatale et élever les rats de HA à une pression d’O2 reproduisant celle du niveau de la mer (NM) au cours de cette période améliore significativement leur adaptation physiologique1,2. Actuellement, aucune adaptation génétique n’a été mise en évidence chez des souris (Mus musculus) sauvages capturées en HA. Notre hypothèse générale est que les souris possèdent des caractéristiques physiologiques spécifiques qui assurent leur survie en HA.
Pour répondre à cette hypothèse, nous avons réalisé 4 études comparant les réponses physiologiques (ventilation, métabolisme, hématologie, saturation artérielle en O2 et rythme cardiaque) entre des souris FVB et des rats SD élevés au NM (Québec, Canada) ou en HA (La Paz, Bolivie – 3600m).
Nos principaux résultats démontrent que, par rapport aux rats, les souris adultes de HA présentent une surface alvéolaire augmentée associée avec une meilleure extraction d’O2 sans augmentation excessive de l’érythrocytose ni hypertrophie ventriculaire. Au NM, en conditions ambiantes, les deux espèces présentent des réponses physiologiques similaires. Par contre, après 6h d’exposition en hypoxie (12% d’O2), par rapport aux rats, les souris augmentent leur ventilation minute et diminuent leur métabolisme. Les souris augmentent également l’expression de l’hypoxia inducible factor 1 (HIF-1 – molécule principale de régulation des réponses cellulaires en hypoxie) dans le tronc cérébral après 6h d’hypoxie (15% d’O2) ; cet effet n’est pas présent chez les rats.
Au NM, l’hypoxie postnatale induit une augmentation du volume pulmonaire et de la réponse ventilatoire à l’hypoxie chez les souris mais pas chez les rats. Cependant, chez les jeunes rats de HA, l’architecture pulmonaire est préservée comparée aux rats exposés en hypoxie postnatale au NM.
En conclusion, les rats vivant en HA depuis plusieurs générations présentent des stratégies physiologiques pour faire face au manque d’O2 ambient leur permettant de survivre dans des conditions de laboratoire mais qui ne sont pas suffisantes pour assurer leur survie en milieu sauvage. Nos résultats confirment également que les souris possèdent des prédispositions physiologiques permettant la survie en altitude.
ABSTRACT
Different rodent species present divergent abilities to colonize and establish stable colonies at high altitude (HA). Ecological studies show that mice (Mus) can be found at HA (up to 4000m) while rats (Rattus) are absent.
The ability of an animal to survive and do physical activities at HA depends upon biological adaptations that can include physiological (phenotypical plasticity) and genetic, or epigenetic modifications. Adult Sprague Dawley (SD) rats can live under laboratory conditions at HA for several generations (La Paz, Bolivia – 3600m), but they display signs of physiological maladaptation such as excessive erythrocytosis, right ventricular hypertrophy (a sign of pulmonary hypertension) and altered alveolar structure with enlarged airspace in the lungs. These responses are mainly linked to an excessive sensibility to the oxygen (O2) ambient level during postnatal life. Indeed,
raising the HA rats under sea level (SL) O2 pressure during early postnatal life
significantly improved the physiological adaptation1,2. Furthermore, in HA wild mice (Mus musculus) living at HA, there is no signs of genetic adaptation to this environment. Accordingly, our general hypothesis is that mice possess specific physiological traits ensuring survival at HA.
To assess this hypothesis, we conducted 4 studies to compare physiological responses (including ventilation, metabolic rate, hematology, lung morphology, arterial O2 saturation and heart rate) between FVB mice and SD rats raised at SL (Quebec,
Canada) or HA (La Paz, Bolivia – 3600m).
Our main results show that compared with rats, HA adult mice display enhanced alveolar surface area associated with increased O2 extraction, and avoid excessive
erythrocytosis and right ventricular hypertrophy. At SL, under ambient conditions, mice and rats display similar physiological variables. However, after 6 hours of sustained hypoxia (12% O2), mice have higher minute ventilation and lower metabolic
rate than rats. Mice also had an increased expression of the hypoxia inducible factor 1 (HIF-1 – the principal mediator of the cellular responses in hypoxia) in the brainstem after 6 hours of hypoxia (15% O2), while this response was not observed in rats.
Hypoxic exposure during postnatal life at SL increased the lung volume and the hypoxic ventilatory response in mice but not rats. However, young HA rats preserve their lung architecture compared with young SL rats exposed to postnatal hypoxia.
We conclude that rats living at HA for several generations display physiological strategies to cope with the ambient hypoxia that allow them to survive in laboratory conditions but are not sufficient to establish stables colonies in the wild. Also, our results confirm that mice are predisposed to withstand hypoxic environment.
TABLE OF CONTENTS
RÉSUMÉ iii
ABSTRACT v
TABLE OF CONTENTS vii
LIST OF TABLES xi
LIST OF FIGURES xiii
LIST OF SYMBOLS AND ABBREVIATIONS xvii
ACKNOWLEDGEMENTS xxi
PREFACE xxiii
I. CHAPTER 1 1
GENERAL INTRODUCTION 1
1. Introduction 2
1.1. Altitude and atmospheric pressure 2
1.1.1. Definition of altitude 2
1.1.2. Consequences of the earth elevation on the atmospheric pressure 2
1.2. Life at high altitude 6
1.2.1. Paleo-ecological reports of mammals and birds at altitude 7
The Andean Plateau rise and paleo-ecology 7
The Tibetan Plateau rise and paleo-ecology 8
The Ethiopian Plateau rise and paleo-ecology 9
1.2.2. Today’s ecological report of mammals’ distribution at high altitude 11
HA endemic species 12
HA species imported during the Spanish conquest 13
What about human repartition at HA? 14
1.3. Oxygen at high altitude 15
1.3.1. Oxygen, “the molecule of life” 15
1.3.2. The oxygen cascade 18
1.3.3. Breathing and gas exchanges 22
2. Physiological responses to environmental hypoxia 24
2.1. The ventilatory responses in hypoxia 26
2.1.1. Ventilatory response to acute hypoxia 27
Chemoreceptors definition, localization and role 28
The hypoxic ventilatory response 29
The peripheral mechanisms mediating the HVR in mammals 32
The central mechanisms mediating the HVR in mammals 34
2.1.2. Ventilatory response to long-term hypoxia in low altitude natives: the ventilatory
acclimatization to hypoxia 36
The peripheral mechanisms mediating the VAH in mammals 36
The central mechanisms mediating the VAH in mammals 38
2.1.3. The ventilatory response in HA endemic species including humans 38
2.2. The gas-exchange surface in hypoxia 40
2.3. The diffusion and circulation of O2 in hypoxia 43
2.3.1. The lungs diffusive conductance 44
2.3.2. The pulmonary circulation 46
2.3.3. Blood oxygen transport 49
The increase in the red blood cell number 50
The affinity of Hb for O2 52
The other factors influencing the O2 transport in the blood 56
2.4. The diffusion and utilization of O2 in the hypoxic tissues 56
2.4.1. The O2 diffusion and neo-capillarization in muscle at high altitude 57
2.5. Could adaptation fail in high altitude natives? 62
3. Research hypotheses 63
II. CHAPTER 2 69
DIVERGENT PHYSIOLOGICAL RESPONSES IN LABORATORY RATS AND MICE RAISED AT
HIGH ALTITUDE 69
1. Abstract 70
2. Introduction 71
3. Materials and methods 72
3.1. Animals 72
3.2. Recording of ventilatory parameters, arterial oxygen saturation, and heart rate in unrestrained, unanesthetized rats and mice at high altitude 73 3.3. Hematological parameters, dissection of hearts and lungs 75
3.4. Lung histology 76
3.5. Lung morphology 77
3.6. Allometric scaling in rats and mice 77
3.7. Sea level values 78
3.8. Statistical analysis 78
4. Results 79
4.1. Physiological parameters, hematology, and lung architecture in high altitude rats
and mice 79
4.1.1. Arterial oxygen saturation, heart rate, and hematology 79 4.1.2. Minute ventilation, tidal volume, and respiratory frequency 82 4.1.3. Metabolic rate, respiratory exchange ratio and body temperature 84
4.1.4. Lung volume, lung mass, and lung architecture 85
4.2. Respiratory, metabolic and heart rate responses to changes in inspired PO2 in high
altitude rats and mice 88
4.2.1. Arterial oxygen saturation and heart rate 88
4.2.2. VE, VT, fR, metabolic rate and body temperature 89
5. Discussion 94
5.1. Right ventricular hypertrophy, excessive erythropoiesis and elevated heart rate are
present in high altitude rats but not in mice 95
5.2. Reduced metabolic rate and elevated respiratory exchange ratio in high altitude
rats versus mice 97
5.3. Reduced lung volume and alveolar exchange surface area in high altitude rats
versus mice 98
5.4. Respiratory and metabolic responses to hypoxia in high altitude rats and mice 99 5.5. Sex specific effects in high altitude rats and mice 101
III. CHAPTER 3 103
DIVERGENT PHYSIOLOGICAL AND MOLECULAR RESPONSES TO HYPOXIA IN
LABORATORY RATS AND MICE AT SEA LEVEL 103
1. Abstract 104
2. Introduction 105
3. Materials and methods 106
3.1. Animals and experimental groups 106
3.2. Hematological variable 107
3.3. Lung architecture 108
3.3.1. Dissection of heart and lung 108
3.3.2. Lung histology and morphology 108
3.4. Recording of arterial oxygen saturation and heart rate in unrestrained,
unanesthetized rats and mice at sea level. 109
3.5. Recording of the ventilatory and metabolic variables 110
3.6. Dosage of HIF-1 in the brainstem 111
3.6.1. Dissection of the brainstem 111
3.6.2. Extraction of the nuclear fraction 111
3.7. Allometric scaling in rats and mice 113
3.8. Statistical analysis 113
4. Results 114
4.1. Arterial oxygen saturation, heart rate, hematology and lung architecture in baseline
conditions in sea level rats and mice 114
4.1.1. Arterial oxygen saturation, heart rate, and hematology 114
4.1.2. Lung volume, lung mass and lung architecture 115
4.2. Arterial oxygen saturation, heart rate and body temperature in responses to acute
hypoxia in sea level rats and mice 117
4.2.1. Arterial oxygen saturation and heart rate 117
4.2.2. Body temperature 118
4.3. Minute ventilation, tidal volume, respiratory frequency, metabolic rate, and rectal temperature in response to sustained hypoxia in sea level rats and mice 119
4.3.1. Minute ventilation, tidal volume and respiratory frequency 119 4.3.2. Metabolic rate, respiratory quotient, and body temperature 122 4.3.3. Respiratory exchange ratio and correlation between respiratory and metabolic
variables 124
4.4. HIF-1 expression in the brainstem of sea level rats and mice 126
5. Discussion 127
5.1. Sea level rats and mice have similar lung architecture, right-to-left ventricle ratio
and hematocrit level 128
5.2. HIF expression is increased in response to sustained hypoxia in the brainstem of
mice but not rats 129
5.2.1. Methodological considerations 129
5.2.2. Mice and rats have increased expression of HIF-1 in response to hypoxia 130 5.3. Ventilatory response to sustained hypoxia in rats and mice 132 5.4. Metabolic response to sustained hypoxia in rats and mice 133
IV. CHAPTER 4 137
DIVERGENT PHYSIOLOGICAL RESPONSES TO POSTNATAL HYPOXIA IN RATS AND MICE
RAISED AT SEA LEVEL 137
1. Abstract 138
2. Introduction 139
3. Material and methods 141
3.1. General experimental design 141
3.2. Recording of ventilatory parameters, arterial oxygen saturation, and heart rate in
unrestrained, unanesthetized rats and mice 142
3.3. Dissection of hearts and lungs 143
3.4. Lung morphology 144
3.5. Allometric scaling in rats and mice 144
3.6. Statistical analysis 144
4. Results 145
4.1. Right ventricular hypertrophy 148
4.2. Lung morphology 149
4.3. Respiratory and metabolic values recorded under baseline conditions 151 4.4. Pulse oximetry oxygen saturation and heart rate under baseline conditions and
during hypoxic exposure 154
4.5. Hypoxic ventilatory response 156
5. Discussion 161
5.1. High altitude versus sea level rats and mice 162
5.1.1. “Predispositive traits”: sea level control newborn mice have higher alveolar surfaces but similar levels of PO2,sat in acute hypoxia compared with control rats 163
5.1.2. “Developmental plasticity”: newborn mice have larger lungs, and higher HVR
than rats after exposure to postnatal hypoxia 164
V. CHAPTER 5 169
HIGH ALTITUDE 14-DAY-OLD LABORATORY RATS HAVE ACQUIRED CHARACTERISTICS
THAT PROTECT LUNG GROWTH AT 100 mmHg 169
1. Abstract 170
2. Introduction 171
3. Materials and methods 173
3.1. General experimental design 173
3.1.1. Animals 173
3.1.2. Oxygen exposure 173
3.2. Recording of arterial oxygen saturation in unrestrained, unanesthetized rats 174
3.3. Dissection of hearts and lungs 175
3.4. Lung histology and morphology 176
3.5. Allometric scaling in rats and mice 177
3.6. Statistical analysis 177
4. Results 178
4.1. Body mass 178
4.2. Right ventricular hypertrophy 179
4.3. Lung morphology 180
4.4. Arterial O2 saturation under baseline condition and during hypoxic and hypobaric
normoxic exposure 185
5. Discussion 187
5.1. Developmental plasticity, acquired traits or epigenetics changes in the lung
architecture in rat at HA? 187
5.2. Developmental plasticity in the arterial O2 gas exchange surface area: P4 HA rats
maintain elevated levels of PO2,sat in acute hypoxia compared with P4 SL rats but this
characteristics is lost in P14 HA rats. 189
VI. CHAPTER 6 191
GENERAL DISCUSSION 191
1. Compared with adult rats, adult mice display better physiological responses to hypoxia 192
1.1. Hypothesis 1: mice exposed to chronic hypoxia for several generations maintain O2
consumption using hyperplasic mitochondria 193
1.2. Hypothesis 2: Mice exposed to chronic hypoxia for several generations have enhanced lung morphology and architecture to cope with the decreased O2 level 196
1.3. Hypothesis 3: the increased expression of HIF-1 in mice could be the early determinant inducing a cascade of events leading to the functional plasticity responsible for a better acclimatization to hypoxia in HA mice compare with rats 199 2. Sensibility to hypoxia in the lung growth during postnatal life in rats and mice at SL and HA 202
2.1. Hypothesis 1: accelerated lung growth during postnatal development at HA is a necessity to ensure future adequate gas-exchange functions in adulthood 203 3. The HA rats are living at the extreme limits of their physiological capacities 209 3.1. Hypothesis 1: Excessive hypoxia-induced production of ROS in rats is responsible
for the adaptation loss with aging 210
3.2. Hypothesis 2: HA rats present a defect in the heart capillarization 212
VII. CHAPTER 7 215
GENERAL CONCLUSION 215
Appendix 1 219
Appendix 2 221
LIST OF TABLES
Table I.1: Respiratory quotients and thermal equivalents of metabolic substrates. ... 60 Table II.1: Comparison between values obtained at sea level and high altitude for selected variables in adult (3 months old) male rats or mice. ... 94 Table IV.1: Values of body mass (g), Hct (%), and absolute values for lung morphology
(volume - ml, mass - g, and total alveolar surface area – m2), ventilatory (fR – breath/min, VT – ml, and VE – ml/min), and metabolic variable ( and – ml/min) at 14 or 15 (lung morphology) days of age in rats and mice raised under normal conditions (normoxia) or 13.5% O2 (hypoxia). ... 147
VO
LIST OF FIGURES
Figure I.1: Torricelli creating the mercury barometer. Camille Flammarion engraving,
1923. ... 4
Figure I.2 Evolution of the barometric pressure (PB) with the altitude elevation of the earth. ... 5
Figure I.3: Topographical world map representing the global land and undersea elevation.6 Figure I.4: (A) Map of Bolivia showing localities where mammals fossils were found. (B) Temporal sequence, calculated paleoelevations at time of deposition and modern elevations of the fossil mammal localities. ... 11
Figure I.5: Organization of the organelles of the animal cell. ... 16
Figure I.6: Structure of the respiratory chain ... 17
Figure I.7: Evolution of the PO2 from the atmospheric air to the mitochondrion. ... 20
Figure I.8: The oxygen transport system. ... 21
Figure I.9: The steps of the cellular respiration. ... 24
Figure I.10: The physiological adjustments observed in endemic species from the high altitude environment compared with lowland. ... 25
Figure I.11: Components of the regulation of breathing. ... 28
Figure I.12: How bar-headed goose have improve their cardiovascular and respiratory physiology along the oxygen cascade to cope with chronic environmental hypoxia and flying over the Himalayas. ... 32
Figure I.13: Cellular organisation of the carotid body. ... 33
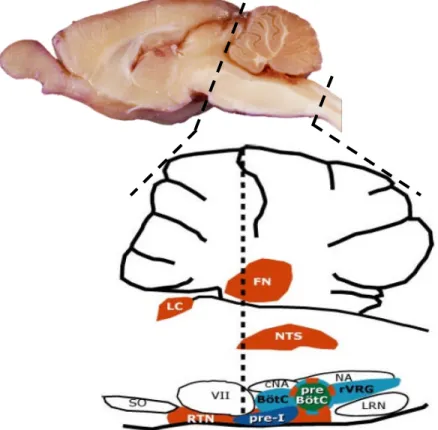
Figure I.14: Midsagital section of the brain of a rat with representation of the respiratory pre-motor, putative rythmogenic and central chemoreceptors. ... 35
Figure I.15: Ventilatory responses to (A) acute, (B) sustained and (C) chronic hypoxia. ... 38
Figure I.16: Architectural organisation of the lung. ... 41
Figure I.17: Cat left lung inferior lobe arteriogram. ... 46
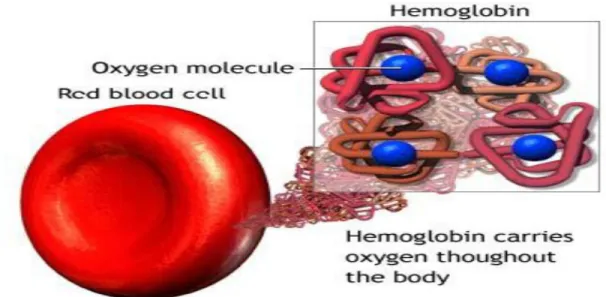
Figure I.18: O2 molecules are carried out by the Hb proteins inside the red blood cells. ... 49
Figure I.19: Oxyhemoglobin dissociation curve of four avian species. ... 53
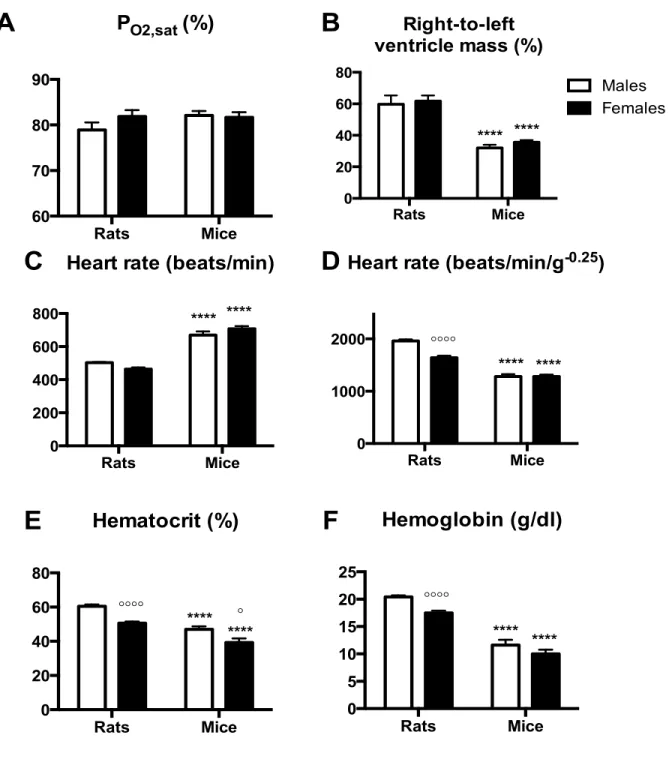
Figure II.1: Hematological variables, right ventricular hypertrophy, heart rate and arterial saturation in high altitude rats and mice. ... 81
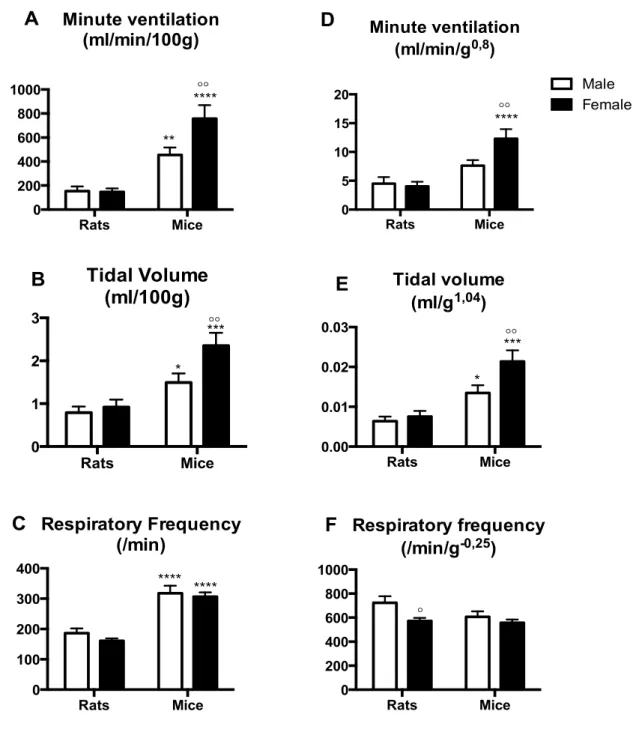
Figure II.2: Ventilatory variables under baseline conditions (21% O2) in high altitude rats and mice. ... 83
Figure II.3: Metabolic variables under baseline condition (21% O2) in high altitude rats and mice. ... 85
Figure II.5: Lung architecture variables in high altitude rats and mice. ... 87
Figure II.6: Total alveolar surface area to O2 consumption ratio (m2/ml/min) in high altitude rats and mice. ... 87
Figure II.7: Response to changes of inspired O2 in high altitude rats and mice. ... 89
Figure II.8: Ventilatory responses to changes of inspired O2 in high altitude rats and mice. ... 91
Figure II.9: Metabolic responses to changes of inspired O2 in high altitude rats and mice. 92 Figure II.10: Responses to changes of inspired O2 in high altitude rats and mice. ... 93
Figure III.1: Hematological variables, right ventricular mass ratio, heart rate and arterial O2 saturation in sea level rats and mice. ... 115
Figure III.2: Variables of lung morphology in sea level rats and mice. ... 116
Figure III.3: Variables of lung architecture in sea level rats and mice. ... 117
Figure III.4: Response to changes of inspired O2 in sea level rats and mice. ... 118
Figure III.5: Body temperature before and after exposure to acute graded levels of hypoxia. ... 119
Figure III.6: Ventilatory variables in response to normoxia and sustained hypoxia – 6h at 21, 15 and 12% O2 – in sea level rats and mice. ... 121
Figure III.7: Metabolic variables in response to normoxia and sustained hypoxia – 6h at 21, 15 and 12% O2 – in sea level rats and mice. ... 123
Figure III.8: Respiratory exchange ratio under baseline conditions (21% oxygen for 6h) and in response to sustained hypoxia (15 and 12% O2 for 6h) in sea level rats and mice. ... 125
Figure III.9 Correlation between VE against showing the effect of hypoxia in rats and mice. ... 125
Figure III.10: Correlation between VE against showing the effect of hypoxia in mice and rats... 126
Figure III.11: Expression level of HIF-1 in the brainstem in response to sustained hypoxia (15 and 12% O2 for 6h) corrected for the baseline values (21% O2) in sea level rats and mice. ... 127
Figure IV.1: Right ventricular hypertrophy in 14-day-old rats and mice raised under normoxia or postnatal hypoxia. ... 148
Figure IV.2: Typical images of the lungs in 14-day-old rats and mice raised under normoxia or postnatal hypoxia. ... 150
Figure IV.3: Parameters of lung architecture in 14-day-old rats and mice raised under normoxia or postnatal hypoxia. ... 151
Figure IV.4: Ventilatory and metabolic variables recorded under baseline condition (21% oxygen) in 14-day-old rats and mice raised under normoxia or postnatal hypoxia. . 153
VO
2
VCO
Figure IV.5: Response to changes of inspired O2 of arterial oxygen saturation and heart rate in 14-day-old rats and mice raised under normoxia or postnatal hypoxia. ... 155 Figure IV.6: Response to changes of inspired O2 of respiratory variables (mass-corrected values) – in 14-day-old rats and mice raised under normoxia or postnatal hypoxia. 157 Figure IV.7: Response to changes of inspired O2 of metabolic variables (mass-corrected
and % versus baseline) – in 14-day-old rats and mice raised under normoxia or postnatal hypoxia. ... 159 Figure IV.8: Response to changes of inspired O2 of body temperature in 14-day-old rats
and mice raised under normoxia or postnatal hypoxia. ... 160 Figure IV.9: Response to changes of inspired O2 for the respiratory exchange ratio ( /
) in 14-day-old rats and mice raised under normoxia or postnatal hypoxia. ... 161 Figure V.1: Body mass in 4- and 14-day-old SL and HA male rats. ... 178 Figure V.2: Right ventricular hypertrophy in 14-day-old SL and HA rats raised under
normoxia or with postnatal exposure to hypoxia (at SL) or normoxia (at HA). ... 179 Figure V.3: Lung volume and lung mass in 14-day-old SL and HA rats raised under
normoxia or with postnatal exposure to hypoxia (at SL) or normoxia (at HA). ... 180 Figure V.4: Typical lung architecture (A-D) and Lm (E) in 14-day-old SL and HA rats raised
under normoxia or with postnatal exposure to hypoxia (at SL) or normoxia (at HA).182 Figure V.5: Variables of lung architecture in 14-day-old SL and HA rats raised under
normoxia or with postnatal exposure to hypoxia (at SL) or normoxia (at HA). ... 184 Figure V.6: Arterial O2 saturation in response to changes PiO2 in 4- and 14-day-old SL and HA rats. ... 186 Figure VI.1: Variables of body mass, lung morphology and architecture in adult mice raised at SL and HA. ... 198 Figure VI.2: Schematic illustration of HIF-1 regulation. ... 200 Figure VI.3: Variables of lung morphology and architecture in adult mice raised at SL and HA. ... 207 Figure VI.4: Total alveolar surface area in SL 14-day-old mice, SL adult mice, and HA
adult mice. ... 208
VCO
2
VO
LIST OF SYMBOLS AND ABBREVIATIONS
ATP adenosine triphosphate
CB carotid bodies
CMS chronic mountain sickness CNS central nervous system CO2 carbon dioxide
CSN carotid sinus nerve DTT dithiothreitol
EE excessive erythrocytosis
EPO erythropoietin
FO2 oxygen fraction
fR respiratory frequency
GABI the great American biotic interchanges
HA high altitude Hb hemoglobin [Hb] hemoglobin concentration Hb-O2 oxyhemoglobin Hct hematocrit level HD hypoxic desensitization HIF hypoxia inducible factor
H2O water
HVA hypoxic ventilatory acclimatization HVR hypoxic ventilatory response
IBBA Bolivian Institute of High Altitude Biology
Lm mean linear intercept LV+S left ventricle + septum Ma millions of years ago mmHg millimeters of mercury
NM neuromodulators
NTS nucleus tractus solitarus P4,P14,P15 4, 14, 15 days postnatally
PFA paraformaldehyde
PCO2 carbon dioxide partial pressure PO2,sat arterial oxygen saturation PO2 oxygen partial pressure PiO2 inspired oxygen partial pressure ROS reactive oxygen species RV right ventricle
SL sea level
VE minute ventilation
oxygen consumption per minute carbon dioxide production per minute
VT tidal volume
VO
2
VCO
À mon Papé et ma Nanna.
ACKNOWLEDGEMENTS
Voici venu le temps d’écrire ces quelques mots afin de vous remercier, vous, qui m’avez accompagné dans les moments joyeux et ceux un peu moins joyeux qui ont marqué mon quotidien pendant ces 4 années de thèse.
Je sais que les quelques mots que je coucherais sur ce papier ne pourront réellement refléter ce que chacun d’entre vous représente à mes yeux mais sachez cependant qu’ils auront été écrits avec sincérité et sans détours.
Je suis arrivée à Québec pour mon stage de Master 2 en 2011. J’ai eu la chance d’intégrer l’équipe du Dr. Vincent Joseph apprenant par la même occasion que nous étions issus de la même université et du même master, avec quelques 10 années d’écarts (Vive
Claude Bernard et Lyon YEAH !). Je choisi donc de lui adresser mes premiers
remerciements. Même si nos premières semaines ensembles ne laissaient pas forcément présager cette tournure des choses, merci infiniment pour ta patience, ta confiance et ta présence dans les moments difficiles. Merci d’avoir toujours été à un appel Skype ou un sms de distance pratiquement 24h sur 24 et 7 jours sur 7, étant quelqu’un qui panique très rapidement et il faut le dire assez facilement dépassée par les évènements je tiens vraiment à te remercier de m’avoir fait grandir aussi bien personnellement que scientifiquement. Merci également pour ton écoute, tes réponses à tous mes questionnements si simplistes soient-ils, et pour nos discussions parfois un peu têtues mais toujours très riches (je sais que je parle beaucoup et qu’il est parfois difficile d’en placer une mais nous avons toujours réussi à trouver un terrain d’entente, même si parfois cela demandait de grandes délibérations, alors vraiment MERCI).
Je ne peux pas penser à mon quotidien scientifique sans citer Delphine qui m’a prise sous son aile lors de mon arrivée au laboratoire, qui m’a appris tellement que je ne pourrais l’expliquer ici sans écrire 3 pages, qui a su me remonter le moral, me rassurer, me booster également quand je pensais que tout s’effondrait même à plusieurs milliers de km. Une autre personne qui a beaucoup compté pour moi à mon arrivée est Hanan, tu as été comme une grande sœur pour moi, tu m’as mis un toit sur la tête, tu as su supporter mon caractère et mes caprices d’enfant, tu m’as aussi aidé dans mes débuts scientifiques. Merci pour l’année passée en colocation avec toi, nos partages, nos soirées à bosser chacune sur notre ordi tout en discutant sur Skype même si nous n’étions qu’a 20 cm l’une de l’autre. Je n’avais jamais vécu en colocation avant toi et je n’en ai jamais refait qui ait fonctionné par la suite, je pense que la complicité que nous avons eu n’était pas celle de 2 colocataires mais plutôt celle de 2 sœurs.
Je tiens également à remercier les différentes équipes du centre de recherche de l’Hôpital Saint François, merci au Dr Richard Kinkead (désolé pour mon manque d’assiduité aux séances de piscines), à Roumi, à François, au Dr. Jorge Soliz et également Raphael, qui, même s’il n’est plus à l’hôpital, reste à un clique Facebook pour répondre à mes questions incongrues ; ainsi qu’a l’ensemble du personnel du centre de recherche, en particulier Richard Rhéel, Mélanie Pelletier et Mélanie Malouin.
Des remerciements tout particuliers sont adressés au personnel de l’institut Bolivien de la Biologie de l’Altitude, qui eux aussi ont supporter mon caractère pas facile et ont su répondre à mes demandes malgré la barrière de la langue, alors merci au Dr. Soria, à Marcelino, Ibana, y especialmente un grande Abbrazo para Gabi y la Marti y el Santi, vosotros me extranais mucho.
Bien-sûr le quotidien d’un étudiant en thèse se compose de 90% de science ;) mais en dehors de ça, ma vie à Québec a également été marquée par des rencontres, des aventures, des voyages. Je souhaiterais donc adresser mes quelques mots suivant à ceux qui m’ont accompagné de près ou de loin dans ce quotidien. Je remercie la C.O.S.A qui m’ont apporté un groupe d’entre-aide, de potes, de rigolades, de partage de passions, je pense particulièrement à JS, Francis, PA, Audrey (P.S. le cheval c’est trop génial :p),
heures partagées dans la même galère ;). Un gros merci chevaleresque va à Delphine pour m’avoir accordé ta confiance avec Kalhua. Merci Sylvie de m’avoir fait découvrir l’attelage et la joie de former un cheval, Windy est une jument extraordinaire et j’espère continuer avec toi ce partage pendant encore quelques temps même si je ne sais pas ce que le sort me réserve je garde cet espoir. Un ENOOOOORME merci va à Benjamin pour ta patience, ta présence, ton aide, tes mots rassurants, que dire d’autres, les mots me manquent pour exprimer ce que tu as représenté pour moi au cours de ces 4 années. Tu es venu me voir jusqu’en Bolivie, tu m’as aidé pour mes analyses, mes posters, même mon manuscrit de thèse malgré que ton quotidien ne soit pas du tout en rapport avec la recherche et les sciences, tu m’as accompagné dans mon quotidien dans les bons moments et d’autres beaucoup plus dur, ça n’a pas toujours été facile mais tu es toujours resté là, malgré tout. Alors sincèrement du fond de mon cœur merci, merci d’être toi, merci d’être là et merci pour tout ça. Bien-sûr je ne peux pas penser à ceux qui m’ont soutenu sans retenue sans penser à Yves, merci de supporter mon sacré caractère, merci d’avoir toujours sous la main la petite chose qu’il me manque, d’avoir toujours répondu présent, merci pour ton coaching pour les concours, ton écoute de mes répétitions, merci de m’avoir fait découvrir Tadoussac un petit coin de paradis sur terre quand on aime les cétacés. Enfin un merci tout plein de tendresse va à Ibrahim, même si nous ne nous comprenons pas toujours, même si ça n’est pas toujours simple et que notre histoire ressemble aux montagnes russes d’un grand 8, tes bras ont toujours été là pour que je puisse m’y réfugier quand ça n’allait pas, un merci particulier pour ton soutien dans les derniers moments difficiles de ma rédaction.
Les 10% restant de mon quotidien étaient aussi rythmé par les messages et les appels Skype de mes amis restés là bas, ceux quittés dans la lourde décision prise de partir poursuivre ses rêves sur un autre continent mais qui, malgré la distance, sont toujours là, nous manquent, et vivent par procuration nos joies, nos peines comme nous vivons les leurs, nous expat’. Je pense bien-sûr à Elo (ma pupute adorée merci pour ta patience avec toutes mes questions équestres et tous tes bon conseils), ma petite Laurinette (ma coupine à moi, amoureuse des animaux et un peu folle comme moi), Clément (mon petit marsu adoré qui est toujours là pour m’envoyer un petit sms quand il se dit que ça fait trop longtemps que je n’ai pas donné de nouvelles), Damien (le seul à supporter mon caractère depuis presque 20 ans ahhh que ça passe vite, tu me manques mon snake), Qingli (ma petite puce, merci d’être venu me voir, ça m’a fait tellement plaisir de partager ces quelques jours avec vous), et bien-sûr ma mini Laurie (ma furbinette, pucinette, choupinette, poupinette d’amour, merci pour nos innombrables heures passées sur Skype, pour ton soutien, ton écoute, tes conseils, nos voyages, nos délires, nos discussions, je t’adore je vois pas quoi dire de plus mais en tout cas tu es un petit bout de moi ça c’est sûr).
Bien sûr je ne peux terminer ces remerciements sans avoir une pensée très particulière pour mon tonton Thierry et bien sûr mon petit maminou, je t’aime fort fort maminou et je sais qu’en ce moment ça n’est pas facile et que nous aussi notre histoire ressemble aux montagnes russes d’un grand 8, mais je suis sûre que tout finira par rentrer dans l’ordre et même si des milliers de km nous séparent, nous y arriverons.
PREFACE
Chapter 2, p69 corresponds to my first article published as first author. The experiments were conducted at the Bolivian Institute of High Altitude Biology (Instituto Boliviano de Biologa de Altura – IBBA) in Bolivia, in the city of La Paz at 3600m of altitude. This paper was published in April 2015 in the Journal of Experimental Biology.
I would like to thanks Lic. Gabriella Villalpando, Dr. Marcelino Gonzales and Dr. Ibana Valverde who helped me conducting my experiments in Bolivia and Dr. Rudy Soria who gave me unrestrained access to all the facilities I needed at the IBBA.
My Director, Dr. Vincent Joseph, the director of the physiological department at the IBBA, Dr Rudy Soria, Dr. Marcelino Gonzales and myself developed the concepts and designed the experiments.
Lic. Gabriella Villalpando and Dr. Marcelino Gonzales helped me collecting the physiological datas of the experiments, (plethysmography reccordings, tissue sampling) and Dr. Ibana Valverde included all the samples at her laboratory after manual embedding in paraffin at the IBBA because the IBBA was not equipped for this process. I conducted all the histological processes alone in Quebec City.
Later, I analyzed the data, prepared the figures and wrote the manuscript with the help of my director Dr. Vincent Joseph.
I. CHAPTER 1
1. Introduction
1.1. Altitude and atmospheric pressure
1.1.1. Definition of altitude
According to the Collins dictionary, altitude can be defined as: “the vertical height of an object above some chosen level, especially above sea level” – SL.
Then, the regions of the earth’s surface that are high above SL can be divided into categories depending to the height: low altitude (below 1000m above SL), high altitude (HA – between 1500-3500m (m) above SL), very high altitude (between 3500-5500m above SL) and extreme altitude (above 5500m above SL)3. Despite this recent quite thorough
altitude division used in medicine, scientists that have studied the biological consequences of altitude for centuries often draw a simpler line that just divide altitude environment into low- and high-altitude. The line was set at 2500m for quite some times now as it was the “limit” where most people experienced “high-altitude effects”4,5 and this is the line that I am going to use when I speak about low- and high-altitude environment here.
1.1.2. Consequences of the earth elevation on the
atmospheric pressure
Atmospheric air is composed of several gases that expand in all directions and have a weight, meaning that the air exerts a pressure upon all bodies with which it enters in contact. Because air has a mass, Earth gravity attracts it and gives it weight. Because it has a weight,
and the air molecules constantly bump into things, it exerts pressure. The amount of pressure exerted by atmospheric air upon an object is called the atmospheric pressure. It depends of the amount and the weight of atmospheric air lying above the objects and pressing upon them. As you go up, air pressure goes down because the higher you go, the less air there is pressing down on you. So, the atmospheric air pressure and density diminishes as an object gets closer to the exosphere1 (upper limit of the atmosphere), and with the elevation of
the earth ground, one can observe a diminution of the atmospheric pressure.
We had to wait until the 17th century for the discovery of the existence of the atmospheric pressure. Evangelista Torricelli (1608-1647) an Italian physicist and mathematician was one of the first to discover that air actually had a weight and invented the first mercury barometer in 1643 (Figure I.1.). The first mercury barometer was a device that measured the “weight” of air by displacing a U-shaped column of mercury open to the atmosphere on one side and closed on the other side (the closed side being emptied of air). The first experiment that used the reduction of the height of a column of mercury and associated it with the altitude of the earth (to demonstrate the changes in the atmospheric pressure) was conducted by Blaise Pascal (1623-1662) in 1648. It is called the “Puy-de-Dôme” experiment and Blaise Pascal made his brother-in-law Pascal Perier measure the diminution of pressure between the city of Clermont-Ferrand and the summit of the Puy-de-Dôme (an extinct volcano at 1464m in the “Massif Central” old-mountain range in the center of France)6.
Figure I.1: Torricelli creating the mercury barometer. Camille Flammarion engraving, 1923.
Then, scientists measured that the weight of the column of air extending from the Earth surface at SL to the exosphere would be equal in weight or pressure to a corresponding column of mercury of 760 millimeters high, and normal SL atmospheric pressure was stated at 760 millimeters of mercury (mmHg)7.
But what constitutes the atmospheric air? Air is a gas mixture composed of 21% of dioxygen (O2), 79% of Nitrogen, 0,9% of argon, 0,04% of carbon dioxide (CO2), 0,002% of neon, 0,0005% of helium
and 0,0002% of methane. In this gas mixture, the partial pressure of any of the gases represents the percentage of the gas in the atmospheric pressure7: if we take the O2 gas for example, at SL, the O2 fraction in the atmospheric air (FO2) is 20,9%. Knowing this allows us to calculate, using the atmospheric pressure, the partial pressure of O2 (PO2) in the air at SL:
Atmospheric PO2 = 21 percent of 760 mmHg = 159,6 mmHg
Then, at 3600m, for instance in the City of La Paz in Bolivia, the atmospheric pressure drop at 490 mmHg (Figure I.2), the FO2 is still 20,9% but the atmospheric PO2 would be 21% of 490 mmHg = 103 mmHg.
Figure I.2 Evolution of the barometric pressure (PB) with the altitude elevation of the earth.
1.2. Life at high altitude
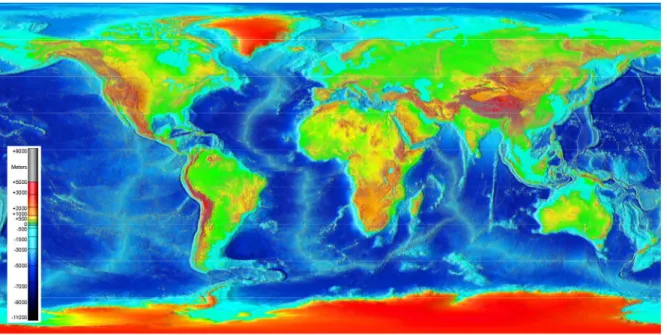
Around the earth, HA regions are found in all continents, as examples there is the Himalayas in Asia, the Rockies and the Andes in America, the Alps and Pyrenees in Europe, the Southern Alps in Oceania and the Ethiopian massif in Africa (Figure I.3). Ecological paleontology showed that most of the current HA human and animal species evolve in parallel with the rise of the mountain. Paleo-ecological reports in the 3 HA plateaus that are the Andean, Tibetan and Ethiopian plateaus demonstrate interesting insights of this concomitant evolution.
Figure I.3: Topographical world map representing the global land and undersea elevation.
1.2.1. Paleo-ecological reports of mammals and
birds at altitude2
Paleoecology, landscape ecology and molecular phylogenies showed that vertebrates have been inhabiting montane3 regions for
more than 20 million years8.
The Andean Plateau rise and paleo-ecology
The Andean Cordillera that extends for over 5000 km along the western coast of South America constitutes the largest mountain chain in direct connection with a tropical rainforest. The uplift of the Andes began at the end of the Cretaceous (65 million years ago – Megaannum, Ma)9, and took place in episodic bursts (the most intense peaks were during the late middle Miocene ~12 Ma and early Pliocene ~4.5 Ma10,11. Molecular phylogeny studies showed that the first vertebrates to colonize HA regions was an ovenbird, belonging to the Tarphonomus Berlepschia clade, 21.8 Ma12. As for rodents, they were present even before the high Andes were formed, and fossils of the guinea pig (Cavia
porcellus) ancestors, caviomorphs, dated from 35 Ma were found in the
Tinguirirican region4 13. Later, the accelerated uplift phases during the last 10 Ma resulted into easing the access to HA regions to plants, birds, insects, and some rodents8. Paleo-ecological studies of late Pleistocene glacial and fluvial deposits at the Tarija Basin (situated at 1854m in Bolivia) implied that the Bolivian Altiplano sustained an ice cap and that
2 To ease the understanding of this part, a timescale is presented in Appendix 1.
3 The montane ecology studies the life system in mountains or other high elevation regions of the earth. Here the
montane region refers to elevational zone from 1500‐3000m.
the faunal composition of the Neogene 5 period results from
geographical, ecological and climatic factors. Another important component responsible for the actual HA biotope in the Andes is the extensive migration of the taxa from North America during the Great American Biotic Interchange (GABI)6 14 during the late Pliocene ~3 Ma. Alfred Russel Wallace (1823-1913), the father of biogeography, was the first to discuss the occurrence of GABI in 1876 in his books The
Geographical Distribution of Animals. With a Study of the Relations of Living and Extinct Faunas as Elucidating the Past Changes of the Earth's Surface15.
The Tibetan Plateau rise and paleo-ecology
The history of the elevation of Tibet, the world’s highest plateau, offers ideas concerning the geodynamics of continental collision as it is stated that the Himalayas were created when Eurasia collapsed with India in the middle Cenozoic ~50 Ma. Nevertheless, some studies raised the possibility of an elevated topography prior to continental collision16 and if records suggest that the southern Tibet has been high since at least 26 Ma17, estimates from northern Tibet and older rocks are not definitive18. During the course of the uplift, the retreat of forests from the interior to the southeastern marge lead to the migration of animals, from the higher to the lower elevations of the mountains causing a faunal composition divergence between the east and the west regions of the plateau. Several studies seem to point out that the major phase of the uplift (~15-8 Ma) coincides with important environmental and climate changes that were responsible for ecosystem modifications and
5 The Neogene is a geologic timescale extending from 23,03 to 2,58 Ma and subdivided into the early Miocene and
the late Pliocene.
6 During most of the Cenozoic, South America was an island continent with an endemic mammalian fauna. This
isolation ceased during the late Neogene after the formation of the Isthmus of Panama, resulting in an event known as the Great American Biotic Interchange (GABI).
ecological diversification in the colonization of the Tibetan plateau19-22. About the vertebrate colonization, little is known, nevertheless, studies showed that the pika, a lagomorph that regroups several typically HA species, was living in the north edge of the Qinghai-Tibetan plateau ~37 million years ago suggesting that it evolved in concomitance with the uplift of the mountain.
The Ethiopian Plateau rise and paleo-ecology
The Ethiopian Plateau is situated in the Horn region of the northeast Africa from the central to northern Ethiopia, its northernmost portion reaching the Eritrea. Called the Ethiopian Highlands or sometimes the roof of Africa, the Ethiopian Plateau is a rugged mass of mountains with little surface below 1500m and summits that can reach 4550m. The plateau is located upon tectonic plates and its great height is the result of an intrusion of lava in Tertiary times whereas its net rock uplift has been 2200m since 150 Ma23. The rift which splits the Ethiopian plateau into the main western and smaller southeastern sections began to open in the Miocene, 13-12 Ma, and was fully formed by the early Pliocene, 5-4.5 Ma24. Yalden and Largen in a review called the endemic
mammals of Ethiopia regrouped a wide range of discovery of mammals
fossils (like equids, bovids but also rodents) dating back to the Pleistocene and the Pliocene times that were discovered at 2000-2300m in the late 70’s and early 80’s25. Later, mammals and plants fossils from the late Oligocene (~23 Ma) were discovered in the Chilga region7.
These authors pointed out that the indigenous fauna in Ethiopian region at this time might have been the result of a faunal exchange between Afro-Arabia and Eurasia 27 Ma, and that in all mountains regions,
vertebrate remains are usually fragmentary and represent medium to large-sized herbivores; a possible reason why small mammals are less found may be due to a diagenesis8 of the bone before fossilization26.
It is important to keep in mind that because the uplift responsible for the creation of the very high summits of the mountains in each plateaus is often quite recent (12-4.5 Ma for the Andes, 15-8 Ma for the Tibetan Plateau and 13-4.5 Ma in Ethiopia) the fossils sites dating earlier than 15 Ma currently lying at elevation between 3000-5000m were deposited at significantly lower elevation (Figure I.4)29. So, even if mammals or birds were present in mountain region 20 Ma, these animals came from migrations of lowlander species, and, adaptation to the HA (over 4000m), is a quite recent phenomenon that occurred in fact possibly less than 1.9 Ma14,30.
8 The diagenesis is the cumulative of physical, chemical and biological environment that will modify an organic object's original chemical and/or structural properties and govern its ultimate fate in terms of preservation or destruction27;28.
Figure I.4: (A) Map of Bolivia showing localities where mammals fossils were found. (B) Temporal sequence, calculated paleoelevations at time of deposition and modern elevations of the fossil mammal localities.
Adapted from MacFadden et al., South American fossil mammals and carbon isotopes: a 25 million-year sequence from the Bolivian Andes, 199429.
1.2.2. Today’s ecological report of mammals’
distribution at high altitude
It is amazing to notice that today in ecological reports, some of our home pet such as cats (Felis catus) or rats (Rattus norvegicus) are absolutely absent of HA regions whereas others such as mice (Mus
musculus), chinchilla (a cross-breeding of the two taxa Chinchilla laniegera and C. brevicaudata) and dogs (Canis lupus) are found at
altitude that can reach 5000m31-35.
Today’s ecological fauna at HA regroups land and flying animals. If you decide to climb a mountain, you might encounter rodents, carnivores, birds, camelidae and bovidae. Nevertheless, a distinction needs to be made between endemic species that have been evolving
almost since 2 Ma with the continental drift and the uplift of the Earth, and the species that have migrated more recently, including the ones who followed the different waves of human colonization at HA in North and South America. Some of the species introduced by Europeans stayed intolerant to life at altitude whereas other developed tolerance to hypoxia. It is also curious to notice that some endemic species are alpine obligate (meaning that they depend on mountaintop ecosystem) and that some imported species were not able to colonize HA environment.
HA endemic species
In North America, the deer mice (Peromyscus maniculatus) have the greatest altitudinal range as they are continuously distributed from SL to elevation above 4300m and are one of the most studied species to understand HA genetic adaptation and evolution. One lagomorph species, the Ochotonids (more commonly known as the pikas), regroups several sub-species, some are typical HA habitants whereas others can be found at a various altitude from SL to HA. Ochotonids came from an ancient group of mammals originating from Asia in the Oligocene that migrated to North America through 3 major waves: beginning in the early Miocene, then during the Miocene-Pliocene boundaries and finally in the early Pleistocene. Fossils show that the American pika has been living at altitude since the middle Pleistocene. The distribution of the first pikas was high and low altitude and it is likely that their restriction to montane environment is linked to a climate change (mostly a shift toward warmer and drier conditions) that occurred in the Holocene (10 000 years ago)36. Their current geographic diversity is concentrated in Asia where 28 species exist, for only 1 species in Europe, and 2 species
in North America. In the Tibetan Plateau, the plateau pika (Ochotona
curzoniae) and the ili pika (Ochotona iliensis) are alpinate obligate and
have a distribution range between 3200-5300m and 2800-3300m respectively whereas in North America, their “cousin” (Ochotona
princeps) exists from SL to 3000m (http://www.wildlifeinformation.org/). In the Andes, the chinchilla, although almost extinct today in it’s wild habitat (because of the extensive hunt for it’s fur in the XVIIIth century), showed 2 species, one found at low altitude the Chinchilla laniegera (SL to 1500m) and one found at HA (3500 to 4500m) the Chinchilla
brevicaudata35,37. Aside from the rodents, in the Andean Cordillera you can also found camelids such as the vicugnas (Lama vicugna) or the alpaca (Lama pacos), small carnivores such as foxes (Dusicyon culpaeus and D. sechurae) and larger ones such as the puma (Felis concolor)32. In the Himalayas and the Tibetan Plateau, bovidae such as the yak (Bos
grunniens and B. mutus) are living between 3000-5500m38. As for the birds, more than 20 species are living at HA and some breed at altitudes extending up to 4900 and 6500m in the Andes and Himalayas respectively39. A bird worth quoting is the Bar-headed goose (Anser
indicus) as it is a well-studied species that breed in the Tibetan Plateau
and has a road migration that can lead them to fly over the Himalayas at altitude up to 9000m40,41. So as you can see, HA ecology is quite diverse and natural HA environment is well furnished in term of species diversity.
HA species imported during the Spanish conquest
In South America, some of the species that are currently inhabiting the Andean Cordillera such as today’s chicken (Gallus gallus),
aries), goats (Capra aegagrus hircus) – or dogs (Canis lupus familiaris)
are the descendants of introduced domestics animals that were imported either on purpose (for food or work purposes) or as clandestine passengers (mice) on the ships of the Spanish conquistadores. Indeed, in South America, all the bovidae living today in HA environment are descendants of introduced domestic animals32.
What about human repartition at HA?
In the 3 Plateaus, in parallel with animal evolution, humans also evolved and colonized HA environment for millennia. Paleoecology sites often were human occupations sites where butchered animal fossils also laid. In the Ethiopian Plateau, hominid sites dating back to the middle Pleistocene described mammal fossils close to human remains at altitudes above 2300m25. In the Andes, before the European arrival, the Incas and pre-Incas civilization had their capital at HA. Then, when immigrant lowland populations arrived in the New-World in the 1500’s, they moved their capital from the highland to the coast42.
During the colonial expansion initiated by the Spanish conquistadores – beginning in 1492 with the arrival of Christopher Columbus (1450-1506) in the Americas – the first conquistadores that visited HA regions reported symptoms like nausea and headaches and designed a disease of altitude that they called soroche (which refers to the disease called today acute mountain sickness) which could, at the time, lead to death. Pioneers first attributed the symptoms of soroche to the cold temperature at HA43,44. Nevertheless, father Acosta (1539-1600) a Spanish Jesuit-missionary and naturalist of Latin America was the first to propose in 1590 that HA “thin air” had a role in the
appearance of the symptoms45. Later, in colonies established in Potosi (a city at 4000m above SL) it is documented that pregnant ladies were transferred to lower altitude to give birth otherwise babies wouldn’t survive most of the times46.
Today, cities are found at altitude higher than 4000m. The highest town, La Rinconada is situated at an altitude of 5100m in Peru. It is an old gold-mining camp that has grown to a city, and today around 7000 people live there47. Nevertheless, low altitude native humans still have trouble acclimatizing to, and inhabiting HA environment.
1.3. Oxygen at high altitude
1.3.1. Oxygen, “the molecule of life”
The differential repartition of mammalians and humans at HA raised an important question: what makes the altitude environment a challenge for living organisms?
The environmental conditions found in high montane environment are reduced barometric pressure, intense solar radiation and cold, all of theses conditions can be challenging for ecological development. Nevertheless, the reduced barometric pressure represents the most challenging environmental condition for organism living at HA because it leads to a diminution in the partial pressure of all gases constituting the atmosphere, including O2.
In the very early history of science, Leonardo Da Vinci (1452-1519) showed that “where flame cannot live, no animal that draws
Lavoisier (1743-1794) in his book Sur la combustion en général proved that the link between combustion and respiration was O2 and that it was essential to both49.
Today, we know that there is a combustion process that involves O2 at the cellular level in organisms50. In eukaryotes9, each cell contains several organelles such as the nucleus, the Golgi apparatus, the ribosome, vesicles etc. (Figure I.5).
Figure I.5: Organization of the organelles of the animal cell.
Source:
http://faculty.ccbcmd.edu/~gkaiser/SoftChalk%20BIOL%20230/Prokaryotic% 20Cell%20Anatomy/proeu/proeu/proeu_print.html
One of them, called the mitochondrion, contains the respiratory chain (Figure I.6), which is an electron transport chain, where a vital part of the metabolism called the oxidative phosphorylation occurs. It consists of an electron transfer from electron donors to electron acceptors in redox reactions. These redox reactions release energy, and O2 is essential to this process as it is the last electron acceptor of the respiratory chain. The reduction of O2 into water (H2O) at the end of the mitochondrial respiratory chain is used to generate adenosine triphosphate molecules (ATP), which are the main energy supplier in cells.
Figure I.6: Structure of the respiratory chain
(A) electron microscopy visualization of a mitochondrion. (B) schematic representation of the organization of the respiratory chain and its V complexes.
Adapted from Chen et al., Regulation of mitochondrial respiratory chain structure and function by estrogens/estrogen receptors and potential physiological/pathophysiological implications, 200551.
ATP is used in a wide variety of biological processes including to maintain basal functions but also in energy consuming processes such as muscular exercise50,52. Actually, it is well established that the aerobic
metabolism in mammals relies on sufficient O2 availability in the mitochondria. Nevertheless, the total amount of O2 available in aerobic organisms (organisms that need O2 to survive and grow) is low and the quantity stored in the tissue even lower (in human, there is around 1.5 liters of O2 in the body and only 50 ml are stored in the tissues). Then, to maintain the oxidative phosphorylation undisturbed and complete, aerobic organisms require a continuous fresh flow of O2 from the outside air to the tissues almost permanently. The diminution of the O2 partial pressure at HA interferes with this supply of O2 to the tissues and furthermore with the functioning of the mitochondrial respiratory chain, leading to a decrease in the ATP production and/or an increase in the generation of reactive O2 species (ROS)10.
1.3.2. The oxygen cascade
Fick’s first law11 postulates that a molecular flux goes from high
concentrated regions to low concentrated regions, with a magnitude that is proportional to the concentration gradient (spatial derivative), without interruption until an equilibrium is reached. It relates the diffusive flux to the concentration under the assumption of a steady state. If we apply the first law to biology:
Flux = -P(c2-c1)
10 The ROS describe reactive molecules and free radicals that derive from molecular O2. They are byproducts of the
mitochondrial electron transport of the respiratory chain but can also be produced by oxido‐reductase enzymes and metal‐catalyzed oxidation. They have the potential to cause a number of deleterious events but play an important role in cell signaling such as apoptosis, gene expression, and activation of cell signaling cascades.
11 Adolf Eugen Fick (1829‐1901) was a German physician and physiologist who introduced the laws of diffusion
that governs the diffusion of a gas across a fluid membrane. In 1870 he was the first to measure the cardiac output. His law applies both to physics and physiology.
Where P is the permeability of the membrane (conductance12) for
a given gas at a given temperature.
Where c2-c1 is the concentration difference of the given gas
across the membrane and depends of the flow direction (here c1 to c2).
The amount of gas that moves across a tissue barrier is also proportional to the area of the barrier and inversely proportional to its thickness, and in a gas mix, each gas is independent and follows its own partial pressure gradient.
In the cells, O2 is used permanently in the mitochondria but its partial pressure is very low, only a few mmHg, whereas in the ambient air, the O2 partial pressure is very high, 160 mmHg at SL (Figure I.7). This difference in the PO2 creates an important gradual partial pressure gradient between the environment and the mitochondria that allow the O2 to travel through the biological barrier by diffusion. The progressive
drop of O2 pressure between the atmospheric air and the mitochondria
is called the oxygen cascade53.
Figure I.7: Evolution of the PO2 from the atmospheric air to the mitochondrion.
The plain line represents the sea level condition and the dotted line a hypoxic situation.
Adapted from John B. West, La Physiologie Respiratoire, 200354.
The O2 cascade path follows the O2 transport path from the atmospheric air to the mitochondria and can be divided into four steps that are similar to, and follow the same road as, the breathing steps (see 1.3.3. p22: ventilation, pulmonary diffusion, circulation and tissue diffusion – Figure I.8).
Figure I.8: The oxygen transport system.
Adapted from Weibel and Hoppeler, Respiratory System Adaptation to Hypoxia: Lung to Mitochondria, 199155.
Because of the diminution of the PO2, organisms living at HA experience a "hypobaric hypoxia" which is a physiological situation where the blood PO2 might change. In aerobic vertebrates, the O2 travels from the alveolar lung through the organisms to the different tissues using the blood vessels. At altitude, the PO2 diminution in the atmospheric air leads to a diminution in the O2 partial pressure gradient differences between arterial and venous blood in the organism, which, if the organism is not able to compensate, might lead to a drop in the O2 cascade and a decrease in the body oxygenation (Figure I.7)56-58.
Ventilation
Pulmonary diffusion
Circulation
1.3.3. Breathing and gas exchanges
Breathing regroups all the mechanisms that allow an organism to exchange gases with its environment. During inspiration, an air rich in O2 is inhaled into the lungs13 whereas during expiration, the CO2
produced by the respiratory processes of the body is exhaled from the lungs. The rhythmic movements of breathing maintain the fluid matrix homeostasis because it stabilizes the O2 and CO2 pressures in arteries and tissues as well as the pH in the physiological limits.
Inspiration is an active phenomenon, which requires active movements of muscles, mainly the diaphragm and the intercostal muscles whereas expiration is most of the time passive59,60.
The breathing steps follow the O2 transport system pathway and is completed in 4 major steps (Figure I.8): pulmonary ventilation, pulmonary diffusion, circulation/perfusion and tissue diffusion that can be described as follow:
‐ The pulmonary ventilation corresponds to a massive O2 entry by the active convection of atmospheric air from the environment into the lungs, more especially into the alveolar spaces. This active phenomenon is powered by the contraction/relaxation cycles of the respiratory muscles (the pulmonary ventilation also refers to the total volume of gas that is inspired or expired per minute).
‐ The pulmonary diffusion is a passive diffusion from the alveoli to the capillaries. In the capillary, the O2 goes through the plasma and across the erythrocyte membrane. Inside the
13 The lungs are the gas exchange organs, their primary function being to allow O2 to move from the air to the
venous blood and CO2 to move out. They also plays a role of physical barrier for unwanted material from the circulation, reservoir of blood and can metabolize some molecular aggregates59.
erythrocyte, O2 will bind to hemoglobin (a specialized protein that transports O2 to the tissues). This passive diffusion is driven by the partial pressure gradient of O2 between the alveoli and the capillaries, the alveolar pressure being superior to the capillary pressure.
‐ The circulation/perfusion transports O2 using the active convection of the blood from the alveolar capillaries and the left heart through the vascular distribution system to all systemic capillaries and returns to the right heart powered by the contraction/relaxation cycle of the myocardium.
‐ During the last step, the tissue diffusion, the O2 diffuses passively from the capillary blood across the plasma membrane into the interstitial space, across the cell membrane throughout the cytoplasm, – facilitated by myoglobin14 (in the cells where
it is present) –, and into the mitochondria. Like in the pulmonary diffusion step, the O2 diffusion from the bloodstream to the tissues is driven by a partial pressure gradient for O2 between the capillaries and the mitochondria, the capillary pressure of O2 being superior to the mitochondrial one50,53,57,61. At the cellular level is found the cellular respiration. The mechanisms of cellular respiration involve three subdivisions (Figure I.9): glycolysis (where glucose molecules are broken down to form pyruvic acid molecules), the Krebs cycle, and the electron transport system of the mitochondria. Along those 3 steps, CO2 is produced as a waste of these metabolic reactions and will be eliminated, as animals cannot use it, using the same travel road as O2, backward, until being expelled outside of the body by expiration53.
Figure I.9: The steps of the cellular respiration.
(A) The glycolysis. (B) The Krebs Cycle. (C) The mitochondrial respiratory chain.
Source: https://www.studyblue.com
2. Physiological responses to
environmental hypoxia
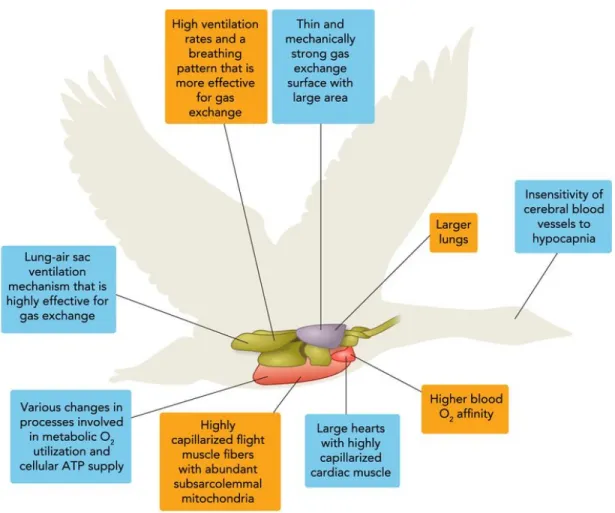
Because most animals rely heavily on O2 to sustain their biological functions, the reduced O2 pressure found in high montane environment is challenging. Nevertheless, many species of birds and mammals successfully exploit HA habitats. Since the beginning of their studies, scientists noticed that, compared with lowland, endemic species as well as humans living at HA displayed specific physiological responses to this particular environment. The main purpose of the physiological adjustments being to improve O2 supply and delivery, to prevent a drop in the O2 cascade of diffusion. The modulation of the responses can occur at several levels (Figure I.10) and among the various possible responses, species living at HA show increased basal ventilation,
A
modified affinity of the red cells for O2, increased lung exchange surface or reduced metabolism. In the following parts, we will discuss the physiological responses and/or observed phenotypes in hypoxia in humans, mammals and sometimes birds.
Figure I.10: The physiological adjustments observed in endemic species from the high altitude environment compared with lowland.
(Here, the Bar-Headed goose, in orange vs lowland goose in blue).
Adapted from Scott et al. How Bar-Headed Geese Fly Over the Himalayas, 201562.
lowland and spoke about adaptive traits to the environment that were present in HA natives but not in lowlands. Afterwards, the term adaptation encountered many definition issues and to clarify the situation, a distinction was made between genotypic adaptation and phenotypic adaptation. Bligh in 1976 defined both terms: genotypic adaptation characterizes genetically determined forms and functions of an organism and its organs to the environment in which they occur whereas phenotypic adaptation occurs within the lifetime of individual organisms and are reversible when these circumstances no longer exist63. Later, the discovery in the early 2000’s that environmental factors can influence gene expression without requiring long-term genetic selection and without becoming hereditary (which refer to the epigenetic mechanisms)64 lead the scientists to review once again the definitions of adaptations. I think that today, we can postulate that endemic species present genotypic adaptations whereas imported species display phenotypic adaptations65 and that epigenetic mechanisms can influence both64,66,67. However, it is important to keep in mind that the part of the influences of epigenetic factors in the physiological responses to HA either in endemic and/or imported species is still unclear67.
2.1. The ventilatory responses in hypoxia
The O2 molecules enter the body through ventilation and it is well known that only one breath of a hypoxic gas mixture will increase the ventilation. In human, ventilation can be adjusted to a very important extent, as it allows them to reach the top of Mount Everest – where the PO2 is only 1/3 of the SL PO258,68. Maintaining ventilation also plays an