Science Arts & Métiers (SAM)
is an open access repository that collects the work of Arts et Métiers Institute of Technology researchers and makes it freely available over the web where possible.
This is an author-deposited version published in: https://sam.ensam.eu Handle ID: .http://hdl.handle.net/10985/10180
To cite this version :
Sofiane ABDALLAH-ELHIRTSI, Joseph FITOUSSI, Baralu-Jagannatha RASHMI, Kalappa PRASHANTHA, Sedigheh FARZANEH, Marie-France LACRAMPE, Patricia KRAWCZAK, Abbas TCHARKHTCHI - Study of partial shape memory effect of polymers by multicycle tests - Polymer Composites - Vol. 36, n°6, p.1145-1151 - 2015
Any correspondence concerning this service should be sent to the repository Administrator : archiveouverte@ensam.eu
1
Study of Partial Shape Memory Effect of Polymers by
Multi-cycle tests
Sofiane Abdallah-Elhirtsi1*, Joseph Fitoussi1, Baralu-Jagannatha Rashmi2, Kalappa Prashantha2, Sedigheh Farzaneh1, Marie-France Lacrampe2, Patricia Krawczak2, Abbas Tcharkhtchi1
1PIMM Laboratory, UMR 8006 CNRS, Arts et Métiers ParisTech, 151 bd de l’hôpital 75013, Paris, FRANCE 2Mines Douai, Department of Polymers and Composites Technology & Mechanical Engineering, 941 rue
Charles Bourseul, CS 10838, F-59508 Douai Cedex, FRANCE * Corresponding author Abstract
In this work, an experimental investigation on a partial shape memory polymer (PSMP) which is transformed into shape memory material is presented. Multicycle shape memory tests are performed on thermoplastic polyurethane (TPU) at 70°C. At the end of each cycle, the capacity of the shape memory material increases. At the end of the first cycle, the recovery rate of TPU is only 67%; this partial shape memory effect (PSME) has been improved by successive cycles of shape memory tests. After the fourth cycle it becomes nearly 100% shape memory material. The results of fifth and sixth cycles confirm this modification. These original results indicate that a polymer with partial shape memory may be transformed into an SMP without any chemical modification. This increase of SME could be related to the creation of residual stresses during the tensile tests. The residual stresses are the origin of the driving force responsible for SME.
Keywords: Polymers, shape memory effect (SME), partial shape memory effect (PSME), thermoplastic polyurethane, multi-cycle tensile test.
1. INTRODUCTION
Shape memory polymers (SMPs) are a type of polymeric smart materials that have the ability to return from a temporary shape (deformed state) to their original shape triggered by an external stimulus. SMP can be classified as chemical-responsive, light-responsive, and thermal-responsive and so on depending on the nature of external
2
stimulus [1]. It is generaly accepted that shape memory effect (SME) is related to the presence of two different hard and soft segments in the structure of polymers. The hard segment morphology stabilizes the permanent shape of the structure while the soft segment morphology allows the passage from permanent to temporary state or vice
versa [2-7]. Even though this explanation is correct, it cannot be the answer to all of the
questions related to the SME mechanism; it cannot illustrate the chemical and physical origin of SME. So our objective is to explain the mechanism of SME and to show the role of driving force during recovery.
In the case of cross-linked polymers (elastomers), the cross-linkage nodes and the chain segments are directly linked to the points may be considered as the hard zones of the morphology. These zones are responsible for the permanent state of the polymer because of their high stability [1, 8]. Moreover, there is no significant molecular motion in these zones. However, between the crosslinking points, the molecular chains are generally long, with more mobility. The zones far from cross-linking nodes may be considered as soft segments of the network.
In the case of blend, a mixture of at least two themoplastics polymers, one of the polymers (with higher glass transition temperature) may play the role of the hard segment and the other one that of the soft segment. In this case, the compatibility of these two polymers has a high influence on SME. In case of copolymers, SME can be observed in block copolymers synthesized by two monomers with different rigidities specially when one of them has aromatic structure; in this case, one would expect the formation of two different phases, hard and soft segments in structure of polymer. In the case of homopolymers (thermoplastics), SME can be found in some semi-crystalline polymers. Because in this case the amorphous phase (soft segment) and the crystalline phase (hard segment) form two distinct phases which may give the capcity of shape memory to polymer [9-12].
The shape memory effect is also observed in some polymer matrix composites. In this case the heterogenity and orientation of the fibre may induce this phenomena to the composite [13-18].
The brittle polymers also have shape memory effect because they show very low deformation at break under static loading and the failure of these polymers takes place in elastic deformation zone. However the poeple who work in this field are not
3
interested in investigating these type of polymer because of their limited industrial applications.
Partial shape memory effect is the properties of the polymers that can recover only a part of deformation imposed on them during mechanical loading [19]. This property is found practically in all the polymers. In fact the polymers may be devided in two categories: shape memory polymers and partial shape memory polymers.
In the present study we have used thermoplastic polyurethane having partial shape memory effect. We will demonstrate how the shape memory capacity of this polymer will be increased by multi-cycle tests.
The polurethanes are well known to have different interesting properties, besides shape memory effect [20-24] such as high resistance to organic solvent, stability against sunlight and oxydation, high elastic property, and possible biocompatibility. The preparation of these polymers are not very difficult [25].
2. EXPERIMENTAL
Material
The polymer used in this study is a thermoplastic polyurethane (TPU). The formulations of this polymer are based on 1,6-hexamethylene diisocyanate (HDI, Sigma Aldrich, France), polyethylene glycol (PEG 1000, VWR International, France) as macrodiol, propanediol (PDO, Sigma Aldrich, France) as petrochemical CE or Susterra® 1,3-propanediol (bio-PDO™, DuPont Tate & Lyle Bio Products, USA) as bio-based CE, which is a 100% renewably sourced material derived from corn sugar, in presence of dibutyl tin dilaurate (DBTDL, Fluka, France) as catalyst. Recently, this polymer has been developed as new polymer for reactive rotational moulding [26].
Segmented TPUs generally display several thermal transitions, corresponding to the soft and hard segments. So, the Soft segment could present a (low) glass transition temperature, and, if semi-crystalline, a melting transition, whereas the hard segment may display a glass transition and/or multiple melting transitions. In the present study, the glass transitions (Tg) and melting peaks (Tm) of SS and HS were determined using differential scanning calorimetry (DSC). First cooling and second heating curves were used to compare the thermal behavior of samples. Table 1 shows a summary of the results of the DSC thermograms for TPU-912 under study.
4
Table 1. Thermal properties of SS and HS domains of the investigated TPU-912 [26].
Sample
HS content
(wt%)
Soft segment domain Hard segment domain
Tg (°C) Tm (°C) Tc (°C) Hf Tg (°C) Tm (°C) Tc (°C) Hf TPU 912 35 -54 16 -3 105 89 128 98 109 Tc: Crystallization temperature
Hf: Enthalpy of fusion values are per gram of SS and HS, respectively
A typical SEM image corresponding to the segmented TPU is shown in figure 1. The TPUs developed in the present study exhibited a hetero-phase structure consisting of hard and soft segments.
Figure 1. SEM micrographs of fractured surface of bio-TPU 822, with two different magnifications
Methods
A shape memory cycle test consists of the following successive steps: tensile test, stress-relaxation test, fixing and recovery test. For reproducibility of the results, the shape memory tests have been carried out on at least three samples, each time.
5
i) Tensile test: Tensile tests have been carried out with the Instron 5881, loading cell of 1 kN, according to the standard NF ISO 6239. The strain rate is 5 mm/min. This machine is equipped with a temperature controlled thermo chamber for heating the samples and performing the tests at different temperatures. The tensile tests have been performed at 70°C and the dimensions of the samples were: length 75 mm, length of rectangular part 25 mm, width 4 mm, and thickness 1 mm.
ii) Stress–Relaxation test: This test has been performed at the end of the tensile test with the same machine. The strain has been taken constant (100 and 150 %) and the decrease of stress has been measured versus time up to 300min. This test has been performed to eliminate the residual stress induced during the tensile test in the samples. The stress-relaxation tests have been performed at 70°C.
iii) Fixing: By cooling the sample with a ventilator at the end of the stress-relaxation test (or tensile test) to room temperature (23°C) during 2 hours. The dimension of the sample, of the 100%, and/or 150% strain has been conserved in the sample.
iv) Recovery test: The recovery tests are carried out in a thermal chamber at 70°C and 90°C and must follow the changes in size (length) of the samples as a function of time. Due to the shape memory effect, the specimens regain a percentage of their initial shape. In multi-cycle shape memory tests successive shape memory tests on the same sample were conducted. After the first cycle (at the end of the recovery test) the sample has been used for a second cycle in order to do the same tests successively; that means tensile, fixing (with or without relaxation test) and recovery test. The cycle has been repeated several times.
3. RESULTS
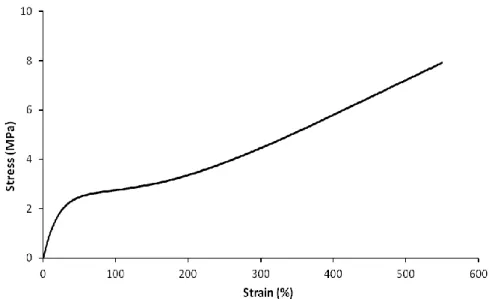
Tensile tests have been performed on the samples at 70°C (Figure 2). Unfortunately the test has been stopped before rupture of sample because of the limit of the height of the machine. However the result shows that the strain at break (at 70°C) is higher than 550%. It can be seen also a significant change of the slope of the curve from 150% of deformation perhaps because of molecular chains orientation.
6
Figure 2. Tensile tests of TPU-912 at 70°C.
Engineering and real stresses are plotted versus strain on figure 3. The samples are stretched up to 150% of deformation.
Figure 3. Engineering stress (1) and real stress (2) versus strain of thermoplastic
polyuretane at 70°C.
The results show two different linear deformation zones; elastic zone (almost 10%) and plastic zone (>50%) with a relatively wide transition zone between them. At 150% strain the value of engineering and real stresses are about respectively 3 MPa and 6.1 MPa.
The Stress-relaxation isothermal test has been performed at the end of the tensile test with the same machine. The strain has been taken constantly and the decrease of stress
7
has been measured versus time. This test has been performed to eliminate the residual stress induced during the tensile test in the samples. The stress-relaxation tests have been performed at 70°C (Figure 4).
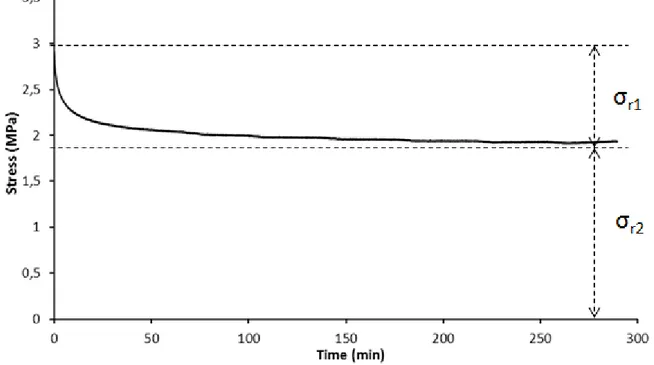
All stress-relaxation curves show two different regimes. At the beginning, the decrease of stress is relatively fast, and then it becomes slow. For example, at 70°C, the value of stress has been decreased from 2.9 MPa to 2.1 MPa after 15 minutes. Then, it decreased to 1.8 MPa after 300 minutes before reaching to a relatively stable level. It can be seen that the relaxation does not lead the sample to zero stress.
The rate of relaxation and the value of stress at the end of the test depend on the temperature. The rate of decrease of stress is more important when the temperature is higher.
Figure 4. Stress relaxation tests of TPU-912 at 70°C.
Fixing can be performed after tensile tests or after stress-relaxation tests. During this step, the sample obtains a temporary shape. By cooling the sample with ventilator to room temperature, the maximum deformation (100% and/or 150%) obtained at the end of tensile tests has been conserved in the sample.
The recovery tests are carried out in a thermal chamber at 90°C after fixing at 100% (or 150%) of deformation. The percentage of recovery has been determined using equation 1: 100 (%) 0 n n fn n L L L L R (1)
8
Where:
L0n is the iIinitial length at the beginig of cycle number n (mm)
Ln represents the length of sample after fixing test of cycle number n (mm)
Lfn is the length of sample after recovery test of cycle number n (mm)
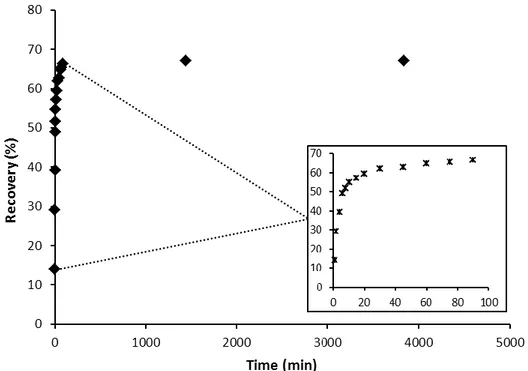
The results (Figure 5) show that the percentage of recovery is about 67% after 64hours. That means this polymer is not 100% shape memory polymer. It has partial shape memory effect. The recovery curve presents two different stages. In the first stage, the recovery rate is relatively high. During 10 minutes, the sample regains 55% of its initial shape. In the second stage, in order to regain 10% of its initial shape, the sample needs more 80 minutes.
Figure 5. Recovery test at 90°C
4. MULTI-CYCLE SHAPE MEMORY TESTS
Before performing the multi-cycle shape memory tests, the loading-unloading tensile tests have been realised on the samples at 23°C (room temperature) and 70°C.
The results (Figure 6) show in each case that the elastic part of deformation is very important.
9
Figure 6. Loading-Unloading tensile test at 23°C (a) and 70°C (b).
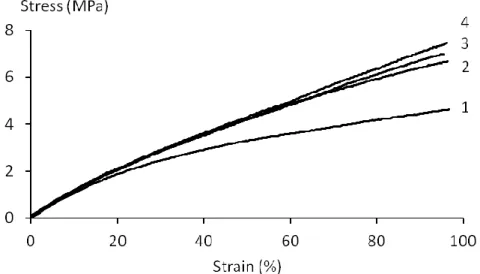
The multi-cycle tests have been performed on the same sample according to the procedure, explained before. At each cycle the sample has been stretched up to 100% before recovery tests. The results of the tensile tests (at 70°C) of the different cycles have been presented in figure 7 where real stress is plotted versus strain.
These tests have been repeated with at least two other samples; the same results have been obtained.
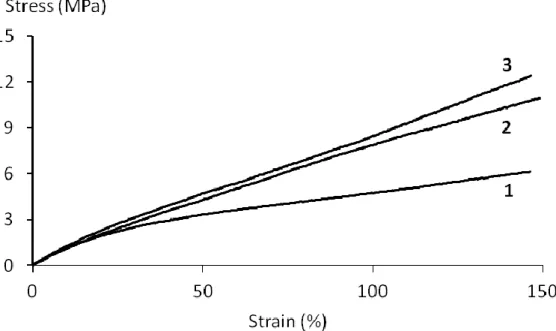
Figure 7. Real stress versus strain (tensile tests) at the beginning of each cycle of shape memory
tests.
The different cycles may be analysed as follows:
-Cycle 1 can be divided in to two zones with:
a. Elastic stage up to 10% of deformation and with a Young modulus of 10.83 MPa b. Wide transition zone from 10% to 50%
c. Plastic linear stage up to 100% of engineering strain. After recovery test, the sample regains 67.3% of its initial shape.
10
- Cycle 2 begins at the end of the first cycle and after the recovery test. This cycle is also divided into 2 linear stages.
a. Elastic zone with practically the same yield stress and yield strain as the first cycle.
b. Transition zone
c. Plastic zone up to 100% of deformation. After recovery test, the sample regains 80.5% of deformation.
-Cycle 3 begins at the end of the second cycle and after the recovery test. This cycle is also divided in 2 linear stages; linear elastic and plastic zones with a transition zone between them. At the end of this cycle, and after recovery test, the sample regains 93.7% of its shape of the beginning of this cycle.
-Cycle 4 begins at the end of the third cycle and after the recovery test. As in previous cycles, it is separated in to 2 different stages, elastic and plastic zone. After recovery test at the end of this cycle, the sample becomes practically a polymer with 100% shape memory effect.
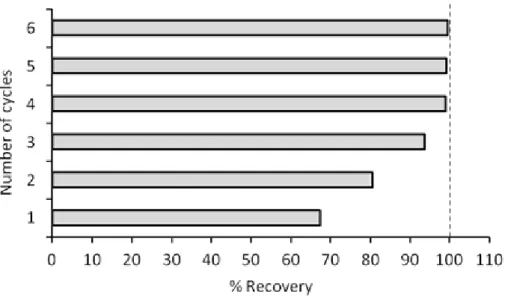
As we can see, TPU initially has a partial shape memory effect. At the end of each cycle this property improves and shape memory capacity of the polymer increases. After fourth cycle, it becomes a shape memory polymer (table 2 and figure 8).
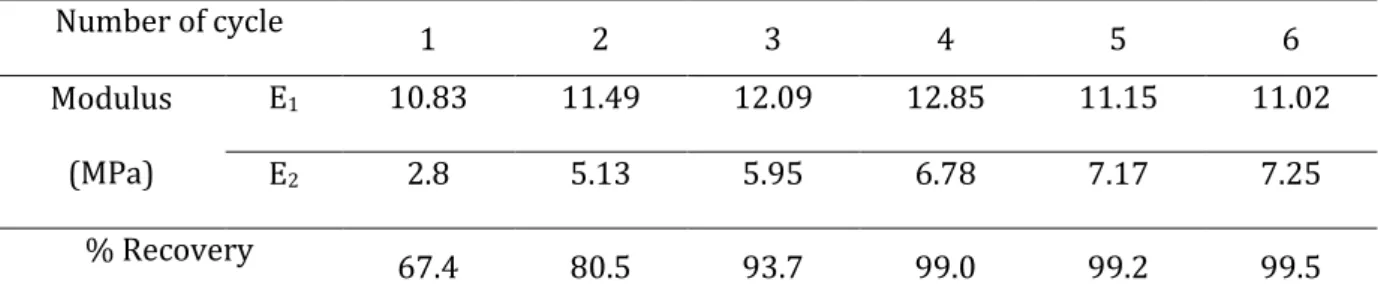
Table 2. Modulus and percentage of recovery at the end of each cycle.
Number of cycle 1 2 3 4 5 6 Modulus (MPa) E1 10.83 11.49 12.09 12.85 11.15 11.02 E2 2.8 5.13 5.95 6.78 7.17 7.25 % Recovery 67.4 80.5 93.7 99.0 99.2 99.5
11
Figure 8. Evolution of recovery capacity of TPU by number of cycle.
Table 2 presents also the evolution of modulus at end of each cycle. The modulus related to the elastic (E1) and plastic (E2) deformation zones have been reported in this table.
Figure 9 shows the relationship between modulus especially E2 and the rate of recovery.
Figure 9. Relationship between tensile modulus and recovery percentage related to the first
zone (E1) and the second zone (E2) of stress-strain curves (at 70°C) of different successive cycles
Multicycle tests, when the sample has been stretched up to 150% of deformation, give the same results (Figure 10).
12
Figure 10. Real stress versus real strain (tensile tests) at the beginning of each cycle of shape
memory tests on TPU samples.
5. ORIGIN OF THE RECOVERY/DRIVING FORCE
The driving force responsible for the shape memory effect may be the residual stress introduced in the sample during the tensile test.
In the case of polymers without shape memory, the deformation in the plastic zone is irreversible. Releasing the sample after deformation in the plastic zone, it will recover only the elastic portion of deformation. In this case if the test temperature is below the T and the polymer is in its glassy state, due to a low mobility, the elastic deformation
will be small and the sample remains relatively far from its original form. However, if the test temperature is above the T and especially when the polymer is in the rubbery state,
with a high molecular mobility, the elastic deformation may be very important and when the sample is released at the end of the tensile test, it can regain important part of its original shape.
In the case of shape memory polymers, after the tensile test (especially at higher deformation level) a stress will be introduced in the sample. One can distinguish two portions of residual stress:
The first portion, σr1, will be eliminated at the end of the relaxation test (Figure 4); but
the second portion of this residual stress σr2, remains in the structure of the sample. This
stress is the origin of shape memory effect. If the shape memory cycle test is performed without the relaxation test, as the value of residual stress is higher, the SMP regains its
13
initial form faster. In any case the SMP regains its initial shape with or without the relaxation test. The residual stress then can be considered as the driving force of a SMP for regaining the initial shape.
Here the question is how this residual stress is formed and why it is not completely eliminated after relaxation test. To answer this question it is necessary to see what happens in the morphology of this polymer during different cycles of shape memory tests:
- First, as it was explained in previous sections, the polymer under study is semi-crystalline thermoplastic polyurethane. With two different phases (Figure 1). Each of them shows a glass transition temperature (related to the amorphous phase) and a melting point (related to the crystalline phase). It is difficult to determine the degree of crystallinity of them but from the result of SEM observations, it can be supposed that the clear part of the picture (Figure 1-b) is the phase with less degree of crystallinity. So logically, this phase may be considered as soft segment, and the dark part as hard segment of the polymer. The PSME of this polymer may be related partially to the presence of these two phases with different degree of crystallinity that means with different mechanical properties.
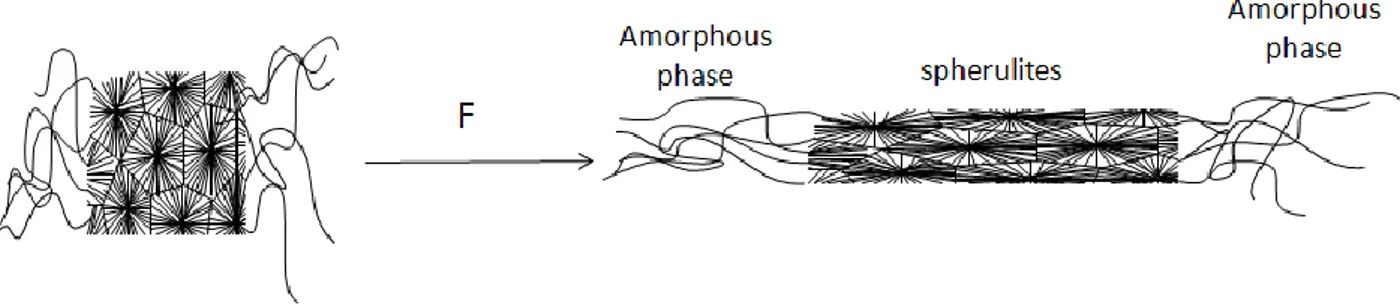
- In this study the deformation at each cycle of shape memory tests is relatively high (100%). Even this polymer shows a very high elastic deformation zone as the result of tensile test shows (Figure 2), at the end of each cycle of shape memory test, the molecular chains in amorphous phase and the spherulites in crystalline phase may be deformed and oriented partially (Figure 11).
Figure 11. Orientation of amorphous and crystalline phases during tensile test.
At this state of study, it is not so easy to say which part of residual stress will released after stress-relaxation test. It is also difficult to say how a part of residual stress is trapped in the polymer after this test. Perhaps the polymer doesn’t regain exactly its
14
original morphology form. But it is certain that this residual stress is the origin of the partial shape memory effect.
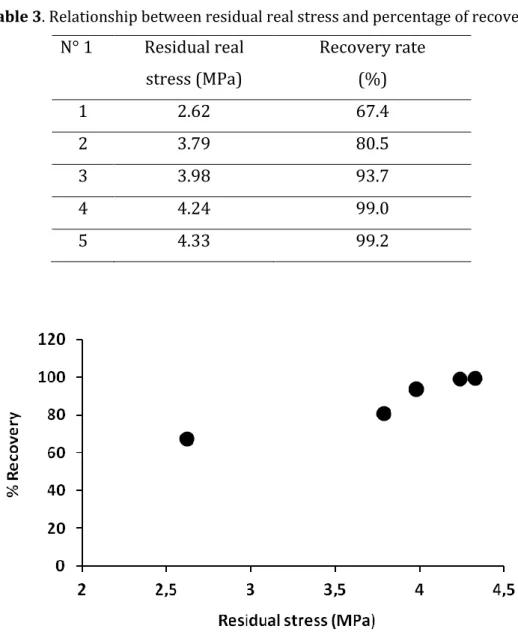
In order to show the role of this driving force, the residual stress is plotted versus percentage of recovery respectively in figure 12, using the values recapitulated in table 3. In this table the residual stress is measured at the end of fixing step (2 hours after tensile test at room temperature). The recovery rate is determined by using the equation 1.
Table 3. Relationship between residual real stress and percentage of recovery. N° 1 Residual real stress (MPa) Recovery rate (%) 1 2.62 67.4 2 3.79 80.5 3 3.98 93.7 4 4.24 99.0 5 4.33 99.2
15 6. PARTIAL SHAPE MEMORY EFFECT
As we have seen before, the thermoplastic polyurethane under study is not a 100% shape memory polymer. At the beginning, the polymer has a partial shape memory effect with a recovery rate of 67%. Figure 13 shows schematically the results of 6 successive cycles of shape memory tests. The numbers on this figure show the sample at different steps of a multi-cycles (6 cycles) shape memory test. As it can be seen, at the end of each cycle and at the beginning of next one, the sample is the same. This figure shows also that the recovery rate, obtained from equation 1, increases after each cycle; from 67% to 80.5% after the second cycle, 93.7% after the third cycle and reaches 99%, 99.2% and 99.5% after respectively fourth, fifth and sixth cycle.
The evolution of shape memory capacity of a polymer which is not originally an SMP can reinforce the following idea: A polymer with partial shape memory can be transformed into a 100% SMP by multi-cycle loading.
16 7. CONCLUSION
This study has focused on partial shape memory effect of thermoplastic polyurethane (TPU). The multi-cycle shape memory tests showed that the TPU regains only 67% of its initial shape at the end of the first cycle. These tests showed also the shape capacity of polymer increases by number of cycle. The same polymer after the second, third and fourth, fifth and sixth cycle regains respectively, 80.5%, 93.4%, 99%, 99.2% and 99.5% of its initial shape. This new concept of shape memory effect has very important value. We can in a legitimate way suppose that a polymer without shape memory effect can be transformed into a shape memory polymer. This study also demonstrate the driving force for the shape memory effect, is in fact the residual stress introduced in the sample during the tensile test. At the end of each cycle this residual stress increases and the driving force becomes more and more prominent.
17 REFERENCES
1. A. Lendlein and S. Kelch, Angewandte Chemie International Edition 41, 2034-2057 (2002).
2. D. Ratna and J. Karger-Kocsis, Journal of Materials Science 43, 254-269 (2008). 3. M. Behl and A. Lendlein, Materials today 10, 20-28 (2007).
4. M. Behl, J. Zotzmann and A. Lendlein, Shape-Memory Polymers and Shape-Changing
Polymers, in Shape-Memory Polymers, ed by A. Lendlein. Springer Berlin Heidelberg, pp.
1-40 (2010).
5. A. Lendlein and M. Behl, Advances in Science and Technology 54, 96-102 (2009). 6. J. Hu, Y. Zhu, H. Huang and J. Lu, Progress in Polymer Science 37, 1720-1763 (2012). 7. C. Liu, H. Qin and P. T. Mather, Journal of Materials Chemistry 17, 1543-1558 (2007). 8. C. Liu, S. B. Chun, P. T. Mather, L. Zheng, E. H. Haley and E. B. Coughlin, Macromolecules
35, 9868-9874 (2002).
9. H. Zhang, H. Wang, W. Zhong and Q. Du, Polymer 50, 1596-1601 (2009).
10. M. Harada, T. Ohya, K. Iida, H. Hayashi, K. Hirano and H. Fukuda, Journal of Applied
Polymer Science 106, 1813-1820 (2007).
11. A. Bhatia, R. Gupta, S. Bhattacharya and H. Choi, Korea-Australia Rheology Journal 19, 125-131 (2007).
12. G. Liu, X. Ding, Y. Cao, Z. Zheng and Y. Peng, Macromolecules 37, 2228-2232 (2004). 13. Q. Meng and J. Hu, Composites Part A: Applied Science and Manufacturing 40, 1661-1672 (2009).
14. Z. G. Wei, R. Sandstroröm and S. Miyazaki, Journal of Materials Science 33, 3743-3762 (1998).
15. K. Gall, M. L. Dunn, Y. Liu, D. Finch, M. Lake and N. A. Munshi, Acta Materialia 50, 5115-5126 (2002).
16. A. Golbang and M. Kokabi, European Polymer Journal 47, 1709-1719 (2011).
17. J. W. Cho, J. W. Kim, Y. C. Jung and N. S. Goo, Macromolecular Rapid Communications
26, 412-416 (2005).
18. J. G. Boyd and D. C. Lagoudas, Journal of intelligent material systems and structures 5, 333-346 (1994).
19. A. Tcharkhtchi, S. Abdallah-Elhirtsi, K. Ebrahimi, J. Fitoussi, M. Shirinbayan and S. Farzaneh, Polymers 6, 1144-1163 (2014).
18
20. S. Farzaneh, J. Fitoussi, A. Lucas, M. Bocquet and A. Tcharkhtchi, Journal of Applied
Polymer Science 128, 3240-3249 (2013).
21. H. Tobushi, S. Hayashi and S. Kojima, JSME international journal Ser 1, Solid
mechanics, strength of materials 35, 296-302 (1992).
22. T. Takahashi, N. Hayashi and S. Hayashi, Journal of Applied Polymer Science 60, 1061-1069 (1996).
23. F. Li, X. Zhang, J. Hou, M. Xu, X. Luo, D. Ma and B. K. Kim, Journal of Applied Polymer
Science 64, 1511-1516 (1997).
24. B. K. Kim, S. Y. Lee and M. Xu, Polymer 37, 5781-5793 (1996).
25. A. Tcharkhtchi, S. Farzaneh, S. Abdallah-Elhirtsi, B. Esmaeillou, F. Nony and A. Baron,
International Journal of Polymer Analysis and Characterization 19, 571-584 (2014).
26. B. J. Rashmi, D. Rusu, K. Prashantha, M. F. Lacrampe and P. Krawczak, Express
![Table 1. Thermal properties of SS and HS domains of the investigated TPU-912 [26].](https://thumb-eu.123doks.com/thumbv2/123doknet/7294516.208619/5.892.95.802.166.361/table-thermal-properties-ss-hs-domains-investigated-tpu.webp)