HAL Id: hal-01246179
https://hal.archives-ouvertes.fr/hal-01246179
Submitted on 5 Jan 2016HAL is a multi-disciplinary open access
archive for the deposit and dissemination of sci-entific research documents, whether they are pub-lished or not. The documents may come from teaching and research institutions in France or abroad, or from public or private research centers.
L’archive ouverte pluridisciplinaire HAL, est destinée au dépôt et à la diffusion de documents scientifiques de niveau recherche, publiés ou non, émanant des établissements d’enseignement et de recherche français ou étrangers, des laboratoires publics ou privés.
azimuth and elevation
Etienne Hendrickx, Mathieu Paquier, Vincent Koehl, Julian Palacino
To cite this version:
Etienne Hendrickx, Mathieu Paquier, Vincent Koehl, Julian Palacino. Ventriloquism effect with sound stimuli varying in both azimuth and elevation. Journal of the Acoustical Society of America, Acoustical Society of America, 2015, 138 (6), pp.3686-3697. �10.1121/1.4937758�. �hal-01246179�
Etienne Hendrickx a), Mathieu Paquier, Vincent Koehl and Julian Palacino
University of Brest, CNRS, Lab-STICC UMR 6285 6, avenue Victor Le Gorgeu,
CS 93837 29238 Brest Cedex 3, France
When presented with a spatially discordant auditory-visual stimulus, subjects some-times perceive the sound and the visual stimuli as coming from the same location. Such a phenomenon is often referred to as perceptual fusion or ventriloquism, as it evokes the illu-sion created by a ventriloquist when his voice seems to emanate from his puppet rather than from his mouth. While this effect has been extensively examined in the horizontal plane and to a lesser extent in distance, few psychoacoustic studies have focused on elevation. In the present experiment, sequences of a man talking were presented to subjects. His voice could be reproduced on different loudspeakers, which created disparities in both azimuth and elevation between the sound and the visual stimuli. For each presentation, subjects had to indicate whether the voice seemed to emanate from the mouth of the actor or not. Results showed that ventriloquism could be observed with larger audiovisual disparities in elevation than in azimuth.
I. STATE OF THE ART
The effect of a spatial disparity between related sound and visual stimuli can be studied in two ways (Bertelson and Radeau, 1981), either through a localization task, which makes it possible to observe cross-modal biases, or a discordance-detection task, which makes it possible to observe ventriloquism (or perceptual fusion).
A. Cross-modal bias
In a localization task, subjects report the direction of the sound stimulus. Significant shifts in localization towards the visual stimulus were found in many studies (Alais and Burr, 2004; Battaglia et al., 2003; Bertelson and Aschersleben, 1998; Bertelson and Radeau, 1981; Hairston et al., 2003; Wallace et al., 2004; Bermant and Welch, 1976; Pick et al., 1969; Radeau, 1974; Radeau and Bertelson, 1976; Warren, 1979; Weerts and
Thurlow, 1971). For example, with a 7◦ difference between audio and visual stimuli in the
horizontal plane, Bertelson and Radeau (1981) observed that the localization of the sound
stimulus by the subjects was shifted 4◦ towards the visual stimulus. They also observed a
deviation in sound localization of approximately 6.3◦ for a 15◦ difference between audio
and visual stimuli, and observed a deviation of 8.2◦ for a difference of 25◦. Such a
phenomenon is called cross-modal bias.
that the sensory modality with the greater precision for the discrimination to be made will dominate the percept with respect to that discrimination. Thus, the visual stimulus
influences the percept of the spatial location of the sound stimulus because the visual system spatial precision is in the range of a minute arc (1/60 of a degree) (Cavonius and
Robbins, 1973), while the auditory system precision is equal to or greater than 5◦
(Recanzone et al., 1998) depending on stimulus spectrum and intensity.
In accordance with the modality specificity hypothesis, a predictive model based on maximum-likelihood estimate was successfully used in several studies to estimate the bimodal perception, relying on the precision of the auditory and visual spatial information in unimodal condition (Ernst and Banks, 2002; Alais and Burr, 2004). If a visual stimulus
is perceived at a position mV with variance σV2, and a sound stimulus at a position mA
with variance σ2
A, then the model predicts that an audiovisual stimulus will be perceived at
a position mAV so that: mAV = σV2 σ2 V + σA2 mA+ σA2 σ2 V + σ2A mV
Thus, the influence of each modality on the localization of the audiovisual stimulus is weighted in proportion to the precision of the modalities in the unimodal condition.
the weighting associated with mA increases: thus the audiovisual stimulus is perceived
increasingly close to the sound stimulus. The model therefore suggests that situations might arise where the sound stimulus captures the visual stimulus if the visual stimulus is less salient. This ”reverse” ventriloquism was observed by Alais et al. (2004). Subjects were required to localize brief light “blobs” or sound “clicks”. Light ”blobs” could be more or less blurred. With the sharp “blobs”, visual localization was good and vision indeed dominated and captured sound. Yet, with the severely blurred ”blobs”, visual localization was poor and sound captured vision. For less blurred visual stimuli, neither sense
dominated and perception followed the mean position between the sound stimulus and the visual stimulus.
On the other hand, if the auditory precision decreases, the visual system will dominate the percept of the spatial location of a sound stimulus even more.
B. Perceptual Fusion or Ventriloquism
In a discordance-detection task, subjects report whether or not they experience perceptual fusion (the so-called ventriloquism effect) of the visual stimulus with the related sound stimulus (Jack and Thurlow, 1973; Radeau and Bertelson, 1977; Thurlow and Jack, 1973), or, in a different version, whether they perceive the visual and sound stimuli as
coming from the same or from different location (Choe et al., 1975; Andr´e et al., 2014;
subjects by reporting the 50%-threshold (the angular difference between related visual and sound stimuli for which subjects still experience fusion - or still perceive the visual and sound stimuli as coming from the same location - half of the time). In some studies, subjects are instead asked to use the ITU-R 5-grade impairment scale (ITU-R BS.1284-1, 2003) to quantify to what extent the disparity is perceptible and annoying (Komiyama, 1989; Bruijn and Boone, 2002; Melchior et al., 2003, 2006; Mannerheim, 2011). As shown in Table 1, grades are associated with specific subjective impressions, and experimenters usually report either the threshold for a “perceptible, but not annoying” angular difference (Mannerheim, 2011) or the threshold for a “slightly annoying” angular difference (Melchior et al., 2003, 2006). Komiyama (1989) also defines the “acceptable limit of discrepancy” as the midpoint between “perceptible, but not annoying” and “slightly annoying” angular differences.
Impairment Grade
Imperceptible 5.0
Perceptible, but not annoying 4.0
Slightly annoying 3.0
Annoying 2.0
Very annoying 1.0
Ventriloquism (observed in discordance-detection tasks) and cross-modal bias (observed in localization tasks) are two different phenomena. The relationship between them was studied by Bertelson and Radeau (1981) and Wallace et al. (2004), who carried out a localization and a discordance-detection task at the same time, using 50-msec pulses of either 300 Hz pure tones or broadband noise combined with LED lamps. Both studies found that biases of auditory localization towards the visual stimulus could occur even when fusion was not reported, and that biases were larger when fusion was reported.
C. Previous studies on ventriloquism in azimuth bring out several influencing factors
Numerous studies have investigated ventriloquism in azimuth (Lewald et al., 2001;
Komiyama, 1989; Andr´e et al., 2014; Wallace et al., 2004; Jackson, 1953; Thurlow and
Jack, 1973; Warren et al., 1981; Bertelson and Radeau, 1981; Melchior et al., 2003;
Mannerheim, 2011), and all came to the conclusion that the effect decreases with increasing angular difference between the positions of the sound and visual stimuli. Even so, the
range of thresholds reported by those studies is wide: from 3◦ (Lewald et al., 2001) to 20◦
(Komiyama, 1989). These differences can be explained by several factors: the experience of subjects, the audiovisual temporal disparity, the “compellingness” factor, and attention.
In Koimyama’s study (1989), subjects had to use the ITU-R 5-grade impairment scale to quantify to what extent the disparity between the mouth of a TV speaker and his voice was perceptible and annoying. With expert subjects, the acceptable limit of the
discrepancy was 11◦ while it was 20◦ with na¨ıve subjects. A comparison of previous studies
also shows that the obtained thresholds are usually low with trained subjets (5 − 7◦ in
Melchior et al. (2003), 4 − 8◦ in Melchior et al. (2006), 6 − 8◦ in Mannerheim (2011)) while
they are always greater than 10◦ with na¨ıve subjects (20◦ in Komiyama (1989), 18.3◦ in
Andr´e et al. (2014), > 10◦ in Wallace et al. (2004)).
Temporal Disparity
Increasing temporal disparities between sound and image can also decrease the obtained thresholds. Using a 50-ms broadband noise burst followed by a 50-ms
illumination of a LED lamp, Wallace measured a 50%-threshold greater than 15◦ when the
delay was 200ms. However, the 50%-threshold was reduced to about 10◦ when the delay
was 800 ms (Wallace et al., 2004). Compellingness
Ventriloquism also depends on higher level factors, such as whether or not the participant assumes that the stimuli should “go together” (Vatakis and Spence, 2007). Indeed, several studies showed that if the combinations of audiovisual stimuli are perceived as being more meaningful and “compelling”, observers will be more likely to treat them as
referring to a single audiovisual event (Jackson, 1953; Welch and Warren, 1980), and therefore to assume that they have a common spatial origin.
For example, Jackson (1953) conducted two experiments: in one, the visual stimulus was a puff of steam from a kettle whistle and the sound stimulus was a whistling sound, while in the other, the situation was much more abstract as it consisted of sounds of bells
associated with lights. When the disparity between sound and image was equal to 30◦, the
whistling sound was still located at the kettle releasing the steam in 97% of the trials, while the sound of bell was located at the light in only 43% of the trials when the disparity
between sound and image was equal to 22.5◦.
In one of Thurlow’s experiments (1973), a TV monitor was placed in front of the
subject, and a loudspeaker was hidden 20◦ to the left of the TV monitor. Visual stimuli
could either be a speaker reading texts, or a cross in the middle of a circle drawn on a sheet of white paper (the paper was fastened to the front of the TV monitor, with the circle approximating the location of the mouth). In both conditions, the sound stimulus was the voice of the speaker. Subjects were asked to look directly at the mouth of the speaker on the TV screen (or the cross in the middle of the circle) and to turn a stopwatch on
whenever they heard speech coming from the direction of the visual stimulus and to turn it off when they did not (the stimulus was 5 minutes long). The average duration during which speech was heard coming from the visual stimulus was 3 minutes and 22 seconds
with the TV speaker and this was reduced to 51 seconds with the cross.
In Warren et al. (1981), the dynamic face of a speaker or a static visual stimulus (consisting of a 1 × 2 cm piece of tape placed at the location on the screen where the speaker’s mouth would have been) was presented, together with an auditory speech signal with various degrees of spatial discrepancy. Fusion was observed for larger angles with the
dynamic face than with the simple static visual spot (from 4.6◦ to 3.2◦), because, according
to Warren et al., the combination of the speaker’s face and the matching voice was more compelling than the visual spot with a speech signal.
Thus, 50%-thresholds will be greater with realistic sequences such as speech sequences than with arbitrary and non-meaningful combinations of stimuli, such as flashing lights and brief tones.
Attention
Several studies having conducted both discordance-detection and localization tasks suggest that focusing the attention on the spatial location of the sound stimulus makes subjects much more discriminating and thus decreases 50%-thresholds substantially. Indeed, many subjects reported noticing discrepancies only when they had to localize sound (Radeau, 1974; Radeau and Bertelson, 1976) or when they were warned that they might be questioned about the respective origins of the sound and the visual stimuli (Bertelson and Radeau, 1981). Bertelson hypothesized that humans tend to ignore the
spatial origin of auditory data to the advantage of visual data unless the task forces
attention towards it. Thurlow and Jack (1973) also recommend using discordance-detection tasks instead of localization tasks, as it brings the subjects closer to an everyday life
situation and prevents them from becoming excessively discriminating.
However, when Komiyama (1989) conducted his discordance-detection task, subjects reported that they would probably not have detected audiovisual discrepancies if they had not been asked to judge them. It suggests that even a discordance-detection task may make subjects too discriminating compared with an everyday life situation.
D. Ventriloquism in elevation
Ventriloquism has been extensively examined in the horizontal plane, and to a lesser extent in distance (Gardner, 1968; Mershon et al., 1980; Agganis et al., 2010; Zahorik,
2003; Hl´adek et al., 2013; Bowen et al., 2011). On the other hand, few studies have
explored elevation (Thurlow and Jack, 1973; Werner et al., 2013).
It has been shown previously that cross-modal biases of auditory localization towards the visual stimulus become larger as the auditory precision decreases. As localization performance is poorer in the vertical plane than in the horizontal plane when stimuli are located on or near the frontal midline, one would expect to observe larger biases in elevation than in azimuth. Indeed, when Makous and Middlebrooks (1990) asked subjects to localize broadband stimuli that could vary in both dimensions, the intra-subject variability of
responses (i.e. the standard deviation of responses about the mean response location) in the vertical dimension could be as great as 2.5 times that in the horizontal dimension.
If larger biases are obtained in elevation than in azimuth, then, according to
Bertelson’s (1981) and Wallace’s (2004) comparative studies between cross-modal bias and ventriloquism, ventriloquism should be observed with larger audiovisual disparities in elevation than in azimuth.
In one of Thurlow’s experiments (1973), a TV monitor was placed on the floor, so
that the mouth of the speaker on the TV screen was close to 40◦ below subjects’ ear level.
A hidden loudspeaker was positioned at an angle of 15◦ above subjects’ ear level. Thus, the
total angle between TV speaker and loudspeaker was 55◦. The average duration that
speech was heard coming from the TV speaker was about 4 out of 5 minutes. The duration was reduced to 1 minute and 42 seconds when the TV speaker was replaced by the
uncompelling cross drawn on a sheet of paper.
In another experiment, the hidden loudspeaker was behind the subjects, at 10◦ above
their ear level, and the TV speaker was in front of the subjects at an angle of 25◦ below ear
level. The total elevation difference between TV speaker and hidden loudspeaker was
therefore 195◦. The average duration during which speech was heard coming from the TV
speaker was about 3 minutes and 20 seconds, that is still two-third of the total duration of the stimulus. The average duration was reduced to 74 seconds with the uncompelling cross.
When Thurlow conducted the experiment with a hidden loudspeaker 60◦ to the right
of the center of the TV screen (no difference in elevation), however, the average duration that speech was heard coming from the TV speaker was only 52 seconds, that is four times shorter than in the condition with a loudspeaker behind the subjects in spite of the fact
that the angular difference between sound and image was reduced from 195◦ to 60◦.
Thus, Thurlow’s experiments support both the hypothesis that ventriloquism can be observed with larger audiovisual discrepancies in elevation than in azimuth, and the hypothesis that ventriloquism in elevation depends on the compellingness of the combinations of sound and visual stimuli.
In Werner’s study (2013), the sound stimulus was either a 30-ms white noise burst or a 6-s anechoic recording of a saxophone, which could be reproduced via either of two virtual loudspeakers reproduced through headphones (using individualised binaural reproductions including acoustic room information). One of the loudspeakers was right in
front of the subject (0◦ azimuth, 0◦ elevation) while the other one was at 25◦ above ear
level. The visual stimuli were white LEDs positioned in front of the subject (0◦ azimuth)
along a segment of circle centered at the subject’s head, from 10◦ below ear level to 35◦
above ear level. For each presentation, subjects had to report whether they perceived the audio stimulus below, in-plane, or above the visual stimulus. Note that in this experiment, the sound stimulus was fixed while the visual stimulus was shifted. The estimated
50%-threshold was 8◦ for the loudspeaker at 0◦ elevation, whether the visual stimulus was
shifted below or above the loudspeaker. For the second loudspeaker, the 50%-threshold was
10◦ when the visual stimulus was shifted below and greater than 10◦ when the visual
stimulus was shifted above.
Werner concluded that the measured ventriloquism effect had similar magnitudes for elevated stimulus positions as it has in the horizontal plane. Yet, because Werner did not conduct his experiment in azimuth, this assumption is based on comparison with previous studies, whose experimental conditions were different. As ventriloquism is highly
dependent on experimental conditions (see I.C), one cannot know whether the obtained similarities of thresholds does not actually result from different test designs.
In Werner’s study, many factors may have favored the collection of low 50%-thresholds:
• Subjects were well experienced with listening tests and had been trained. It has been shown that thresholds obtained with experts could be half that obtained with
non-expert subjects (Komiyama, 1989);
• Sound and image were presented synchronously;
• The combinations of stimuli were not compelling, as they consisted of 30-ms white noise bursts combined with white LEDs. A recording of saxophone was also used,
which can seem more realistic. Yet the recording was still associated with the white LEDS, so the combination of sound and image was probably no more compelling in this case;
• The sound stimulus was fixed (at either 0◦ or 25◦ elevation). Subjects may therefore
have learnt where the loudspeakers were located precisely, which made them more accurate when comparing with the position of the visual stimulus.
Had Werner’s experiment been conducted in azimuth in the same conditions, thresholds could have been much lower. The results may therefore underestimate the strength of ventriloquism in elevation compared with in azimuth.
E. Summary and aim of the present study
Numerous studies in azimuth have revealed several factors influencing ventriloquism: the spatial disparity (the effect decreases with increasing angular difference), the temporal disparity (the effect is stronger if the sound and visual stimuli are synchronous), the experience of subjects (experts are more discriminating than na¨ıve subjects) and the “compellingness” factor (the effect is stronger if the combination of the sound and visual stimuli is more realistic).
It has also been shown that ventriloquism is dependent on the auditory system spatial precision (the effect is stronger as the auditory precision decreases). As localization
performance is poorer in the vertical plane than in the horizontal plane, 50%-thresholds are expected to be greater in elevation than in azimuth.
Thurlow’s studies seem to support this hypothesis, although he did not measure 50%-thresholds so his results cannot be compared with the literature. On the other hand, Werner did measure 50%-thresholds in the median plane that had similar magnitudes as in previous studies in the horizontal plane. However, this similarity may be rather due to the specificity of his experimental conditions, and only a comparison with 50%-thresholds in azimuth obtained in the same experimental conditions would be truly legitimate.
Several studies also suggest that ventriloquism will be more likely to occur if subjects pay less attention to the spatial location of the sound stimulus. For example, in a real life speech situation, the attention would rather be focused on the semantic content, which may severely reduce subjects’ attention to sound localization.
The aim of the present study is to compare ventriloquism in azimuth and in elevation in realistic conditions. It is hypothesized that:
• 50%-thresholds are greater in elevation than in azimuth. Thus, 50%-thresholds were measured for sound stimuli varying in both azimuth and elevation, so that
ventriloquism in both dimensions could be compared directly;
• 50%-thresholds can be greater than in Werner’s study if the experiment is conducted in conditions that more closely resemble our everyday experience: compelling
combinations of stimuli (speech sequences), na¨ıve subjects instead of trained experts and focus of attention on the semantic content of the stimuli.
II. EXPERIMENTAL SETUP
A. Stimuli
The program material was the screening of a speaker sitting on a chair on a black background, pronouncing 5-second sentences. The sequences were shot in stereoscopic-3D using a Panasonic AG-3DP1 camera and projected in real size. The choice of stereoscopy was motivated by Ijsselsteijn’s findings that stereoscopy increases the sense of presence (Ijsselsteijn et al., 2001). It was therefore hypothesized that subjects in the present experiment would assume more easily that the voice and the mouth of the speaker had a common spatial origin if their subjective sensation of “being there” with the speaker was stronger.
The phrases used in the experiment were inspired by the speech corpus used in studies on speech-on-speech masking (Martin et al., 2012). The stimuli consisted of one sentence,
in French, following the format “Je m’appelle {nom}, ma couleur pr´ef´er´ee est le {couleur}
et j’habite `a {ville}” (“My name is {name}, my favorite color is {color} and I live in
{city}”). There were three possible names (Antoine, Cl´ement, Pierre), three possible colors (Red, Green, Blue) and three possible cities (Bordeaux, Lyon, Marseille). With all possible
combinations of names, colors and cities, the sentence could therefore take twenty-seven different forms. The stimuli were recorded in a sound-attenuated room following Bolia’s recommendations (2000), with a DPA 4006 microphone connected to a RME Fireface 800. The microphone was placed 22 cm above the mouth of the speaker so that it would not be in the frame of the camera.
B. Reproduction Setup
The test took place in a sound-attenuated room of dimensions 5.10×4.40×3.30 m at the University of Brest. The lights were turned off in order to minimize the influence of any visual stimuli. The subject sat at the center of the room. Head position was fixed by a chin clamp.
The image was displayed by an Epson EH-TW6000 projector on an acoustically transparent screen, with Epson ELPGS01 3D active glasses. The width and the height of the screen were 130 cm and 73 cm respectively. Playback, commands and data capture were controlled by a software implemented in Max/MSP on a MacBook Pro computer connected to a RME MADIface USB.
The system was composed of twenty-eight Amadeus PMX4 loudspeakers fed by a D.O.Tec Andiamo 2.DA MADI to analog converter through Audac DPA154 amplifiers. Each loudspeaker was digitally filtered to compensate for the transfer characteristics of the
presentation system. For each presentation, the voice of the speaker was randomly reproduced by one of the loudspeakers at a sound level of about 65 dB (A-weighted). C. Placement of Loudspeakers
Several studies have obtained left-right symmetry for the ventriloquism effect (Werner et al., 2013; Wallace et al., 2004) and it was therefore decided to set all the sound stimuli to the right of the visual stimulus.
In the median plane, however, Werner’s results (2013) suggest an imbalance between positive and negative discrepancies (the obtained 50%-thresholds are likely to be different whether the sound stimulus is shifted above or below the visual stimulus). Nonetheless, only positive elevations (sound stimuli shifted upwards) were studied in order to keep the test within a reasonable duration.
A two-dimensional double pole spherical coordinate system (with θ and φ defined as azimuth and elevation respectively) was used to describe positions of loudspeakers and 50%-thresholds on a 2.40-m sphere centered at the subject’s head. Note that this coordinate system differs in its definition of azimuth from the single-pole system that is sometimes used (see Knudsen and Konishi (1979) and Middlebrooks et al. (1989) for a discussed comparison between the two systems).
the mouth of the speaker corresponded to 0◦ azimuth, 0◦ elevation, at a distance of 2.40 m.
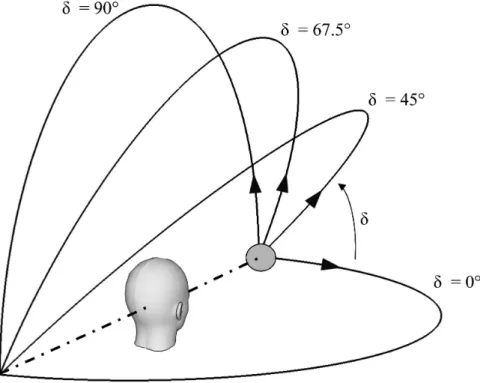
The sound stimulus could be shifted from the visual stimulus along several circle arcs that were also centered at the subject’s head, and whose angle at the visual stimulus with the arc subtending azimuth was noted δ and defined as orientation. In order to keep the
test within a reasonable duration, four values were chosen for δ: 0◦ (shifting to the right),
45◦ (in diagonal), 67.5◦ and 90◦ (upwards). The four δ-orientations are presented in Fig. 1.
Figure 1: The four δ-orientations along which the sound stimulus could be shifted from the visual stimulus. The orientations were centered at the subject’s head. The visual stimulus
For each δ-orientation:
• A fusion report refers to a situation where a subject indicates that he perceives the voice and the mouth of the speaker as coming from the same direction;
• The angular difference Ψ is defined as the angle at the subject’s head between the visual stimulus (the mouth of the speaker projected right in front of the subject) and the sound stimulus (the voice of the speaker);
• The 50%-threshold Ψ50% is defined as the value of Ψ for which the percentage of
fusion reports is equal to 50% (that is the angular difference Ψ for which the voice of the speaker is perceived as coming from the direction of the mouth half of the time);
• The 50%-threshold Ψ50% can be broken down into the corresponding azimuth and
elevation differences between sound and image: The 50%-threshold azimuth θ50% and
the 50%-threshold elevation φ50%.
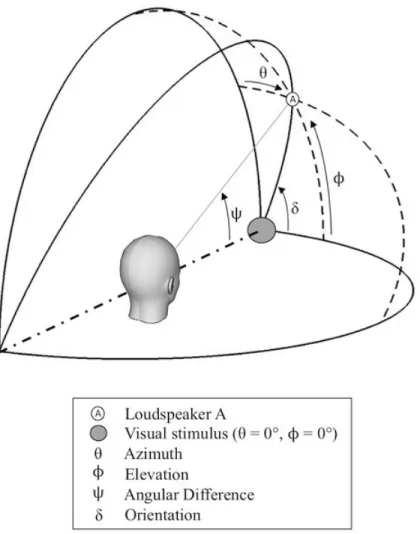
Fig. 2 gives the example of a loudspeaker A positioned along the δ-orientation 67.5◦,
with an angular difference of Ψ = 36◦.
Polar coordinates can be calculated from δ and Ψ using the following formulae:
Figure 2: Example of a loudspeaker A with orientation δ = 67.5◦ and angular difference
Ψ = 36◦.
Elevation : φA = arcsin(sin Ψ × sin δ) = arcsin(sin 36◦ × sin 67.5◦) ≈ 32.9◦
The aim of the experiment was to define the 50%-threshold Ψ50% for each
δ-orientation. By placing loudspeakers along each of the four δ-orientations (seven
50%-thresholds and slopes (gradient of the psychometric function at the 50%-point) were then calculated.
Let us suppose that Ψ50% = 32◦ for the δ-orientation 67.5◦. Ψ50% can be broken down
into the corresponding azimuth and elevation differences:
θ50% = arcsin(sin 32◦ × cos 67.5◦) ≈ 11.7◦
φ50% = arcsin(sin 32◦× sin 67.5◦) ≈ 29.3◦
This means that if a loudspeaker is positioned at azimuth θ = 11.7◦ and elevation φ =
29.3◦, fusion will occur 50% of the times when the sound stimulus is reproduced via that
loudspeaker.
The values for δ were determined on the basis of an informal test conducted by the
four experimenters, which suggested that the 50%-threshold Ψ50% varies moderately from
orientations 0◦ to 45◦ and more substantially from orientations 45◦ to 90◦.
Note that maintaining the loudspeaker locations at constant angles of orientation means that azimuth and elevation variations are constrained as the angular difference Ψ increases along one of the δ-orientations:
• When δ = 45◦, azimuth and elevation vary similarly as Ψ increases;
• When δ = 67.5◦, elevation increases faster than azimuth as Ψ increases;
• When δ = 90◦, there is no variation in azimuth as Ψ increases (median plane).
A pilot informal test with six subjects was conducted in order to gain an idea about the general shape of the psychometric functions, from which optimal loudspeaker
placement and spacing along each orientation were determined on the basis of
recommendations by Lam (1999) and Levitt (1971). Levitt, for example, stated that a typical “rule of thumb” is for the experimenter to place the observations so as to roughly
cover the range of expected X10 to X90, where X10 and X90 are the stimulus levels
corresponding in the present study to 10% and 90% of fusion reports.
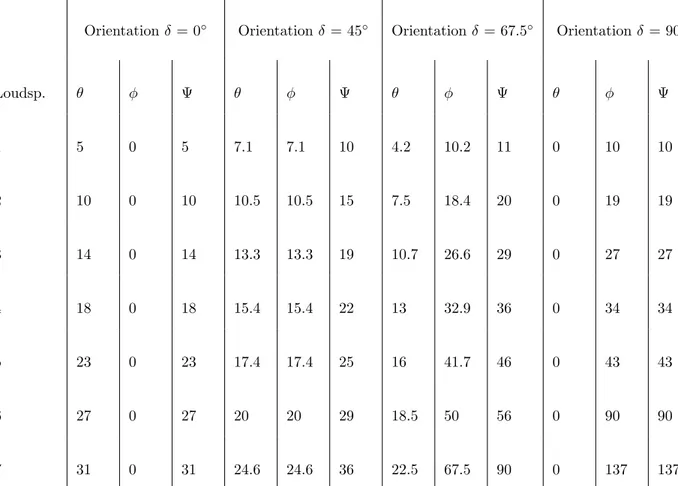
Loudspeaker locations used in the experiment are presented in Table 2. Note that the
seventh loudspeaker of the δ-orientation 90◦ had an angular difference Ψ of 137◦, which
means it was behind the subjects.
Because of the screen and room configuration, the loudspeakers could not always be placed at an exact distance of 2.40 m from the subject. The maximum distance error was
16% (the loudspeaker right above the subjects, at φ = 90◦), which falls within the distance
Orientation δ = 0◦ Orientation δ = 45◦ Orientation δ = 67.5◦ Orientation δ = 90◦ Loudsp. θ φ Ψ θ φ Ψ θ φ Ψ θ φ Ψ 1 5 0 5 7.1 7.1 10 4.2 10.2 11 0 10 10 2 10 0 10 10.5 10.5 15 7.5 18.4 20 0 19 19 3 14 0 14 13.3 13.3 19 10.7 26.6 29 0 27 27 4 18 0 18 15.4 15.4 22 13 32.9 36 0 34 34 5 23 0 23 17.4 17.4 25 16 41.7 46 0 43 43 6 27 0 27 20 20 29 18.5 50 56 0 90 90 7 31 0 31 24.6 24.6 36 22.5 67.5 90 0 137 137
Table 2: Loudspeaker locations, with associated azimuth θ, elevation φ and angular difference Ψ, for the four δ-orientations.
control condition in which intensity was held constant over varying distance. The impact on subjects’ answers was, therefore, expected to be negligible.
D. Subjects and Protocol
Eight na¨ıve subjects took part in the experiment (four men and four women, aged 19 to 40 years old). They were financially compensated for their participation, and none of
them had particular experience in laboratory listening tests.
A first test (task A ”without semantic question”) was carried out in which, after each presentation, subjects had to answer the question: “Do the voice and the mouth of the actor come from the same direction?”. Once they had given their answer, the next stimulus was automatically played.
An additional test was carried out with questions on the semantic content of the sequences (task B “with semantic questions”): after each presentation, subjects had to report the name, the favorite color and the living place of the speaker before giving their answer to the question on audiovisual coherence. In case of wrong answers, the trial was repeated a bit later.
As recommended by Lam et al. (1999), subjects went through thirty trials per
loudspeaker for each task. The loudspeakers were presented in a randomized order (so as to appear as unrelated sound stimuli from multiple locations and orientations), with a
different randomization for each subject. For each trial, a stimulus was randomly chosen out of the twenty-seven possible combinations of names, colours and cities. Each task was divided into two sessions of one hour each and all the subjects completed the two tasks on four different days. Subjects A, B, C and D started with task A while subjects E, F, G and H started with task B.
III. RESULTS
To estimate the psychometric functions, a nonparametric approach was used based on local linear fitting. This method has the benefit of making no assumptions about the true model underlying the data (except its smoothness) while providing better or equal
performances compared with common parametric models (Zchaluk and Foster, 2009). For task B, it was decided to remove from data the trials on which subjects answered some semantic questions incorrectly, as the error rate was very low (less than 1% for each subject).
A. Influence of the δ-orientation
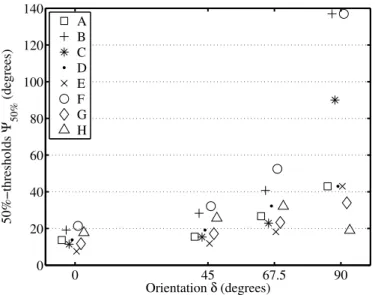
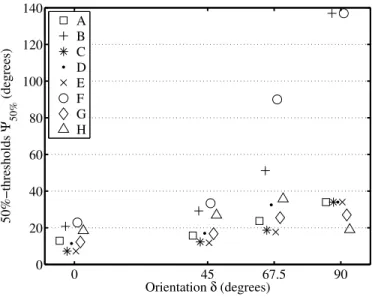
Fig. 3 presents the 50%-threshold Ψ50% as a function of the δ-orientation for each
subject during task A (without semantic questions). Ψ50% could not always be determined
at δ = 90◦: for subjects B and F, the percentage of fusion reports was greater than 50% for
any loudspeaker of the orientation (fusion reports still occurred 85% and 77% of the time
respectively when the angular difference Ψ was at its maximum value 137◦). The value
137◦ was chosen for the graph, but fusion might still have occurred more than half of the
time for greater angles, maybe even for the whole median plane.
Fig. 4 (results of subject C at δ = 90◦) shows another example where the
0 45 67.5 90 0 20 40 60 80 100 120 140 Orientation δ (degrees) 50%−thresholds Ψ 50% (degrees) A B C D E F G H
Figure 3: 50%-thresholds Ψ50% for each subject as a function of the δ-orientation. Task A.
function was close to horizontal at the 50%-point, there was very little precision in the
Ψ50% estimate (the confidence interval was [40.6; 107.3]).
It was therefore decided not to use the 50%-thresholds for data obtained at δ = 90◦,
but rather to indicate the maximum value of angular difference Ψ for which fusion had been observed to occur more than half of the time. In the case of subject C, the value
Ψ = 90◦, corresponding to the sixth loudspeaker of the δ-orientation 90◦ was reported. As
the psychometric functions were monotonically decreasing for all subjects in this condition, 50%-thresholds are likely to be at values greater than those indicated.
In Fig. 3, 50%-thresholds are already spread out at orientation δ = 0◦, ranging from
0 20 40 60 80 100 120 140 0 10 20 30 40 50 60 70 80 90 100
Angular difference Ψ (degrees)
Fusion reports (%)
Figure 4: Psychometric function at δ = 90◦ for subject C, task A. Points represent data
obtained for each loudspeaker.
times greater than other subjects. As δ-orientation increases from 0◦ to 45◦, all subjects
show a fairly consistent trend, with a moderate increase in 50%-thresholds (mean = +6◦).
As δ-orientation increases from 45◦ to 67.5◦, 50%-thresholds increase faster for all subjects
(mean = +10◦, which means that the mean increase is almost twice as much as from δ = 0◦
to δ = 45◦, though the difference in orientation is halved). Nonetheless, the rate of this
increase varies greatly from one subject to another: for example, the increase is +20◦ for
subject F whereas it is only +6◦ for subjects G. These different rates widen inter-subject
53◦ respectively) than the other subjects (from 18◦ to 32◦). As δ-orientation increases from
67.5◦ to 90◦, 50%-thresholds increase even faster for most subjects, with a greater
difference in the rates of increase: +96◦ for subject B, but only +12◦ for subject G. As a
result, widely spread out thresholds are obtained at δ-orientation of 90◦: from 19◦ for
subject H to 137◦ for subjects B and F. Subject H is the only case where, surprisingly, the
50%-threshold decreases by 9.5◦. Note that subjects A, D and E present the same
threshold at δ-orientation of 90◦, equal to 43◦. However, this equality is due to our specific
definition of threshold in that orientation: the real 50%-thresholds are most likely different
from one subject to another and may be spread along a range from 43◦ (fifth loudspeaker
of the orientation) to 90◦ (sixth loudspeaker of the orientation).
A similar trend was obtained for task B, which included semantic questions (see Fig.
5), though the shift between δ = 67.5◦ and δ = 90◦ is less pronounced. Again, some
subjects (A, C, D and E) present the same threshold at δ-orientation of 90◦, equal to 34◦,
which means that the real 50%-thresholds are most likely different from one subject to
another and may actually be spread along a range from 34◦ (fourth loudspeaker of the
orientation) to 43◦ (fifth loudspeaker of the orientation).
In summary, results from both tasks A and B show that :
• 50%-thresholds strictly increase as δ-orientation increases from 0◦ to 90◦ (except for
• The rate of the increase depended on the subject, which widens inter-subject
variability as δ-orientation increases from 0◦ to 90◦. At δ = 0◦, 50%-thresholds are
already spread out (from 7◦ to 21◦), yet this variability is moderate compared with
that at orientation δ = 90◦, where 50%-thresholds range from 19◦ to 137◦.
0 45 67.5 90 0 20 40 60 80 100 120 140 Orientation δ (degrees) 50%−thresholds Ψ 50% (degrees) A B C D E F G H
Figure 5: 50%-thresholds Ψ50% for each subject as a function of the δ-orientation. Task B.
B. Influence of the task: “Without semantic questions” (task A) vs. “With semantic questions” (task B)
Wilcoxon tests were carried out to determine whether the task had a significant impact on subjects’ responses.
A first test was performed, comparing 50%-thresholds and slopes obtained for δ =
50%-thresholds and p = 0.224 for slopes). Another Wilcoxon test was performed for the δ
= 90◦ orientation, which compared the percentage of fusion reports obtained for each
loudspeaker (see Fig. 6). The test was pooled across the seven loudspeakers of the orientation, including results from all subjects, and revealed that there were more fusion reports during the task A “without semantic questions” (p = 0.011), with 64% of fusion reports for task A against 59% for task B “with semantic questions”.
10 19 27 34 43 90 137 20 30 40 50 60 70 80 90 100
Angular difference Ψ(degrees)
Fusion reports (%)
Task A Task B
Figure 6: Percentage of fusion reports for each loudspeaker at δ-orientation of 90◦, pooled
across all subjects.
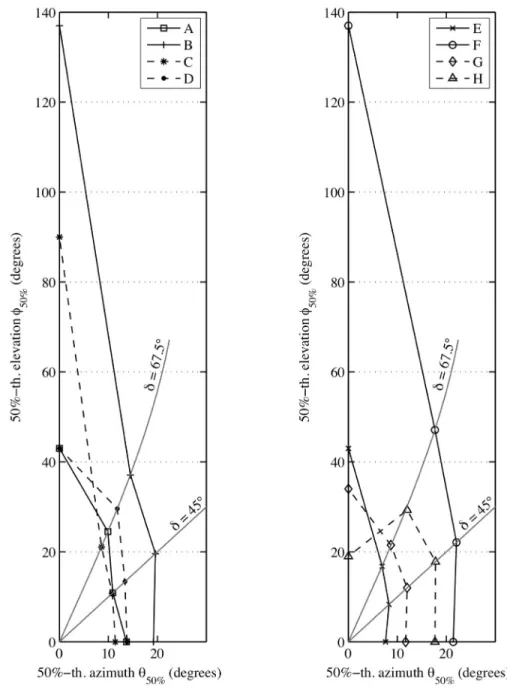
Fig. 7 presents the 50%-thresholds Ψ50% broken down into corresponding azimuth
θ50% and elevation φ50% for task A.
Changes in azimuth at threshold are quite slight compared to changes in elevation at threshold as δ-orientation increases. A Wilcoxon test, pooled across tasks A and B, even
shows that there is no significant difference of azimuth between orientations δ = 0◦ and δ =
45◦ (p = 0.820). Note that the δ-orientation of 45◦ constrains elevation to be equal to
azimuth. However, if the study had not been limited to constant orientations, it is likely that 50% thresholds would have been observed at the same azimuth but with greater elevations.
At a certain orientation between δ = 45◦ and δ = 67.5◦, the 50%-threshold azimuth
θ50% starts decreasing. Yet, as can be seen on Fig. 7, this decrease is slight compared with
the simultaneous increase of the 50%-threshold elevation φ50%.
Thus, fusion only depends on the azimuth difference between the visual and sound
stimuli over a broad range of orientation (from δ = 0◦ to at least 45◦). Beyond 45◦,
elevation difference must also be taken into account, yet it requires large changes in elevation compared with azimuth to alter fusion significantly.
IV. DISCUSSION
Figure 7: 50%-threshold azimuth θ50% and elevation φ50% for subjects A, B, C and D (left)
and subjects E, F, G and H (right). Task A. For clarity, results were split between two
diagrams. The x-axis corresponds to the δ-orientation 0◦ while the y-axis corresponds to the
The results of the present study support the hypothesis that 50%-thresholds are greater in elevation than in azimuth : 50%-thresholds were on average four times greater at
δ-orientation of 90◦ (vertical plane) than at δ-orientation of 0◦ (horizontal plane). These
results are consistent with Thurlow’s previous studies (1973), and also with the localization performance of the auditory system: as spatial precision is poorer in the vertical plane than in the horizontal plane, the influence of the spatial location of the sound stimulus decreases and thus larger angular differences are tolerated. Yet, pronounced inter-subject variability was observed, as 50%-thresholds in the vertical plane ranged from 1.1 to 8 times greater than 50%-thresholds in the horizontal plane depending on the subject. For “oblique
directions” (δ-orientation of 45◦ and 67.5◦), the visual and sound stimuli present both
azimuth and elevation differences, yet results show that changes in elevation have very little effect on ventriloquism and that 50%-thresholds are mainly determined by the azimuth difference.
B. 50%-thresholds can be large in the vertical plane
It had also been hypothesized that 50%-thresholds in the vertical plane would be greater than in Werner’s study if the experimental conditions were changed so as to more closely resemble our everyday experience. In the present experiment:
• Na¨ıve subjects conducted the test instead of experts, and it has been shown that thresholds obtained with non-expert could be as great as twice those with expert
subjects;
• The experimenters sought to achieve a high degree of realism for the stimuli
(stereoscopic projection of a life-size speaker), assuming that it would substantially increase the compellingness of the combination of sound and visual stimuli. In
Thurlow’s studies (1973), a compelling combination of sound and visual stimuli could multiply the average duration during which fusion occurred by almost three
compared with a non-meaningful combination;
• In the present experiment, sound could come from twenty-eight different locations (while Werner’s study only used four loudspeakers). It might therefore have been less easy for the subjects to learn the location of the sound stimuli.
Results show that 50%-thresholds in the vertical orientation were indeed much greater
(from 19◦ to values greater than 137◦) than those obtained by Werner et al. (2013)
(between 8◦ and 10◦). The percentage of fusion reports may even have been greater than
50% in the whole median plane for two subjects, as they still reported fusion 85% and 77%
of the time even when the sound stimulus was behind them (Ψ = 137◦ at δ-orientation of
90◦). These results are not unexpected: indeed, Thurlow and Jack (1973) had already
observed that fusion was possible in the vertical plane in spite of a 195◦ angular difference
C. Variations of attention impact ventriloquism only in the median plane It had been hypothesized that forcing the subject to focus on the semantic content of the stimuli would increase 50%-thresholds. However, most subjects reported that
memorizing the name, the favorite color and the living place of the character was an easy task that did not draw their attention away from spatial disparities. Other subjects
reported that the first words “je m’appelle”/“my name is” (which were the same for every sentence) were enough to make their decision on the ventriloquism question and they could therefore focus on the semantic content for the rest of the sentence. Results showed that
there was indeed no significant difference between tasks A and B for δ = {0◦, 45◦, 67.5◦}.
However, there were more fusion reports during the task A “without semantic
questions” than during the task B “with semantic questions” at δ = 90◦. The trend cannot
result from a learning effect, as the order of the tasks was different depending on the subject. It could be hypothesized that forcing the subjects to focus on the semantic content maintains their level of arousal at a higher degree and therefore makes them more discriminating over time.
Although the results contradict the experimenters’ hypothesis, they still show that variations in the subjects’ attention can change the 50%-thresholds significantly. At δ =
{0◦, 45◦, 67.5◦}, those changes are negligible, but it becomes far more influential at δ = 90◦.
inter-subject variability as δ-orientation increases
A hypothesis, very similar to a model proposed by Thurlow and Jack (1973), could explain the observed trends.
Whether a sound stimulus fuses with a visual stimulus or not is a complex decision that depends on several factors such as the location of the sound stimulus, the extent to which a subject assumes that the sound and the visual stimuli should “go together” (compellingness factor) and the extent to which the subject pays attention to the spatial location of the sound stimulus.
The influence of these factors has more or less weight depending on the situation. For example, if the precision of sound localization is poor, then the sound stimulus could come from any one of a large number of locations. If the combination of the visual and sound stimuli is highly compelling, the subjects might assume that the most probable location for the sound stimulus is the same as the visual stimulus. Thus, the influence of the factor “location of the sound stimulus” decreases to the benefit of the “compellingess” factor.
While some factors are fairly consistent across subjects, other factors show large inter-subject variability:
• Localization performance has been shown to be consistent across subjects (Makous and Middlebrooks, 1990);
• The strength of the assumption that a sound stimulus and a visual stimulus should “go together” (compellingness factor) depends on the experience of subjects and on their history with similar situations (Warren et al., 1981);
• Attention to the auditory modality has also been shown to vary substantially from one subject to another in previous visual-auditory multisensory tasks (Giard and Peronet, 1999).
Thus, if the weight associated with a highly subjective factor (such as compellingness or attention) increases, it would be expected to observe larger inter-subject variability.
In the horizontal plane, localization performance is good. Thus, as long as there is some minimal difference in azimuth between the sound and visual stimuli, whether or not fusion occurs is strongly influenced by the horizontal location of the sound stimulus. This has several consequences:
• 50%-thresholds occur for limited angular differences between the sound and visual stimuli;
• A change in elevation of the sound stimulus has little effect because the lack of
precision in vertical localization makes this change an irrelevant spatial cue compared with azimuth;
moderate inter-subject variability is shown, and small variations in attention (task A vs. task B) are negligible.
Yet, as δ-orientation increases, there are increasing elevation differences and
decreasing azimuth differences between the sound and the visual stimuli. As localization precision is poorer in elevation, the influence of the spatial location of the sound stimulus thus decreases, which has two consequences:
• 50%-thresholds increase;
• The influence of other factors, such as compellingness and variations in attention, increases. As these factors are highly subjective, larger inter-subject variability is observed. It would also explain why the factor “attention” (task A vs. task B) only
became significant at δ-orientation of 90◦.
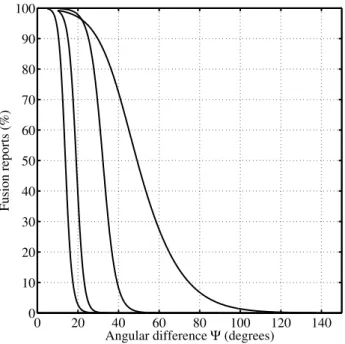
Fig. 8 shows the psychometric functions obtained for subject D during task A. The slopes determine how strongly the percentage of fusion reports varies with the angular difference Ψ. A steep slope means that the 50%-threshold clearly separates the angular difference Ψ into two zones: one where fusion always occurs, and one where fusion never occurs. As the slope gets shallower, an interval of “uncertainty” increases around the 50%-threshold, corresponding to a range of angular differences for which subjects’
and quite similar at δ-orientation of 0◦ and 45◦. Yet, as δ-orientation increases from 45◦ to
90◦, the slope gets shallower. This trend, which has been observed for all subjects, is
entirely consistent with the hypothesis that the decision of subjects is being increasingly
influenced by fluctuating factors, such as attention, as δ-orientation increases from 45◦ to
90◦. 0 20 40 60 80 100 120 140 0 10 20 30 40 50 60 70 80 90 100
Angular difference Ψ (degrees)
Fusion reports (%)
Figure 8: Psychometric functions obtained for subject D during task A at each δ-orientation.
From left to right : δ = 0◦, δ = 45◦, δ = 67.5◦, δ = 90◦.
V. CONCLUSION
In the present experiment, images of a speaker were presented directly in front of subjects. The voice of the speaker could be reproduced on different loudspeakers, which
created disparities between the sound and the visual stimuli. For each presentation, subjects had to indicate whether the voice and the mouth of the speaker came from the same direction (the so-called ventriloquism effect) or not. 50%-thresholds were measured for sound stimuli varying in both azimuth and elevation. Results show that 50%-thresholds were greater in elevation than in azimuth (which is consistent with the localization
performance of the auditory system), and could sometimes reach very high values (some subjects still perceived the voice of the speaker on his mouth, even when the sound was reproduced behind them). However, larger inter-subject variability was observed in elevation than in azimuth.
In an additional task, subjects had to answer questions on the semantic content of the stimuli before giving their answer on ventriloquism. As long as some minimal difference in azimuth between the sound and visual stimuli was present, there was no effect of the semantic questions. In the median plane (no difference of azimuth), the effect was significant but contrary to what was expected: 50%-thresholds decreased when subjects had to focus on the semantic content.
Results suggest that:
• In azimuth, fusion is mainly determined by the horizontal location of the sound stimulus relative to the location of the visual stimulus. As sound localization
inter-subject variability are moderate compared with in elevation;
• In elevation, sound localization is not precise, and the influence of the location of the sound stimulus decreases substantially to the benefit of subjective factors such as attention or compellingness. Thus, greater 50%-thresholds are obtained (especially if the combination of sound and visual stimuli is realistic) and the inter-subject
variabilty increases.
Acknowledgements
The authors would like to thank Pierre Souchar, Baptiste Le Deun, Vincent Mazo and all the subjects from the University of Brest who took part in the subjective experiments. This work was partly funded by the European cross-border cooperation programme
INTERREG IV A France (Channel) - England, co-funded by the ERDF, in the context of the Cross Channel Film Lab project, and partly supported by the French National
Research Agency (ANR) as a part of the EDISON 3D project (ANR-13-CORD-0008-02)
and by the Finist`ere General Council (29), France.
REFERENCES
Agganis, B. T., Muday, J. A., and Schirillo, J. A. (2010), “Visual biasing of auditory localization in azimuth and depth,” Percept. Mot. Skills 111, 872–892.
Alais, D. and Burr, D. (2004), “The ventriloquist effect results from near-optimal bimodal integration,” Curr. Biol. 14, 257–262.
Andr´e, C., Corteel, E., Embrechts, J.-J., Verly, J., and Katz, B. F. G. (2014), “Subjective
Evaluation of the Audiovisual Spatial Congruence in the Case of Stereoscopic-3D Video and Wave Field Synthesis,” Int. J. Hum.-Comput. St. 72, 23–32.
Ashmead, D. H., Leroy, D., and Odom, R. D. (1990), “Perception of the relative distances of nearby sound sources,” Percept. Psychophys. 47, 326–331.
Battaglia, P., Jacobs, R., and Aslin, R. (2003), “Bayesian integration of visual and auditory signals for spatial localization,” J. Opt. Soc. Am. 20, 1391–1396.
Bermant, R. I. and Welch, R. B. (1976), “Cross-modal bias and perceptual fusion with auditory-visual spatial discordance,” Percept. Mot. Skills 43, 487–493.
Bertelson, P. and Aschersleben, G. (1998), “Bayesian integration of visual and auditory signals for spatial localization,” Psychon. Bull. Rev. 5, 482–489.
Bertelson, P. and Radeau, M. (1981), “Cross-modal bias and perceptual fusion with auditory-visual spatial discordance,” Percept. Psychophys. 29, 578–584.
Bolia, R. S., Nelson, W. T., Ericson, M. A., and Simpson, B. D. (2000), “A speech corpus for multitalker communications research,” J. Acoust. Soc. Am. 107, 1065–1066.
Bowen, A. L., Ramachandran, R., Muday, J. A., and Schirillo, J. A. (2011), “Visual signals bias auditory targets in azimuth and depth,” Exp. Brain. Res. 214, 403–414.
Bruijn, W. P. d. and Boone, M. M. (2002), “Subjective experiments on the effects of combining spatialized audio and 2D video projection in audio-visual systems,” in
Proceedings of the 112th Convention of the Audio Eng. Soc., paper no. 5582.
Cavonius, C. and Robbins, D. (1973), “Relationships between luminance and visual acuity in the rhesus monkey,” J. Physiol. 232, 239–246.
Choe, C. S., Welch, R. B., Gilford, R. M., and Juola, J. F. (1975), “The “ventriloquist effect”: Visual dominance or response bias?” Percept. Psychophys. 18, 55–60.
Ernst, M. O. and Banks, M. S. (2002), “Humans integrate visual and haptic information in a statistically optimal fashion,” Nature 415, 429–433.
Gardner, M. B. (1968), “Proximity image effect in sound localization,” J. Acoust. Soc. Am. 43, 163.
Giard, M. H. and Peronet, F. (1999), “Auditory ? visual integration during multimodal object recognition in humans: A behavioral and electrophysiological study,” Journal of Cognitive Neuroscience 11, 473?490.
Hairston, W., Wallace, M., Vaughan, J., Stein, B., Norris, J., and Schirillo, J. (2003), “Visual localization ability influences cross-modal bias,” J. Cogn. Neurosci. 15, 20–29.
Hl´adek, L., Le Dantec, C. C., Kopco, N., and Seitz, A. (2013), “Ventriloquism effect and
aftereffect in the distance dimension,” in Proceedings of Meetings on Acoustics, Acoustical Society of America., vol. 19, p. 050042.
Ijsselsteijn, W., Ridder, H. d., Freeman, J., Avons, S. E., and Bouwhuis, D. (2001), “Determination of optimal data placement for psychometric function estimation: A computer simulation,” Presence-Teleop. Virt. 10, 298–311.
ITU-R BS.1284-1 (2003), “General methods for the subjective assessment of sound quality,” International Telecommunications Union.
Jack, C. E. and Thurlow, W. R. (1973), “Effects of degree of visual association and angle of displacement on the “ventriloquism” effect,” Percept. Mot. Skills 37, 967–979.
Jackson, C. V. (1953), “Visual factors in auditory localization,” Q. J. Exp. Psychol. 5, 52–65.
Knudsen, E. I. and Konishi, M. (1979), “Mechanisms of sound localization in the barn owl (Tyto alba),” J. Comp. Physiol. 133, 13–21.
Komiyama, S. (1989), “Subjective evaluation of angular displacement between picture and sound directions for HDTV sound systems,” J. Audio Eng. Soc. 37, 210–214.
Lam, C. F., Dubno, J. R., and Mills, J. H. (1999), “Determination of optimal data placement for psychometric function estimation: A computer simulation,” J. Acoust. Soc. Am. 106, 1969–1976.
Levitt, H. (1971), “Transformed up?down methods in psychoacoustics,” J. Acoust. Soc. Am. 49, 467–477.
Lewald, J., Ehrenstein, W., and Guski, R. (2001), “Spatio-temporal constraints for auditory-visual integration,” Behav. Brain Res. 121, 69–79.
Makous, J. C. and Middlebrooks, J. C. (1990), “Two-dimensional sound localization by human listeners,” J. Acoust. Soc. Am. 87, 2188–2200.
Mannerheim, P. (2011), “Spatial sound and stereoscopic vision,” in Proceedings of the
130th Convention of the Audio Eng. Soc., paper no. 8424.
Martin, R. L., McAnally, K. I., Bolia, R. S., Eberle, G., and Brungart, D. S. (2012), “Spatial release from speech-on-speech masking in the median sagittal plane,” J. Acoust. Soc. Am. 131, 378–385.
in combination with 2D video projection,” in Proceedings of the 24th International
Conference of the Audio Eng. Soc., paper no. 47.
Melchior, F., Fischer, J., and Vries, D. d. (2006), “Audiovisual perception using Wave Field Synthesis in combination with augmented reality systems: Horizontal positioning,”
in Proceedings of the 28th International Conference of the Audio Eng. Soc., paper no. 3-2.
Mershon, D. H., Desaulniers, D. H., Amerson, T. L., and Kiefer, S. A. (1980), “Visual capture in auditory distance perception: Proximity image effect reconsidered,” J. Aud. Res. 20, 129–136.
Middlebrooks, J. C., Makous, J., and Green, D. M. (1989), “Directional sensitivity of sound-pressure levels in the human ear canal,” J. Acoust. Soc. Am. 86, 89–108.
Pick, H. L., Warren, D. H., and Hay, J. C. (1969), “Sensory conflict in judgments of spatial direction,” Percept. Psychophys. 6, 203–205.
Radeau, M. (1974), “Adaptation au dplacement prismatique sur la base d’une discordance
entre la vision et l’audition,” L ’Ann´ee Psychologique 74, 23–24.
Radeau, M. and Bertelson, P. (1976), “The effect of a textured visual field on modality dominance in a ventriloquism situation,” Percept. Psychophys. 20, 227–235.
Radeau, M. and Bertelson, P. (1977), “Adaptation to auditory-visual discordance and ventriloquism in semirealistic situations,” Percept. Psychophys. 22, 137–146.
Recanzone, G. H., Makhamra, S. D., and Guard, D. C. (1998), “Comparison of relative and absolute sound localization ability in humans,” J. Acoust. Soc. Am. 103, 1085–1097.
Thurlow, W. R. and Jack, C. E. (1973), “Certain determinants of the “ventriloquism effect”,” Percept. Mot. Skills 36, 1171–1184.
Vatakis, A. and Spence, C. (2007), “Crossmodal binding: Evaluating the unity assumption using audiovisual speech stimuli,” Perception and Psychophysics 69, 744?756.
Wallace, M., Roberson, G., Hairston, W., Stein, B., Vaughan, J., and Schirillo, J. (2004), “Unifying multisensory signals across time and space,” Exp. Brain. Res. 158, 252–258.
Warren, D. H. (1979), “Spatial localization under conflict conditions: Is there a single explanation?” Percept. 8, 323–337.
Warren, D. H., Welch, R. B., and McCarthy, T. J. (1981), “The role of visual-auditory compellingness in the ventriloquism effect: Implications for transitivity among the spatial senses,” Perception and Psychophysics 30, 557–564.
Weerts, T. C. and Thurlow, W. R. (1971), “The effect of eye position and expectation on sound localization,” Percept. Psychophys. 9, 35–39.
Welch, R. B. (1999), “Meaning, attention, and the “unity assumption” in the intersensory bias of spatial and temporal perceptions,” Adv. Psychol. 129, 371–387.
Welch, R. B. and Warren, D. H. (1980), “Immediate perceptual response to intersensory discrepancy,” Psychol. Bull. 88, 638.
Werner, S., Liebetrau, J., and Sporer, T. (2013), “Vertical Sound Source Localization Influenced by Visual Stimuli,” Signal Process. Res. 2, 29–38.
Zahorik, P. (2003), “Auditory and visual distance perception: The proximity-image effect revisited,” J. Acoust. Soc. Am. 113, 2270–2270.
Zchaluk, K. and Foster, D. H. (2009), “Model-free estimation of the psychometric function,” Percept. Psychophys. 71, 1414–1425.
Figure Captions
Table 1. The ITU-R 5-grade impairment scale (ITU-R BS.1284-1, 2003).
Fig. 1. The 4 δ-orientations along which the sound stimulus could be shifted from the visual stimulus. The orientations were centered at the subject’s head. The visual stimulus
was fixed (0◦ azimuth, 0◦ elevation) and is represented by the grey circle.
Fig. 2. Example of a loudspeaker A with orientation δ = 67.5◦ and angular difference
Ψ = 36◦.
Table 2. Loudspeaker locations, with associated azimuth θ, elevation φ and angular difference Ψ, for the 4 δ-orientations.
Fig. 3. 50%-thresholds Ψ50% for each subject as a function of the δ-orientation. Task A.
Fig. 4. Psychometric functions at δ = 90◦ for subject C, task A. Points represent data
obtained for each loudspeaker.
Fig. 5. 50%-thresholds Ψ50% for each subject as a function of the δ-orientation. Task B.
Fig. 6. Percentage of fusion reports for each loudspeaker at δ-orientation of 90◦, pooled
across all subjects.
Fig. 7. 50%-threshold azimuth θ50% and elevation φ50% for subjects A, B, C and D (left)
and subjects E, F, G and H (right). Task A. For clarity, results were split between two
the δ-orientation 90◦.
Fig. 8. Psychometric functions obtained for subject D during task A at each δ-orientation.