Journal of Fundamental and Applied Sciences is licensed under aCreative Commons Attribution-NonCommercial 4.0 International License.Libraries Resource Directory. We are listed underResearch Associationscategory.
HYDROLOGICAL MODELING IN SEMI-ARID REGION USING HEC-HMS MODEL. CASE STUDY IN AIN SEFRA WATERSHED, KSOUR MOUNTAINS
(SW-ALGERIA)
A. Derdour*, A. Bouanani and K. Babahamed
Laboratory No.25, University of Tlemcen; BP119, 13000, Tlemcen, Algeria
Received: 24 October 2016 / Accepted: 28 April 2017 / Published online: 01 May 2017
ABSTRACT
Ain Sefra is one of the Algerian cities that had been experienced several devastating floods during the past 100 years. The purpose of this study is to simulate rainfall-runoff in the semi-arid region of Ain Sefra watershed through the employing of HEC-HMS model. In this paper, the frequency storm is used for the meteorological model, the SCS curve number is selected to calculate the loss rate and SCS unit hydrograph method have been applied to simulate the runoff rate. After calibration and validation, the simulated peak discharges were very closed with observed values.The Nash-Sutcliffe efficiency coefficient was 0.95 which indicated that the hydrological modeling results are satisfactory and accepted for simulation of rainfall-runoff. The peak discharges obtained for the 10, 50, 100 and 1000 years storms were respectively 425.8m3/s, 750.5m3/s, 904.3m3/s and 1328.3m3/s.
Key-Words: Ain Sefra, Floods, HEC-HMS, Frequency storm, Hydrological Modeling,
Semi-arid.
Author Correspondence, e-mail:samederdour@yahoo.fr doi:http://dx.doi.org/10.4314/jfas.v9i2.27
ISSN 1112-9867
Available online at http://www.jfas.info
Journal of Fundamental and Applied Sciences is licensed under aCreative Commons Attribution-NonCommercial 4.0 International License.Libraries Resource Directory. We are listed underResearch Associationscategory.
HYDROLOGICAL MODELING IN SEMI-ARID REGION USING HEC-HMS MODEL. CASE STUDY IN AIN SEFRA WATERSHED, KSOUR MOUNTAINS
(SW-ALGERIA)
A. Derdour*, A. Bouanani and K. Babahamed
Laboratory No.25, University of Tlemcen; BP119, 13000, Tlemcen, Algeria
Received: 24 October 2016 / Accepted: 28 April 2017 / Published online: 01 May 2017
ABSTRACT
Ain Sefra is one of the Algerian cities that had been experienced several devastating floods during the past 100 years. The purpose of this study is to simulate rainfall-runoff in the semi-arid region of Ain Sefra watershed through the employing of HEC-HMS model. In this paper, the frequency storm is used for the meteorological model, the SCS curve number is selected to calculate the loss rate and SCS unit hydrograph method have been applied to simulate the runoff rate. After calibration and validation, the simulated peak discharges were very closed with observed values.The Nash-Sutcliffe efficiency coefficient was 0.95 which indicated that the hydrological modeling results are satisfactory and accepted for simulation of rainfall-runoff. The peak discharges obtained for the 10, 50, 100 and 1000 years storms were respectively 425.8m3/s, 750.5m3/s, 904.3m3/s and 1328.3m3/s.
Key-Words: Ain Sefra, Floods, HEC-HMS, Frequency storm, Hydrological Modeling,
Semi-arid.
Author Correspondence, e-mail:samederdour@yahoo.fr doi:http://dx.doi.org/10.4314/jfas.v9i2.27
ISSN 1112-9867
1. INTRODUCTION
The report compiled by the UN Office for Disaster Risk Reduction (UNISDR) and the Belgian-based Centre for Research on the Epidemiology of Disasters (CRED), says that between 1995 and 2015, there were 3062 flood disasters, which accounted for 47% of all weather-related disasters and 43% of all natural disasters combined, which also includes geophysical hazards such as earthquakes and volcanoes. The floods are ranked first in the disaster world, causing nearly 32 million people, or 33.2% of the total number of people affected by natural disasters [1]. In Algeria, the floods have marked as one of the most frequent natural disasters and the most destructive. The flood of November 10th, 2001 at Bab El Oued district of Algiers is the deadliest with 772 deaths [2]. These exceptional phenomena are well-studied under temperate climate however arid and semi-arid areas have received little attention [3]. This study interest in Ain Sefra which is situated in the western part of Ksour Mountains, in the junction of wadis Breidj and Tirkount (Figure 01). As it belongs to a semi arid climate, it already suffers the problem of flash flooding during the last 100 years. The most recent flood was in 2014, which caused losses of live and destruction to properties and infrastructures.
The flood damages will be increased over the years due to population growth and socio-economic development, and the climate change due to the global warming effect. Therefore, it is necessary to define methodology to predict the flash floods in this region, to protect the city againt inundations. The widely used approach to determine flash flood occurrence and the relationships between rainfall and runoff data is the Hydrological modeling which accommodate the hydrological process to estimate streamflow over river basins and assist forecasters in making a comparison between simulated streamflow and observed flooding, to predict and understand the hydrologic process. Hydrological studies are often aimed at establishing rainfall-runoff relationships [4]. Rainfall-runoff models can be categorized according to the model type. According to Clarke R.T and Ambroise B. [5] [6], the hydrological models can be classified in to four main categories: Determinist or stochastic, global or semi-distributed, kinematic or dynamic and finally empirical or conceptual. The selection of the model depends on the watershed and the objective of the hydrological forecast in the watershed. In this study, the conceptual approach is adopted for the hydrologic modeling, we use a semi distributed hydrologic model of HEC-HMS (Hydrologic Engineering Center- Hydrologic Modeling System) was developed by US Army Corps of Engineers, in order to investigate the rainfall-runoff interactions in the semi-arid Ain Sefra watershed of southwestern Algeria. It is applicable in diverses geographic areas for solving the widest possible of problems. Many scientists have conducted important hydrologic studies using HEC-HMS model, which proved its ability to simulate and forecast streamflow. As exemple: Sintayehu L.G. used HEC-HMS model employing Snyder unit hydrograph and exponential recession method to simulate the runoff of upper blue Nile river Basin [7]. Norhan A. and al. modeled rainfall-runoff relations using HEC-HMS in arid environment at wadi alaqiq, Madinah, Saudi Arabia [8]. Sampath and al. modeled the rainfall-runoff relations using HEC-HMS in tropical catchment in Sri Lanka [9]. F. Meiling W. and al. employed the HEC-HMS to simulate runoff in the semi-arid region of northwestern China [10]. Laouacheria F. and Mansouri R. used HEC-HMS model by emploiying Frequency Storm to simulate the runoff in a small urban catchment in the North East of Algeria [11]. This paper presents a methodology of rainfall–runoff model by using HEC-HMS program integrated with DEM
data as an input for basin model in semi arid environment to simulate the pick discharges for 10, 50, 100 and 1000 year ARI (Average Recurrence Interval) in Ain Sefra watershed and its sub-catchment.
2. MATERIALS AND METHODS 2.1. Data
Rainfall timeseries data are collected from Algerian Meteorological Office (ONM) from the only meteorological station in the region that of Ain Sefra (for 1980-2014), and flow data are collected from the National Agency of Hydric Resources of Algeria (ANRH) from the unique gauging station in the region that of Ain Hadjadj (for 1978-2008) (Table 1).
Table 1. Characteristics of rainfall and runoff stations in Ain Sefra watershed Station
name Gauge type Longitude Latitude
Elevation (m)
Selected Period Ain Sefra Rain gauge 32°45'08.44"N 0°35'39.02"W 1084 1980-2014
Ain Hadjadj Runoff gauge 32°38'33.74"N 0°22'17.92"W 933 1978-2008
Also, spatial data was downloaded from the land cover website at:
http://earthexplorer.usgs.gov/ in the form of ASTER (Advanced Spaceborn Thermal Emission and Reflection Radiometer) type Global Digital Elevation Model GDEM with 30 m resolution. We adopted the DEM to define Ain Sefra watershed and its physical characteristics.
2.2. Methods
Our objective is to examine the rainfall-runoff relationship in Ain Sefra watershed, in order to propose effective solutions to protect the city against inundations. The methodology is based on meteorological and physical data processing in the geospatial environment and on data editing using remote sensing and GIS techniques. Our methodology can be separated into six main stages:
- Description and geographic location of the study area.
- DEM processing, defining stream network, topography, and watershed characteristics, using the extension ArcHydro tools in ArcMap.
- Define geological and soil characteristics of the watershed, to compute the runoff curve number (CN).
- Importing the the catchment physical characteristics data to HEC-HMS model. - Run the rainfall/runoff simulation, and compare compute and observes flows - Calibration and validation of the model
2.3. Description of study area
Ain Sefra watershed has an area of 1957 km2; it’s situated in the SW of Algeria in the region called Ksour Mountains (Figure 2). It is located between longitudes (1°0’0’’ and 0°03’00’’W)
and latitudes (32°30’22’’and 33°00’00’’N). The watershed is as a landlocked basin
surrounded by mountains, dominated south by a marked relief of Djebel Mekther (2035 meter), the South West by Mir El Djebel (2109 meter) and the Djebel Mzi (2206 meter), North Djebel Aissa (2236 meter) and the North West by the Djebel Morghad (2136 meter) and the Djebel Bouamoud.
Fig.2. Location of Ain Sefra watershed in Algeria (ASTER, 30m resolution, Map datum:
With 67 km of length, the longest flow path run southwestward from its origin in the north side of Djebel Morghad, and receive the wadi of Sfissifa, together they forms the wadi of Breidj, and they pursues the same direction to meet the wadi of Tirkount that drains the waters of djebel Morghad and djebel Aissa and has 29.6% of of Ain Sefra watershed area. These two wadis (Breidj and Tirkount) meet at downtown Ain Sefra to form the wadi of Ain Sefra that’s run to the south at downstream of the study area while receiving other wadis as Tiout and Sam, to become at the end wadi Namous that is lost in the great western Erg in the Algerian sahara at 370 km from its origin. The network is quite dense and branched which allows easy collection of rainwater to lead them to the outlet [12].
2.4. Topography of Ain Sefra watershed
The morphometric characteristics are extracted from digital elevation model (DEM). The most common altitudes are between 1200 and 1400 m representing 57% of the total area of Ain Sefra watershed. The altitudes below 1100 m represent only 2% of the total area (Figure 3). Ain Sefra watershed is characterized by relatively steep slopes upstream, the slope decreases downstream from the confluence of wadi Sfissifa with wadi Breïdj. The mean elevation is 1334 m and the mean basin slope is 5.8 m/km.
There are three types of slopes (Figure 4): 1) A relatively low slope between (0 and 6%) at low altitudes (1058-1400 m), where the presence of a deep valley in the area of El Hendjir, and Ain Sefra, occupying 79% of the the total area of the watershed. 2) A moderately steep slope between (6 and 25%) at moderate altitudes (1400-1600 m), where the presence of an intermediate hill in the foothills of Djebels: the area occupied is about 12%. 3) A very steep (over 25%) at altitudes (1600-2213 m) explaining the presence of mountains that occupy 8% of the total area of the basin, these slopes give the river a violent and torrential type.
Fig.4. Map of slopes of Ain Sefra watershed (Map datum: UTM WGS 84)
2.5. Geology of Ain Sefra watershed
The watershed is composed of different geological constituents from the Triassic formation to the Quaternary with a predominance of the Mesozoic formations. According to Kacemi A. the formation of Tiout belonging to the Cretaceous is the largest with a thickness of 1065m [13]. More than 46.4 % of the area is covered by Jurassic formation, 19.4 % of Miopliocene formations, and 18 % of Cretacious formations. The other perecent (16.2 %) filled with, alluvium, colluvium, and quaternary formations. The Figure 05 shows the geological map of
Ain Sefra watershed extracted from the geological map of Algeria [14]. The Facies that largely dominate the Ksour Mountains are the sandstone formations (Jurassic and Cretaceous), but they are usually clayey interspersed by marl or compact quartz, their permeabilities are generally very low, except for the Albian sandstone which constitute the most important groundwater aquifer in the region which is characterized by confined to semi-confined conditions [15]. The Quaternary formations are very thick but they cover large areas in the basin; they are known by their high permeability [16] [17], as the case of the wadis Breidj and Tirkount that left their banks significant alluvial deposits that contain a alluvial watertables exploited by many wells.
Fig.5. Map of geology of the studied zone (Map datum: UTM WGS 84)
2.6. Land use and soil type of Ain Sefra watershed
The land use data was provided from the General Directorate for Forestry of Algeria (DGF). The total area of the basin covers about 1957 Km2. The main dominant lands in the basin are the grasslands (56.2 %), the forest land (29.2 %), bare areas (6.6 %) and outcrop lands (4.4%). The rest are in minor proportion: agricultural lands (1.8 %), sand lands (1.6 %) and urban areas (0.3 %). (Figure 6)
The other major factor of the basin property is the soil type. Soil types and their distribution are extremely related to the nature of geomorphic unites. According to the researches of: Bensaid A [18], Djebaili S [19], Pouget M. [20] and Gordo B [21], Four soil types are distinguished in the basin of Ain Sefra: The Calci-Magnesi soils, the mineral soils, the poorly graded soils and the saline soils.
Fig.6. Land use of Ain Sefra Watershed (Map datum: UTM WGS 84)
2.7. Hydro climatic characteristics Ain Sefra watershed
The region is characterized by a semi-arid climate, with dry and hot summers where rainfall is almost absent and with high evaporation. Winters are cool and sometimes very cold, with often rain intensities in autumn. The series of data available from 1980 to 2014 in the only weather station in the region that of Ain Sefra, shows that the study area receives annual rainfall between 50.3 mm and 439.8 mm with an average of 185 mm (Figure 7). The region rainfall is characterized by high temporal and spatial irregularity. The average monthly rainfall is 30.64 mm for the wettest month (October), and 3.92 mm for the driest month (July). The durations of rainfall events in Ain Sefra wetershed vary from storm to storm but they are generally short with a high intensity. The annual average temperature is around 17.5 °C.
The maximum, minimum, and average temperatures show that the lowest temperatures occurs in Nomvember, December, and January and the highest records are in June, July, and August. Only 1.3 % of the rainfall infiltrates and percolates into the saturated zones, which is comparable with other arid and semi-arid regions [22].
Fig.7. The total annual rainfall depth at the rain gauge of Ain Sefra city
The mean annual runoff of the basin is 0.7m3/s, with high temporal and spatial variability. Ain sefra watershed floods are highly variable and irregular, short and stormy, with very high peak discharges. The morphology of the basin helps boost peak discharges observed at the outlets. The peak discharges of the Wadi Ain Sefra vary from a few m3/s to 750.84m3/s. The maximum peak discharges is recorded in 24 October 2000. Floods are characterized by a very fast rise, leading severe damages in Ain Sefra city, and a slow decline followed by a prolonged dry period. Autumn is reported as risky season. After having tested several statistical methods employed in flood frequency analysis (FFA) (Exponential, GUV, Gamma, Gumbel, Normal, Log-Normal), peak discharges of wadi Ain Sefra during 32 years fits well with the Gumbel approch (Figure 8). This statistical methods employed allow us to estimate the peak discharges (Qmax) for different Average Recurrence Interval (Table. 02).
Table 2. Peak discharges with Gumbel approch
ARI 10 years 20 years 50 years 100 years 1000 years
Flow (m3/s) 463 580 731 845 1120
Fig.8. Peak discharges adjusted with Gumbel statistical method
3. HEC-HMS Model 3.1. Model description
The Hydrologic Engineering Center’s Hydrologic Modeling System (HEC-HMS) is designed to simulate the precipitation-runoff processes of dendritic watershed systems. It is designed to be applicable in a wide range of geographic areas for solving the widest possible range of problems [23]. Hydrographs produced by the program are used directly or in conjuction with other software for studies of water availability, urban drainage, flow forecasting, future urbanization impact, reservoir spillway design, flood damage reduction, floodplain regulation, and system operation [23]. HEC-HMS Model setup consists of four main model components: basin model, meteorological model, control specifications, and input data (time series, paired data, and gridded data). An assortment of different methods is available to simulate infiltration losses (Deficit and constant, Exponential, Green and Ampt, Initial and constant, SCS curve number, Smith Parlange and Soil Moisture Accounting (SMA). Seven methods are included for transforming excess precipitation into surface runoff (Clark unit hydrograph, Kinematic wave, ModClark, SCS unit hydrograph, Snyder unit hydrograph, User specified graph and user specified unit hydrograph). Six methods are included fot Routing model (Kinematic
wave Routing, Lag Routing, Modified Puls Routing, Muskingum Routing, Muskingum-Cunge Routing and Straddle Stagger Routing). For the meteorological model eight methods are included (Frequency Storm, Gage weights, Gridded precipitation, Inverse distance, HMR52, SCS storm, Specified hyetograph, Standard project storm)
3.2. Model Structure
In this study, SCS Curve Number (CN) Loss method will be used to determine the hydrologic loss rate, the SCS unit hydrograph (HU) method will be used to calculate the runoff rate, and the simulating process is done by using Frequency storm for the meteorological model.
3.2.1. Catchment model
The catchment model represents the physical watershed. In order to increase for better performance of modeling, in this study, the catchment is sub divided into two major sub basins (Breidj and Tirkount) to use the model as semidistributed. The representation of these sub-catchments within the watershed is shown in Figure 9. The hydrological parameters of sub-catchments of Ain Sefra watershed are shown in Table 3.
Table3. Hydrological parameters of sub-catchments of Ain Sefra watershed
Catchment Area (Km2) Perimeter (Km) Channel slope (%) Stream Length (Km) Tirkount 579.55 143.34 9,56 % 44.51 Breidj 1373.44 269.2 9,31 % 67
3.2.2. Loss Method.
In this study, SCS Curve Number (CN) loss method is used to determine the hydrologic loss rate. The Soil Conservation Service (Now the Natural Resources Conservation Service) curve number method implements the curve number methodology for incremental losses. Originally, the methodology was intended to calculate total infiltration during a storm. The CN for a watershed can be estimated as a function of land use, soil type, and antecedent soil moisture, using tables published by the SCS. CN values range from 100 (for water bodies) to approximately 30 for permeable soils with high infiltration rates [24]. The SCS CN model is given by equation (1):
=
(( ) ) (1)Where: Q runoff value in mm; P precipitation in mm; Iainitial abstraction in mm; S potential
maximum retention is given by equation (2):
=
(2)The runoff curve number CN is a function of land use, treatment and condition; infiltration characteristics of the soils; and antecedent moisture condition. McCuen discusses the use of the SCS runoff model in detail [25]. The hydrological soil classification system developed by the Soil Conservation Service was used for classifying soils into different hydrological soil groups. In this classification system, soils are classified as A, B, C or D hydrologic soil group
depending on their properties: Soil Group ‘A’ has low runoff potential and high infiltration. Soil Group ‘B’ has low to moderate runoff. Soil Group ‘C’ have flat infiltration rate, so the
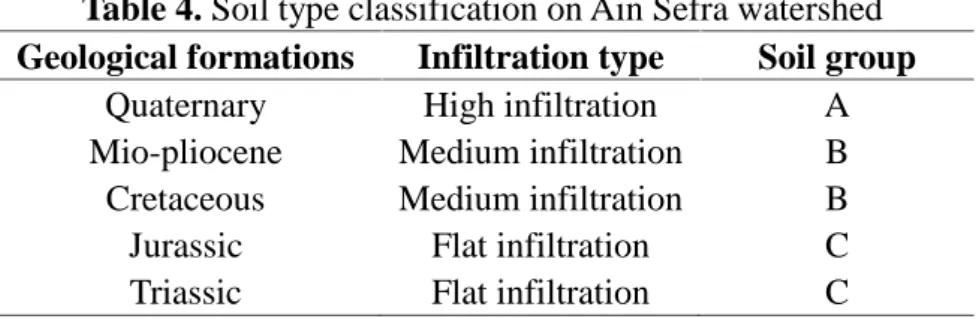
runoff is quite higher. Soils Group ‘D’ has high runoff potential and very low infiltration rate [26]. For this purpose the hydrologic soil groups were defined based on the geological map of Ain Sefra watershed. The results are listed in table 4.
Table 4. Soil type classification on Ain Sefra watershed Geological formations Infiltration type Soil group
Quaternary High infiltration A
Mio-pliocene Medium infiltration B
Cretaceous Medium infiltration B
Jurassic Flat infiltration C
In this study, Curve numbers CN are computed for the two sub-catchments (Tirkount and Breidj) are based on their land use/covers, soil types, and hydrologic soil groups by using appropriate approaches in Watershed Modeling System WMS [27]. The CN values are listed in Table 5.
Table 5. CN values of the sub-catchments of Ain Sefra watershed Sub-catchments Curve Number
Tirkount 75
Breidj 79
3.2.3. Transform Method
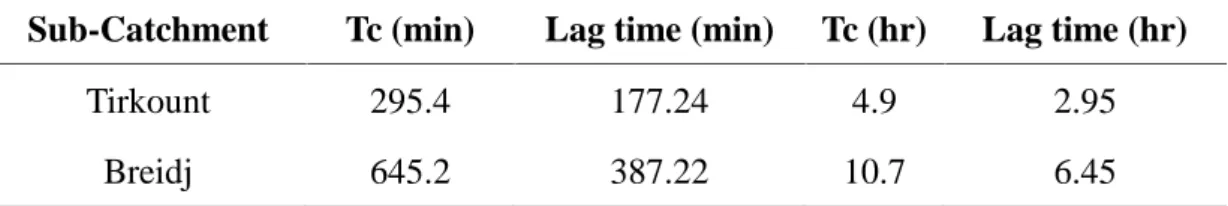
In this paper, the translation of excess precipitation to runoff is accomplished using the User-Specified S-Graph Transform Method. The SCS unit hydrograph method requires only one parameter for each subbasin “The lag time”. The standard lag is defined as the length of time between the centroid of precipitation mass and the peak discharges of the resulting hydrograph [28]. The transform method requires a lag time determination as an input. The SCS developed a relationship between the time of concentration (Tc) and the lag time (Tlag)
given by Equation 3. The time of concentration is calculated by Giandotti’s formula given by Equation 4 [29].The time of concentration and lag time values for the Breidj and Tirkount sub-catchments are listed in Table 6.
= 0.6 (3)
=
√. √. (4)Where: Tlagis the lag time Tc is the time of concentration, A is the watershed area (km2), L is
the length of the main channel (Km) and H is the difference between the mean basin elevation and the outlet elevation (m).
Table 6. The temps of concentration and lag times of Ain Sefra subcatchments Sub-Catchment Tc (min) Lag time (min) Tc (hr) Lag time (hr)
Tirkount 295.4 177.24 4.9 2.95
3.2.4. Meteorological model
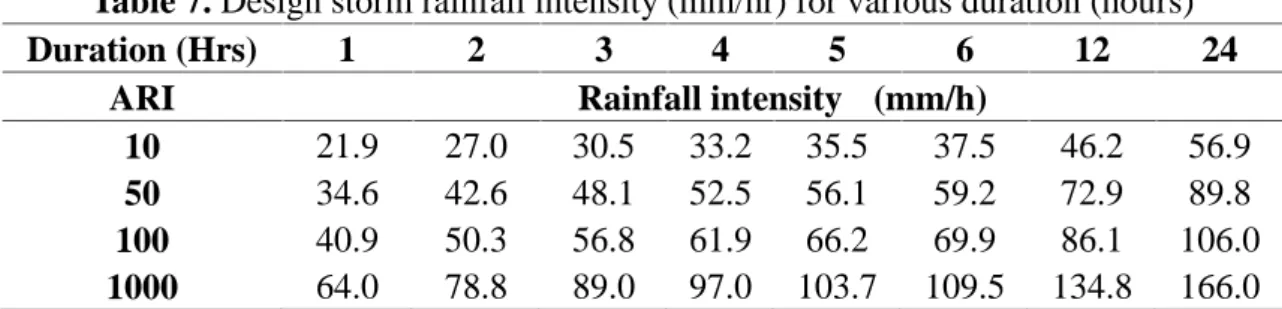
In this study, frequency storm data are used for the HEC-HMS model. The frequency storm method is designed to produce a synthetic storm from statistical precipitation data. This method is designed to use data collected from the maps along with other information to compute a hyetograph for each subbasin, and to accept partial or annual duration precipitation depth-duration data. The records from Ain Sefra rainfall station were obtained and analyzed to establish the IDF curves based on extreme value, in order to evaluate the watershed reaction to a given rainfall event. In this study, it is assumed that the entire watershed would receive the same amount of design rainfall. The rainfall IDF results adopted for the area for various storm durations and ARI are listed in Table 7. The storm durations of 1, 2, 3, 4, 5, 6 and 24 hours are used in the simulations.
Table 7. Design storm rainfall intensity (mm/hr) for various duration (hours)
Duration (Hrs) 1 2 3 4 5 6 12 24
ARI Rainfall intensity (mm/h)
10 21.9 27.0 30.5 33.2 35.5 37.5 46.2 56.9
50 34.6 42.6 48.1 52.5 56.1 59.2 72.9 89.8
100 40.9 50.3 56.8 61.9 66.2 69.9 86.1 106.0
1000 64.0 78.8 89.0 97.0 103.7 109.5 134.8 166.0
4. RESULTS AND DISCUSSION
The selected historical event for the control was the flood of 24th October 2000, measured by the National Agency of Hydric Ressources (ANRH) which records maximum peak discharges (750.84m3/s), and that represent the flood of 50 year recurrence interval according to the frequency analysis with the statistical Gumbel method. After the first simulation with HEC-HMS, we obtained the Figure 10 that illustrated the difference between simulated and observed hydrographs for the event of 24th October, 2000. The figure indicates that the simulated hydrograph underestimates the peak discharge; it can be observed that simulated peak discharge is 622.5m3/s; however the observed peak discharge is about 750.84m3/s.
Fig.10. Observed and simulated hydrographs for Ain Sefra watershed in HEC-HMS before
calbiration
4.1. Calibration
Model calibration is a systematic process of adjusting model parameter values until model results match acceptably the observed data. The precipitation-run-off models, this function measures the degree of variation between computed and observed hydrographs [30]. The purpose of calibration is to identify the parameters whose variation causes significant changes in the outputs of the model. For the calibration of the generated simulation in the present study, the measured peak discharges of 750.84m3/s is used to enhance the difference between the simulated and observed discharge hydrograph. In our case we have to choose the CN, Impervious, and Lag time parameters. Table 8 shows the corresponding parameters for calibration for each sub-catchment.
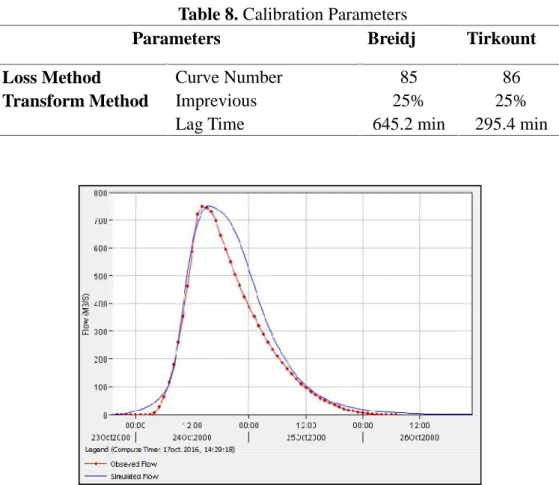
After the calibration, we obtained the figure 11 that illustrated the difference between simulated and observed hydrographs at the outlet of Ain Sefra watershed. The figure 11 indicates that the simulated hydrograph and are very close to the observed hydrographs. The simulated peak discharge and the observed peak discharge are 750.6m3/s, 750.48m3/s respectively, noting that the peak discharge calculated by Gumbel approch is 731m3/s. The performance of the HEC-HMS model is evaluated using the Nash-Sutcliffe efficiency coefficient [31], NSE, given by Equation 5, which ranges from negative infinity to 1.0. An NSE value of 1.0 means a good agreement between the observed and predicted hydrographs [32]. After calculating the NSE, we concluded that the simulated discharge hydrograph
obtained using the HEC-HMS model is perfectly matched by the observed discharge hydrograph with Nash-Sutcliffe coefficient value of 0.95.
= 1 −
∑ , ,∑ , (5)
Where: Qi,Simis the simulated discharge at time t=i, Qi,Obsis the observed discharge at time t=i,
QObsis the average observed discharge; N is the number of observations.
Table 8. Calibration Parameters
Parameters Breidj Tirkount
Loss Method Curve Number 85 86
Transform Method Imprevious 25% 25%
Lag Time 645.2 min 295.4 min
Fig.11. Observed and simulated hydrographs for Ain Sefra watershed in HEC-HMS after
calibration
4.2.Exploitation of the model.
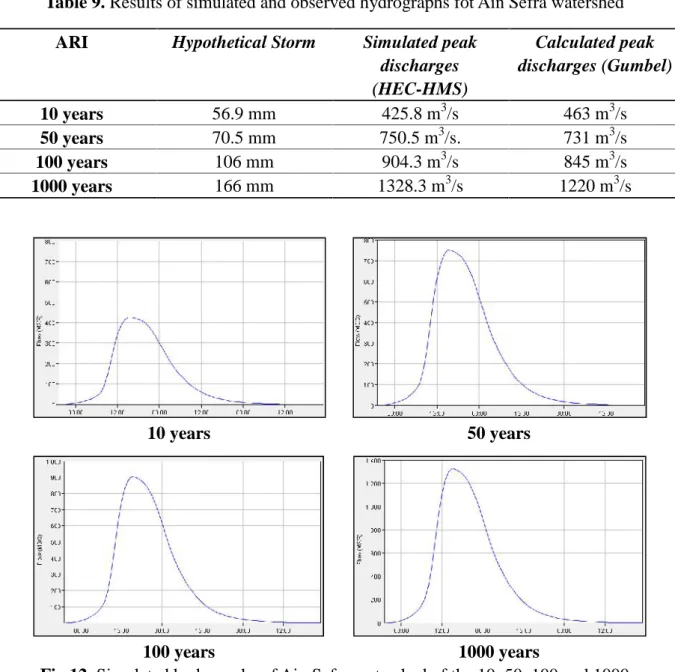
After the calibration and validation of the model, we simulate various hypothetical storm events for various ARI’s (10, 50, 100 and 1000 years) to obtain their corresponding hydrograph. We note that the simulated peak discharges obtained by HEC-HMS were close with those derived by Gumbel approch. The results are listed in Table 9 and Figure 12.
Table 9. Results of simulated and observed hydrographs fot Ain Sefra watershed ARI Hypothetical Storm Simulated peak
discharges (HEC-HMS) Calculated peak discharges (Gumbel) 10 years 56.9 mm 425.8 m3/s 463 m3/s 50 years 70.5 mm 750.5 m3/s. 731 m3/s 100 years 106 mm 904.3 m3/s 845 m3/s 1000 years 166 mm 1328.3 m3/s 1220 m3/s 10 years 50 years 100 years 1000 years
Fig.12. Simulated hydrogaphs of Ain Sefra watershed of the 10, 50, 100 and 1000
return period
The calibrated HEC-HMS model were also used to estimate direct runoff volume, and the peak discharges for the two ungauged sub-catchments (Breidj and Tirkount) of Ain Sefra watershed for various average recurrence intervals ARI’s (10, 50, 100 and 1000 years).
The Peak discharges (m3/s) and volumes (millions m3) for the sub-catchments, are listed in Table 10. The figure 13 show the simulated hydrogaphs of sub-catchments (Breidj and Tirkount) for the 24th October 2000 flood event. The peak discharges and volumes for the sub-catchments Breidj and Tirkount are repectively: 532.9m3/s and 393m3/s, 35.4 millions
cubic meters and 15.5 millions cubic meters. This difference is due mostly to topography condition and the catchment area (Tirkount sub-catchment area: 579.55 km2, Breidj sub-catchment area: 1373.44 km2).
Table 10. Peak discharges(m3/s)and volumes(Hm3)for the sub-catchments
ARI Parameters Breidj
Sub-Catchment
Tirkount Sub-Catchment
Outlet (Ain Sefra) 1000 years Peak discharges (m3/s) 943.5 687.3 1328.3
Volume (Hm3) 62.51 26.97 89.48
100 years Peak discharges (m3/s) 641.9 473 904.3
Volume (Hm3) 42.52 18.52 61.04
50 years Peak discharges (m3/s) 532.8 393.2 750.5
Volume (Hm3) 35.42 15.51 50.93
10 years Peak discharges (m3/s) 301.1 227 425.8
Volume (Hm3) 20.11 8.9 29.01
Breidj sub-catchment Tirkount sub-catchment
Fig.13. Simulated hydrogaphs of sub-catchments of Ain Sefra watershed for the event of 24th
October 2000.
5. CONCLUSION
In this study, DEM data of 30 m resolution was used for Ain Sefra watershed delination and catchment characteristics using the extension ArcHydro in Arc GIS. Geological, soil and land use data used to well-understand the nature the watershed. The HEC-HMS hydrologic modeling software was applied to Ain Sefra watershed located in southwestern Algeria to predict the surface runoff. The SCS curve number loss method was used to determine the hydrologic losses from the study area and SCS unit hydrograph method was used for effective
rainfall transformation. The model parameters were calibrated against measured runoff event of 24thOctober, 2000. The daily Nash and Sutcliffe efficiency (NSH) was used to estimate the goodness of fit between the observed stream flow and modeled stream flow. The results obtained are satisfactory. Therefore, runoffs generated from frequency storm method will be invaluable for the next study of flood hazard and risk assessment in Ain Sefra city using HEC-RAS.
As there are plenty of ungauged rivers located in the semi arid zone in Algeria, The presented methodology could be allowed an acceptable estimation of the runoff in areas with similar conditions.
6. REFERENCES
[1] Guha-Sapir D., Hoyois Ph. and Below R. Annual Disaster Statistical Review 2014: The Numbers and Trends. Brussels: CRED; 2015: 50 p.
[2] Guenifi D. Gestion risque inondation : Application réglementaire pour la sauvegarde des personnes et des biens. Actes des journées techniques des risques naturels : Inondation, Prévision, Protection. Batna 15-16 Décembre, 2004:58-62 pp.
[3] Wheater H., Sorooshian S., Sharma K.D., Hydrological modelling in arid and semi-arid
areas. Cambridge University Press, Cambridge UK (Eds.), 2008: 223p. DOI:
10.1017/CBO9780511535734
[4] Shah S. M. S., O'Connell P. E. and Hosking J. R. M. Modelling the effects of spatial variability in rainfall on catchment response: Formulation and calibration of a stochastic rainfall field model. Journal of hydrology, 1996, v. 175: 67-88.
[5] Clarke R.T., A review of some mathematical models used in hydrology with observations on their calibration and use. Journal of hydrology, 1973, vol.19: 1-20.
[6] Ambroise B., La dynamique du cycle de l’eau dans un bassin versant. Processus, Facteur, Modèles. H.G.A. (Ed.), Bucarest, 1998, 206 p
[7] Sintayehu L.G., Application of the HEC-HMS Model for Runoff Simulation of Upper Blue Nile River Basin. Hydrol Current Res 6, 2015, 1-9, doi:10.4172/2157-7587.1000199 [8] Norhan A., Saud T., Fahad A., Kamarul A., Arid hydrological modeling at wadi Alaqiq,
Madinah, Saudi Arabia. Jurnal Teknologi. 2016, 51-58, doi: 10.11113/jt.v78.4516
[9] Sampath D. S., Weerakoon S. B. and Herath S., HEC-HMS Model for Runoff Simulation in a Tropical Catchment with Intra-Basin Diversions Case Study of the Deduru Oya River
Basin, Sri Lanka. J. ENGINEER, Vol. XLVIII, No. 01. 2015, 1-9. doi:
10.4038/engineer.v48i1.6843
[10] Meiling W., Lei Z., Thelma D B., Hydrological Modeling in A Semi-Arid Region Using HEC-HMS.Journal of Water Resource and Hydraulic Engineering. 2016, Vol. 5 Iss. 3, 105-115, doi: 10.5963/JWRHE0503004
[11] Laouacheria F. and Mansouri R., Comparison of WBNM and HEC-HMS for Runoff Hydrograph Prediction in a Small Urban Catchment. Water Resour Manage.2015, 29, 2485-2501, doi 10.1007/s11269-015-0953-7
[12] Derdour A., Bouanani A. and Baba-Hamed K., Utilisation d’un SIG pour l’évaluation des
caractéristiques physiques d’un bassin versant et leurs influences sur l’écoulement des eaux (Bassin versant d’Ain Sefra, Sud-Ouest Algérien). Séminaire sur le développement des sciences, de la vie et de l’univers. Tlemcen 14-15 Mai, 2013. p 227.
[13] Kacemi A., Evolution lithostructurale des Monts des Ksour (Atlas Saharien, Algérie) au cours du Trias et du Jurassique : Géodynamique, typologie du bassin et télédétection. Thèse de Doctorat en Sciences. Université Abou BakrBelkaid ; Tlemcen, Algérie. 2014. p249. [14] Cornet A. et Deleau P., Carte géologique au 1/500.000. Publiée par le service de la Carte
Géologique d’Algérie. 1951.
[15] Rahmani A., Apport des S.I.G dans la caractérisation hydrodynamique et hydrochimique
de la nappe du crétacé inférieur de la région d’Ain Sefra (Atlas Saharien Occidental- Algérie).
Mémoire de Magister Université de Tlemcen. 2010. p 105.
[16] Douihasni M., Etude géologique de la région d’Ain Ouarka-Bousemghoun (partie centrale des Monts des Ksour). Stratigraphie et Analyse stucturale. Thèse 3éme cyc. Univ. Oran. 1976, p 272.
[17] Galmier D. Photogéologie de la région d’Ain Sefra (Atlas Saharien, Algérie). Thèse
Doctorat d’état. Fasc. Sc. De Paris. 1970, p 320.
cas de la Wilaya de Naama (Algérie). Thèse de Doctorat Université Joseph Fourier Grenoble 1. 2007, p 319.
[19] Djebaili S. Steppe Algérienne phytosociologie et écologie. Alger, office des publications universitaires. 1984, p178.
[20] Pouget M. Cartographie des zones arides. Note explicative Office de la Recherche Scientifique et Technique Outre-mer ORSTOM, Paris. 1977, p101.
[21] Gordo B. Contribution à l’analyse phytoécologique de la région d’Ain Sefra (Naama). Mémoire de Magister Université d’Oran. 2014, p141.
[22] Derdour A. Modélisation hydrodynamique de la nappe des grès Crétacé de Remtha. Monts des Ksour. Mémoire de Magister Université de Tlemcen. 2010, p101.
[23] Scharffenberg W. A. and Fleming M. J.,“Hydrologic Modeling System HEC-HMS v4.2: Users Manual, US Army Corps of Engineers, Hydrologic Engineering Center, Davis, CA, 2016. p 614.
[24] Scharffenberg W. A. and Fleming M. J. Hydrologic Modeling System HEC-HMS v3.5: Users Manual. US Army Corps of Engineers, Hydrologic Engineering Center, Davis, CA, 2010. p 318.
[25] McCuen, R. H., A guide to hydrologic analysis using SCS methods, Englewood Cliffs, N.J., Prentice-Hall, 1982. 145p.
[26] NRCS, USDA Natural Resources Conservation Service, National Engineering Handbook: Part 630 – Hydrology. Chapter 7 Hydrologic Soil Groups. p14.
[27] Aquaveo. WMS 9.1 Tutorial. Watershed Modeling – Time of Concentration Calculations and Computing a Composite CN, 2012. p14.
[28] USGS, Estimating Basin Lagtime and Hydrograph-Timing Indexes Used to Characterize Stormflows for Runoff-Quality Analysis, Scientific Investigations Report, 2012. p58.
[29] Giandotti, M., 1934. Previsione delle piene e delle magre dei corsi d’acqua. Istituto
Poligrafico dello Stato, 8, 107–117.
[30] Cunderlik J. M. and Simonovic S. P. Calibration, verification, and sensitivity analysis of the HEC-HMS hydrologic model, CFCAS project. Water Resources Research Report, Project report IV, The University of Western Ontario, 2004. p 113.
[31] Nash JE, Sutcliffe JV (1970) River flow forecasting through conceptual model. Part 1: a discussion of principles. J Hydrol, 1970: 282–290.
[32] Moriasi D.N., Arnold J. G., Van Liew M. W., Bingner R. L., Harmel R. D. and Veith T. L. Model evaluation guidelines for systematic quantification of accuracy in watershed simulations American Society of Agricultural and Biological Engineers , 2007 Vol. 50(3): 885−900
How to cite this article:
Derdour A, Bouanani A and Babahamed K. Hydrological modelling in semi arid region using HEC-HMS model: case study in Ain Sefra watershed, Ksour Mountains (SW- Algeria).