HAL Id: hal-02051121
https://hal.archives-ouvertes.fr/hal-02051121
Submitted on 27 Feb 2019HAL is a multi-disciplinary open access
archive for the deposit and dissemination of sci-entific research documents, whether they are pub-lished or not. The documents may come from teaching and research institutions in France or abroad, or from public or private research centers.
L’archive ouverte pluridisciplinaire HAL, est destinée au dépôt et à la diffusion de documents scientifiques de niveau recherche, publiés ou non, émanant des établissements d’enseignement et de recherche français ou étrangers, des laboratoires publics ou privés.
Electrochemical Evaluation of Pb, Ag, and Zn
Cyanamides/Carbodiimides
Jeethu Arayamparambil, Markus Mann, Xiaohui Liu, Maria Alfredsson,
Richard Dronskowski, Lorenzo Stievano, Moulay Tahar Sougrati
To cite this version:
Jeethu Arayamparambil, Markus Mann, Xiaohui Liu, Maria Alfredsson, Richard Dronskowski, et al.. Electrochemical Evaluation of Pb, Ag, and Zn Cyanamides/Carbodiimides. ACS Omega, ACS Publications, 2019, 4 (2), pp.4339-4347. �10.1021/acsomega.8b02748�. �hal-02051121�
Electrochemical Evaluation of Pb, Ag, and Zn Cyanamides/
Carbodiimides
Jeethu Jiju Arayamparambil,
†,‡Markus Mann,
§Xiaohui Liu,
§Maria Alfredsson,
∥Richard Dronskowski,
*
,§Lorenzo Stievano,
*
,†,‡,⊥and Moulay Tahar Sougrati
*
,†,‡,⊥†Institut Charles Gerhardt Montpellier, ICGM, Univ. Montpellier, CNRS, 34095 Montpellier, France ‡Alistore European Research Institute, CNRS, 80039 Amiens, France
§Chair of Solid-State and Quantum Chemistry, Institute of Inorganic Chemistry, RWTH Aachen University, 52056 Aachen, Germany
∥School of Physical Sciences, University of Kent, CT2 7NH Canterbury, United Kingdom ⊥Réseau sur le Stockage Electrochimique de l’Energie, RS2E, CNRS, 80039 Amiens, France
*
S Supporting InformationABSTRACT: PbNCN, Ag2NCN, and ZnNCN were tested as negative
electrode materials for Li-ion batteries. A thorough analysis of the electrochemical mechanism by X-ray diffraction and X-ray absorption spectroscopy showed that, unlike transition metal carbodiimides, these compounds react with lithium via a two-step reaction, starting with conversion followed by alloying. The conversion reaction is highly irreversible for the three compounds, whereas the reversibility of the alloying reaction depends on the metal, that is, highly irreversible for PbNCN and Ag2NCN which contain the cyanamide group (NC−N2−) and more
reversible for ZnNCN containing carbodiimide (−NCN−). In the case of the more covalent, cyanamide-type PbNCN and Ag2NCN, the conversion
reaction occurs at a higher voltage compared to the more ionic, carbodiimide-type ZnNCN, correlated with the nature of bonding in the
NCN group and in the phases themselves. Compared to transition metal carbodiimides, these materials show rather low performance, with no improvement in capacity as it would have been expected from the combination of conversion and alloying.
1. INTRODUCTION
Today’s world is at a turning point, electricity and trans-portation are nowadays crucial from people’s daily life to industrial production. This growing demand for energy makes Li-ion batteries the best candidate for practically all portable electronic applications. The current choice of the negative electrode material for lithium-ion-batteries is graphite due to its appealing properties, such as long cycle life, abundancy, and low cost. However, the graphite anode has two main disadvantages, that is, low-energy density and safety. For this reason, there has been a growing interest in developing an alternative cost-effective anode material with high-energy density and long cycle life.1
Several families of negative electrode materials have been investigated so far, and among them, transition metal-based compounds based on the conversion reaction appeared to be a reasonable alternative for graphite owing to their high specific capacity.2,3 Compounds with the formula MX, where M is a divalent or a trivalent metal and X = O, S, PO4, and CO3, have
been reported to be electrochemically active at an average voltage of around 1 V.4−17 In spite of their high theoretical specific capacities, the high irreversible capacity in the first
lithiation and the short cycle life prevents their practical use in commercial batteries. The main reasons of such limitations rely, inter alia, on the nature of the solid electrolyte interphase (SEI) as well as the high volume expansion inherent to conversion materials.18
Recently, a class of divalent transition metal compounds, known as transition metal carbodiimides (MNCN, with M = Fe, Mn, Co, Cu, Zn, Ni), have been reported for their electrochemical activities vs Li and Na ion by different groups.19−22 In particular, they show an excellent cycle life, even though they suffer from high initial irreversible capacity and relatively high operating potential, like all divalent transition metal-based electrode materials. Despite showing interesting physico-chemical properties, only a limited number of alternative cyanamides/carbodiimide phases have been explored and compared with transition metal carbodii-mides.23−30 Received: October 10, 2018 Accepted: February 14, 2019 Published: February 27, 2019 Article http://pubs.acs.org/journal/acsodf Cite This:ACS Omega 2019, 4, 4339−4347
License, which permits unrestricted use, distribution and reproduction in any medium, provided the author and source are cited.
Downloaded via UNIV MONTPELLIER on February 27, 2019 at 14:33:09 (UTC).
The aim of this work is thus to study the electrochemical lithiation mechanisms of PbNCN, Ag2NCN, and ZnNCN by a
combination of long-range and short-range techniques, such as X-ray diffraction (XRD) and X-ray absorption spectroscopy (XAS),31 and to evaluate their performance as negative electrode materials for Li-ion batteries. In contrast to their transition metal analogues, these three phases are excellent model materials to investigate the possibility of combining the alloying mechanism of Pb, Ag, and Zn with the conversion reaction, possibly leading to higher specific capacities compared to transition metal carbodiimides. It is worth recalling that even if the three metals are not commonly used in Li-ion technology, they are commonly used in industrial energy storage for other technologies such as Pb− acid, Ag−Li, Zn−Ag2O, and Zn−air.
2. RESULTS AND DISCUSSION
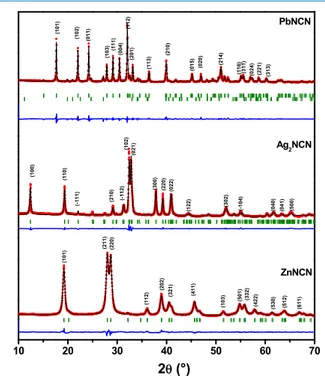
2.1. Characterization of Materials. Figure 1shows the X-ray diffraction (XRD) pattern of the obtained Ag2NCN,
PbNCN, and ZnNCN. All diffraction patterns reveal sharp reflections, suggesting that the powders are highly crystalline in agreement with the previous reports. PbNCN peaks are indexed in the orthorhombic Pna21space group (JCPDS No.
72-1116) with lattice parameters of a = 5.557 Å, b = 3.868 Å, c = 11.735 Å, and a small amount of lead carbonate hydroxide (∼5%).23 Ag2NCN can be indexed in the monoclinic P21/c
space group with lattice parameters of a = 7.315 Å, b = 6.010 Å, c = 6.684 Å, and β = 102.29° (JCPDS No. 70-5232).27 Finally, ZnNCN is indexed in the tetragonal I4̅2d space group with lattice parameters a = b = 8.800 Å and c = 5.432 Å (JCPDS No. 70-4898), like Ag2NCN no crystalline impurities
were detected for ZnNCN.32
Raman spectroscopy was used to gather additional information about the nature of cyanamide bonding in the three compounds (Figure S1). As reported earlier, the [NCN]2−moiety can exist in two forms, that is, the symmetric form −NCN−, usually called carbodiimide, and the asymmetric form NC−N2−, called cyanamide. Four internal vibration modes are expected for both moieties, that is, the symmetric (νs) and anti-symmetric (νas) stretching modes and two bending modes, which are, usually, degenerated in the gas/ liquid phase, giving rise to a single δ band. In the case of carbodiimide, only the symmetric stretching (νs) mode is
active in Raman spectroscopy (and inactive in infrared spectroscopy), whereas all the vibrations of cyanamide (νs,
νas, and δ) are expected to be active in both Raman and
infrared spectroscopy.36Such considerations, which are valid in the gas/liquid phase may, however, change in the solid state, where some vibrations may become active due to the lowering of the local symmetry in the lattice. For the same reason, also some usually degenerate internal vibrations can split in the solid state. Moreover, the existence of crystallographically different [NCN]2− groups in the lattice may increase the number of observed bands.
In this case, the crystal structures of the three compounds are rather simple, and a single crystallographic [NCN]2−group exists for ZnNCN, Ag2NCN, and PbNCN. For the first
compound, the two N−C bond distances are equal to 1.2 Å, indicating the presence of carbodiimide moieties. In contrast, two different N−C bond lengths exist in the structures of Ag2NCN (1.19 and 1.27 Å) and PbNCN (1.16 and 1.30 Å),
indicating the presence of cyanamide. The different types of [NCN]2−found in these compounds are in full agreement with the results of Raman spectroscopy (cf.Table S1). In fact, the bands corresponding to all the vibrations are visible only in the Raman spectra of Ag2NCN and PbNCN, in agreement with
the literature.21,37 The presence of the three bands is the spectroscopic signature of the asymmetric cyanamide (even though carbodiimide and cyanamide were suggested to coexist
Figure 1.XRD pattern with indexed peaks of PbNCN, Ag2NCN, and
ZnNCN. The red dots correspond to the experimental patterns, the black lines to the calculated patterns, the green sticks to the theoretical Bragg positions, and blue lines to the difference between experimental and calculated patterns.
Figure 2.SEM micrographs and TGA curve of PbNCN (a), Ag2NCN (b), and ZnNCN (c).
ACS Omega Article
DOI:10.1021/acsomega.8b02748
ACS Omega 2019, 4, 4339−4347
in Ag2NCN).24 Apart from the characteristic peaks of the [NCN]2−unit, additional peaks in the region at∼1000 cm−1in PbNCN may arise from the impurity phase detected by X-ray diffraction.36 The asymmetric vibration (νas), however, is
absent in the Raman spectrum of ZnNCN and this absence confirms the presence of [NCN]2−in the form of carbodiimide in this compound.
Figure 2shows typical scanning electron microscopy (SEM) images and thermogravimetric analysis (TGA) curves (in air) of the as-synthesized Ag2NCN (a), PbNCN (b), and ZnNCN
(c). PbNCN powder has a flower-like morphology with an average size distribution of around 3−6 μm, whereas Ag2NCN
is made of rectangular particles with a smooth surface, with a size of around 300−700 nm in length and 50−300 nm in width. ZnNCN is more cauliflower-like,38 with homogenous aggregates around 3−6 μm. In terms of thermal stability in air, the three compounds are stable up to an average temperature of 400°C, i.e., stable enough to be used as electrode materials in batteries.
2.2. Electrochemical Properties vs Li. Cyclic voltamme-try (CV) and galvanostatic profiles at C/10 (∼10 mA g−1for PbNCN and Ag2NCN, 25 mA g−1 for ZnNCN) in the
potential range 0.005−3.00 V of the first two cycles for the three materials are shown inFigure 3. For PbNCN, a reduction
peak is observed at 1.35 V during the first lithiation which compares well to the reduction potential of PbO (1.31 V39), and hence suggesting an analog conversion of PbNCN into Pb and Li2NCN. Similar to PbO, the alloying reactions of Pb occur below 0.5 V. During charge, the oxidation of Pb occurs at a higher voltage (2−3 V). During the second lithiation, a slight increase in the reduction potential (1.5 V) is observed and may be explained by an improved electronic/ionic diffusion due to the electrochemically produced nanostructura-tion of the electrode, commonly observed in conversion/ alloying reactions.
Ag2NCN exhibits a reduction peak at 1.75 V, in analogy with the first plateau observed in the corresponding galvanostatic profile. Such high reduction potential was also reported long ago by Cignini and Pistoia for the oxide analogue Ag2O.40
These authors interpreted the occurrence of two plateaus as a sign of Li intercalation before proceeding the conversion reaction. In the case of Ag2NCN, only one plateau is observed suggesting no significant intercalation step but only the conversion reaction to form the metal phase along with Li2NCN.22,41,42The other cathodic and anodic peaks at below
1 V can be assigned to the expected alloying reactions.42,43The lower potential peaks of PbNCN are well defined both in cathodic and anodic scan, whereas in Ag2NCN the anodic scan
is better defined with two symmetric peaks at 0.12 and 0.3 V, and can be ascribed to the expected formation of two different Li−Ag alloys during charge.44Considering the second cycle in CV, the higher potential plateau around 1.8 V is completely absent in Ag2NCN, but in PbNCN it exists with a reduced
magnitude and this can be seen in the galvanostatic profile as well. This shows that the conversion reaction is not reversible in Ag2NCN in the 0.01−3.00 V range, whereas it could be partially reversible PbNCN. However, from the combined analysis of both curves of Ag2NCN, the reaction does not seem
completed at 3 V, and thus additional reactions occur if the voltage window is extended to higher potentials (cf. Figure S2). Indeed, a reduction potential higher than 3 V has been reported for Ag+ to Ag by Li et al.45Such potentials, on the other hand, are very high and beyond the possible application of such a material as a negative electrode, and are thus disregarded in this paper. In the case of ZnNCN, the CV profile is very similar to that of ZnO with virtually no activity above 1.2 V.46 The plateau at ∼0.4 V in the galvanostatic profile (0.1 V in CV) can be attributed to a combination of (1) conversion to Zn and Li2NCN
20,22
and (2) lithiation of Zn to form Li−Zn alloys, in analogy with the reaction mechanism of ZnO.6 The peak around 1.4 V in thefirst anodic scan can be assigned to metallic Zn oxidation and Li2NCN decomposition,
as observed in the case of ZnO.6
As a general rule, conversion materials suffer from a significant irreversible capacity in the first cycle.2,47 The three materials investigated here do not escape this rule, the huge capacities in the initial discharges being only partially reversible (30−50%). The extra initial capacity can be explained in terms of electrolyte decomposition with the expected formation of a solid electrolyte interphase (SEI) and of a polymeric gel-type layer at low potentials.48
Concerning cyclability, (Figure 4) a drastic capacity fading is observed for both PbNCN and Ag2NCN, due to the low
reversibility of high potential conversion reaction. Hence, the remaining capacity is mainly associated with alloying reactions at low potentials, as confirmed by the separate study of the two potential regions shown inFigure S2. In the case of lead, a similar mechanism is observed for the sulfur analogue PbS.42 Even though ZnNCN suffers from capacity fading, it exhibits a better performance compared to the other two materials, retaining a capacity close to 350 mAh g−1after 10 cycles. The results obtained for ZnNCN are in very good agreement with those reported previously.20−22
In conclusion, although PbNCN, Ag2NCN, and ZnNCN are found to be electrochemically active vs Li, none of them could be compared to the transition metal carbodiimides in terms of cycle life.22
Figure 3.Cyclic voltammetry (0.05 mV s−1) and the corresponding galvanostatic profile (C/10, corresponding to 1 mol of Li reacted per mole of compound in 10 h) of (a) PbNCN, (b) Ag2NCN, and (c)
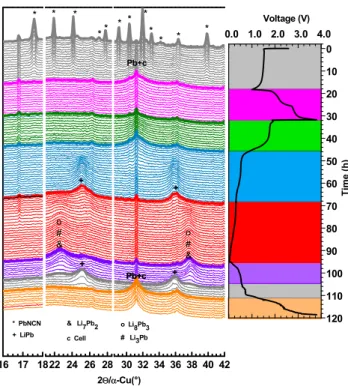
2.3. Reaction Mechanism. 2.3.1. PbNCN. Operando XRD was applied to better understand the electrochemical mechanism of PbNCN while cycling at C/8 (Figure 5). To
evaluate the reversibility of conversion before and after the lithiation of lead, the cell was first discharged down to 1 V (first plateau), then charged up to 4 V, discharged to 0.005 V, andfinally charged again at 4 V. The intensity of the diffraction pattern of PbNCN gradually decreases with the amount of reacted lithium during thefirst discharge. No new diffraction peaks are observed and only a gradual broadening around 31.5° (cf. zoom in Figure S3d) is detected, in line with the formation of amorphous Pb metal.49 During thefirst charge from 1 to 4 V, there is no distinct formation of crystalline PbNCN. However, the modifications of the diffraction pattern suggest the formation of an amorphous and/or nanostructured form of PbNCN, that is, (i) the decrease of the intensity of amorphous Pb at 31.5° and (ii) the increase of the background intensity in the 20−24° region which includes (101), (102), and (011) PbNCN diffraction peaks (cf. Figure S3b). During
the second discharge, the main peak of Pb slowly disappears at low potential starting from ∼0.5 V, whereas two new broad humps grow at 25.2 and 35.7°, testifying the formation of poorly crystallized LiPb.42,49,50 These profiles reach their maximum intensity at 0.35 V and then decrease with decreasing potential. Several other weak peak changes occur until the end of the discharge, where two main broad peaks are observed at 22.5 and 37.7°. It is difficult to distinguish the final phase between Li10Pb3 and Li7Pb2, since both phases show diffraction peaks at such values of 2θ (Figure S3c).
Moreover, such broad peaks might also hide the contributions of other coexisting intermediate phases such as Li8Pb3 and Li3Pb.42,49,50 This lower potential alloying mechanism is found to be completely reversible upon next charging by the sequential reformation of all the Li−Pb phases andfinally Pb at 0.8 V. The high voltage conversion reaction is only partially reversible, that is, the partial oxidation of Pb at this high voltage is testified by the gradual decrease of the intensity of the Pb peak (Figure S3d), whereas the formation of amorphous PbNCN can be hinted from the growth of a large peak at the typical positions of PbNCN reflections (Figure S3c).
Complementary information on the mechanism is provided by ex situ XAS.Figure 6a,b shows a typical galvanostatic profile
for PbNCN and the corresponding Fourier transform of the Pb L3-edge extended X-ray absorption fine structure (EXAFS)
spectra, respectively. The EXAFS signal clearly shows the changes starting from pristine PbNCN and the subsequent discharge and charged states.
The intensities of the peaks at 1.59, 2.35, 3.04, and 3.88 Å in the spectrum of pristine PbNCN decrease after thefirst plateau (D1), showing the consumption of PbNCN to form metallic Pb. At the D2 position, the shape of the spectrum changed significantly and the two peaks of metallic Pb at 1.70 and 3.50
Figure 4.Specific discharge capacity and coulombic efficiency versus cycle number for PbNCN, Ag2NCN, and ZnNCN.
Figure 5. Operando XRD and associated galvanostatic charge/ discharge curve of PbNCN.
Figure 6.Galvanostatic profile (a), |χ(R)| plots (b) and fits of the EXAFS R-space portion of the ex-situ data of PbNCN in (c). Blue and black circles are experimental real and imaginary parts, respectively. Black and red lines arefitted real and imaginary parts respectively.
ACS Omega Article
DOI:10.1021/acsomega.8b02748
ACS Omega 2019, 4, 4339−4347
Å dominated the spectrum.51At the end of the discharge, the spectrum changes again indicating the formation of lithium-lead alloys. In thefirst charged state (C3), the reappearance of peaks at 1.70, 3.00, and 3.72 Å and the slight variation in the Pb−Pb peak, point to the partial reformation of PbNCN. The variations in intermediate states C1 and C2 could be linked to alloying and de-alloying of Li−Pb phases.
Figure 6c shows the fitting results obtained in the R-space andTable S3shows the correspondingfitting parameters. The pristine state was fitted starting from the orthorhombic structure of PbNCN23 and the bond distances coincides perfectly with the theoretical values. For the second and the fourth shell, however, high σ2values are observed, indicating either a slightly disordered or partially amorphized structure, or more probably the presence of some lead carbonate as an impurity. The optimumfit for the next two intermediates D1 and D2 is obtained by using a mix of PbNCN and metallic Pb. The fitting of D2, the very small differences in the Pb−Pb distance between LiPb and Pb, and the low X-ray scattering amplitude of Li make the two phases virtually impossible to distinguish by EXAFS. Both fittings, considering either the bond distances in LiPb or with the bond distance in Pb provided exactly the same quality offit. Therefore, as seen in the operando XRD, we suspect the formation of LiPb at this voltage. The lithium-lead alloy phase formed at the end of discharge was best fitted using the structure of Li10Pb3, the high value for σ2 indicates a slightly amorphized structure. Upon charging, thefirst point C1 was fitted well using metallic Pb and then C2 and C3 were fitted with metallic Pb and PbNCN, which reaches a concentration of 65% at 3.5 V.
According to several reports on the Li−Pb systems,41,42,49,50 the lithium-richest formed phase is expected to be Li4.4Pb.
However, in this case both operando XRD and ex situ XAS analysis agree that lithiation ends with the composition Li3.5Pb.
Taking into account the consumption of lithium relative to the formation of the SEI during the first lithiation,48 such composition is compatible with the galvanostatic results, where 5.5 reacted Li per mole of PbNCN during the 2nd lithiation can be assumed as 2Li for the conversion reaction and 3.5 L for the alloying one.22
2.3.2. Ag2NCN. The lithiation mechanism of Ag2NCN was
also investigated by ex situ XRD (Figure 7) and XAS (Figure 8). At the end of thefirst reduction plateau at 2 V, the XRD pattern of Ag2NCN has almost vanished at the benefit of
broadened peaks at 38.06°, typical of silver metal.44 The
diffraction pattern of silver persists even at the end of the first discharge, even though a shift in the peak position is observed, possibly due to the insertion of some lithium in the crystal structure of silver. Indeed, a large solubility domain for lithium in silver, up to about 50 atom % of lithium, is expected from the binary phase diagram of the two metals.52During charge, two additional weak diffraction peaks are observed at 39.4 and 40.5° when reaching 0.3 V, suggesting the formation of a new Li−Ag alloy that is not observed during lithiation. This new phase is not reported in the previously cited phase diagram, but resembles strongly to the tetragonal AgLiyphase, of unknown composition, reported by Morales et al. at the end of lithiation of a thin metallic silverfilm.44During the charge, there is no sign of reformation of Ag2NCN up to 3.0 V.
The Fourier transform of the Ag K-edge EXAFS spectra of the electrodes at different discharge and charge states along with the corresponding galvanostatic profile is shown inFigure 8. Large differences are observed between pristine Ag2NCN
and all the cycled samples. During thefirst discharge, the Ag− N shell at 1.6 Å disappears and is replaced by the dominant Ag−Ag shell at 2.01 and 2.77 Å. The slight evolution of the Ag−Ag peak in the following spectra is probably due to the formation of Li−Ag alloys, but no formation of Ag2NCN is visible at the end of charge. Fitting results are shown inFigure 8c, while Table S3 summarizes the corresponding fitting parameters. The spectrum of pristine Ag2NCN was perfectly
fitted using the monoclinic Ag2NCN crystal structure. 27
The spectrum obtained at 1.1 V during discharge was fitted with 80% metallic Ag and a residual amount (20%) of Ag2NCN. At the end of the discharge, about half of this metallic Ag is transformed into AgLi.53Similarfits are obtained for the two spectra measured during charging, that is, a minor amount (about 25%) of Ag2NCN has to be added in thefitting strategy to obtain a reasonable fit, indicating that small amounts of Ag2NCN could be formed back at 4 V.
2.3.3. ZnNCN. The ex situ XRD pattern measured for ZnNCN at different states of discharge/charge is shown in
Figure 9. As seen in the galvanostatic profile, the lithium reaction takes place at ∼0.4 V. At 0.2 V, ZnNCN has completely reacted with Li to form only amorphous species.
Figure 7.Ex situ XRD patterns of Ag2NCN at different lithiation
stages.
Figure 8.Galvanostatic profile (a), |χ(R)| plots (b) and fits of the EXAFS R-space portion of the ex-situ data of Ag2NCN in (c). Blue
and black circles are experimental real and imaginary parts, respectively. Black and red lines arefitted real and imaginary parts, respectively.
Unfortunately, the main reflections of Zn and of the Cu current collector appear at the same position (∼43.2°) in the diffraction pattern. However, the broadening at the bottom of the peak clearly indicates the formation of amorphous Zn during the discharge (seeS4).54,55At the end of the discharge, the additional two broad humps around 24.5 and 40° indicate the formation of amorphous Li−Zn alloy.54,55 During the following charge, Li−Zn is reversibly consumed and at the end of delithiation, some diffraction with very broadened patterns close to those of ZnNCN are observed at 19, 28, 36, and 39°, indicating that the reversible conversion takes place to form an amorphous/nanosized form of ZnNCN. It is interesting to notice that the peaks at 36 and 39° are also clearly seen at lower potentials. Their presence is surprising, and might have several origins, that is, it may come from a different unidentified phase or from unequal degrees of lithiation, or even from a different phenomenon such as the anisotropic loss of long-range order following specific preferential orientations. Additional in situ measurements are thus needed to better clarify their evolution.
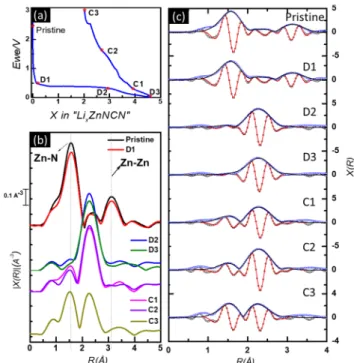
The Fourier transform of the ex situ Zn K-edge XAS data collected for cycled ZnNCN electrodes are shown inFigure 10
along with the corresponding galvanostatic profile. During the first discharge, pristine ZnNCN is slowly converted, as testified by the strong reduction of the intensity of the Zn−N shell for sample D2, coupled to the growth of a new Zn−Zn shell at 2.64 Å, typical of metallic Zn. Virtually no difference is observed between the spectra of samples D2 and D3, indicating that zinc is probably very little involved in the reaction at low potential. This result, therefore, suggests that the additional capacity measured at low potential is mainly due to electrolyte decomposition. Along the following charge, the Zn−N shell starts growing again, indicating the partial recovery of ZnNCN in analogy with previous results on ZnO.6
The results of the fit of the EXAFS spectra are shown in
Figure 10c, whereasTable S5shows the correspondingfitting parameters. The pristine state can be simply fitted starting from the crystallographic parameters of ZnNCN, that is, the bond distances coincide perfectly with the theoretical values.56 Also, the spectrum of sample D1 can be directlyfitted with the same model, confirming that Zn is not yet involved at this stage, and that all reactions at high voltage are probably connected to the decomposition of the electrolyte and the formation of the SEI, most probably stimulated by the high carbon content of the electrode. Sample D2, discharged at 0.3
V, wasfitted using a combination of the first two shells of the metallic Zn and the first shell of ZnNCN. In this case, the metallic Zn fraction largely dominates (87%) and only 13% of ZnNCN is still present in the sample at this potential. The relatively high values of the Debye−Waller factors (σ2) observed for the Zn shells indicate a somewhat disordered or amorphized structure.48 Sample D3 at the end of discharge cannot befitted using simply the structure of the Zn metal and an optimalfit is obtained only by including the first two shells of LiZn. A phase composition of about half Zn and half LiZn is obtained from thefit. All the charged states were fitted using the combination of metallic Zn and ZnNCN, clearly indicating the formation of ZnNCN already from 0.3 V. It is interesting to notice that, unexpectedly, the amount of ZnNCN is larger in sample C1 than in sample D2, that is, this discrepancy can be explained by the presence of some unreacted ZnNCN C1, given that the corresponding slight conversion plateau is slightly shorter than that of the other ex situ samples (cf.
Figure S9). At the end of charge, more than half of the zinc is transformed back into ZnNCN.
From the above findings, the electrochemical reaction mechanism of Li with ZnNCN can be described as a conversion reaction followed by a partial alloying mechanism. By analogy with well-known FeNCN, uponfirst discharge zinc carbodiimide is converted to Li2NCN and metallic Zn, and
then the newly formed metallic Zn is partially lithiated to LiZn. Upon charging, at least a partial back-conversion of Zn to ZnNCN is observed.
2.4. Capacity Fading Mechanism. By combining the results of operando XRD and ex situ XAS along with the electrochemical results, one can try to compare and generalize the electrochemical mechanism of these three materials. Indeed, the lithiation starts with a conversion reaction leading to the formation of metal nanoparticles followed by an alloying reaction. Like all conversion-type materials, huge irreversible
Figure 9. Ex situ XRD patterns of ZnNCN at different lithiation stages.
Figure 10.Galvanostatic profile (a), |χ(R)| plots (b) and fits of the EXAFS R-space portion of the ex-situ data of ZnNCN in (c). Blue and black circles are experimental real and imaginary parts, respectively. Black and red lines arefitted real and imaginary parts, respectively.
ACS Omega Article
DOI:10.1021/acsomega.8b02748
ACS Omega 2019, 4, 4339−4347
capacities in the initial lithiation are observed, probably due to the irreversible electrolyte degradation leading to a SEI layer and the reversible formation an electrolytic polymeric gel.48 Upon delithiation, the de-alloying at low potential is completely reversible, leading to the formation of a metal phase. However, only part of such reformed metal is back-converted to the starting material. In contrast to transition metal carbodiimides (where the metals do not undergo the alloying reaction), the compounds studied here suffer from a more pronounced capacity fading that seems to concern both conversion and alloying reactions.
PbNCN and Ag2NCN show a fast capacity fading during the
early cycles, providing a reversible capacity of less than 200 mAh g−1already after 20 cycles. In the case of ZnNCN, on the contrary, the capacity fading is less pronounced, delivering capacities exceeding 300 mAh g−1after the rate capability test (cf. Figure 4). This difference is correlated to the higher voltage of the conversion reaction (Ag, Pb > Zn) and could also be connected to the nature of the [NCN2−] moiety. In fact, Ag and Pb compounds contain the covalently bonded cyanamide form, whereas [NCN2−] is in the carbodiimide configuration in the more ionic Zn analogue. In this case, the carbodiimide configuration is contained in Li2NCN, which is the species formed during lithiation. Therefore, it might be more advantageous to start from a similar configuration, avoiding its continuous modification upon cycling, to gain reversibility.
Finally, owing to the significant gap between the potentials of conversion and alloying reaction of PbNCN and Ag2NCN, it is possible to separate each contribution by selecting the appropriate voltage window (seeFigure S2a,b). For PbNCN, it is clear that capacity fading is primarily attributed to the conversion reaction since the alloying reaction still delivers 230 mA g−1 (the equivalent of 2Li) after 10 cycles, whereas the conversion reaction delivers less than 50 mA g−1 (the equivalent of 0.4 Li). Similar experiment with Ag2NCN
shows that both conversion and alloying contribution fade at a comparable rate. Such contribution separation is not possible for ZnNCN since the potentials of the two reactions are virtually identical.
3. Conclusions. The electrochemical lithiation of ZnNCN, PbNCN, and Ag2NCN goes through a two-step mechanism,
starting with a conversion reaction followed by alloying. Even though these materials show attractive initial specific capacities (first lithiation), a rapid fading is observed during the early cycles. By the combination of long and short-range analytical tools such as operando XRD and ex situ XAS, it was possible to establish a general reaction mechanism than can be written as (1) Conversion reaction: MaNCN + 2Li→ M + Li2NCN (a
= 1 or 2; M = Pb,“2Ag” or Zn).
(2) Alloying reaction: M + xLi→ LixM with 1 < x < 3.5.
The conversion reaction is found to be partially reversible for the three metals, whereas the reversibility of the alloying reaction depends on the metal, that is, it is highly irreversible for compounds containing cyanamide bonding (PbNCN and Ag2NCN) and more reversible for the carbodiimide ZnNCN.
In the case of PbNCN and Ag2NCN, the conversion reaction occurs at a higher voltage compared with ZnNCN, and seems to be correlated with the nature of bonding in the NCN group. Compounds that contain cyanamide bonding show a faster capacity fading (less than 200 mAh g−1after 10 cycles). By contrast, the carbodiimide ZnNCN could maintain a
reasonable specific capacity (comparable to that of graphite) for more than 100 cycles.
Compared to carbodiimides of transition-metals,57 the studied materials show rather bad performance, and no capacity improvement could be observed from the combina-tion of conversion and alloying reaccombina-tion. On the contrary, a rapid capacity fading is observed especially for PbNCN and Ag2NCN.
4. Experimental Section. PbNCN and Ag2NCN were
prepared by the reaction of an aqueous solution of cyanamide with the corresponding metal salt (lead acetate and silver nitrate for PbNCN and Ag2NCN, respectively). The addition
of an ammonia solution led to the formation of yellow precipitates, which were then filtered, washed, and dried to obtain crystalline lead and silver cyanamide particles.23,27Zinc carbodiimide was prepared by a simple mixing of zinc chloride with cyanamide in excess in ammonia solution for 3 h, yielding a white powder.32
Electrodes were prepared by mixing the active material with carbon black and vapor-grown carbon nanofibers (VGCF) as conductive additives, as well as carboxymethyl cellulose as the binder.22A homogenous aqueous slurry containing 60% active material, 20% binder, and 20% conductive additive (10% CB + 10% VGCF) was prepared by low-energy ball milling of the suspension for 1 h. The slurry was then tape casted on a copper foil with a thickness of 150 μm, dried first at room temperature, and then at 100 °C under vacuum. Finally, homogeneous electrodes with an active material loading of∼1 mg cm−2 were cut out from the dried foils and assembled in coin cells in an argon-filled glove box vs Li metal. The separator was a Whatman glassfiber GF/D and the electrolyte a solution of 1 M LiPF6 in ethylene carbonate, propylene
carbonate, and dimethyl carbonate (1:1:3 in weight %) containing 2% vinylene carbonate and 5% fluoroethylene carbonate as additives. The electrochemical cells were tested in the galvanostatic mode using VMP and MPG Biologic potentiostats at the C/n rate (indicating 1 mol of Li reacted in n hours per mole of active material, with n ranging from 0.25 to 10). Cyclic voltammetry (CV) profiles were also measure-ments with the same potentiostats with a scan rate of 0.05 mV s−1between 0.005 and 3 V.
X-ray powder diffraction (XRD) data were collected with a PANalytical Empyrean diffractometer equipped with a Cu Kα source. The measured XRD patterns were refined with the Le Bail method using the FullProf software.33 Operando XRD measurements were carried out by measuring one pattern per hour on self-supported electrodes at the C/8 rate in a specially designed in situ cell.34 Ex situ analyses were conducted on electrodes cycled in Swagelok cells, stopped at specific discharge and charge states. The cells were disassembled in an Ar-filled glove box and the electrodes were supported on Cu foils placed on a glass slide and covered with a Kapton film with a seal layer of silicone grease to prevent the reaction with air during analysis.
The microstructure and the morphology of the samples were observed with a Hitachi S-4800 scanning electron microscope equipped with a field emission gun. Thermogravimetric profiles were collected by using a NETZSCH Jupiter STA 449 F1 thermobalance with a heating rate of 5 °C min−1 in airflow. Raman spectra were recorded using a confocal LabRAM Aramis spectrometer (Horiba), equipped with a HeNe laser, 1800 grooves/mm grating, and a Peltier-cooled charge-coupled device detector. A backscattering geometry
with a 50× optical microscope objective under an excitation laser line of 633 nm (HeNe) was used.
Ex situ X-ray absorption spectroscopy (XAS) data were collected at room temperature at B18 beamline, Diamond Light Source (U.K.). Self-supported pellets containing 50% active materials (the preparation method has been detailed in the Supporting Information) were cycled in Swagelok cells, and stopped at different charge/discharge potentials. The cells were dissembled in an Ar-filled glove box sealed in airtight bags and transferred to the XAS sample holder. The measurements were carried out at the Zn K-edge, Ag K-edge, and Pb L3-edge for electrodes containing ZnNCN, Ag2NCN, and PbNCN,
respectively. The extended X-ray absorption fine structure (EXAFS) spectra were extracted with the standard procedure using Athena and fitted using Artemis, both programs being included in the Demeter software package.35 Fourier trans-forms of EXAFS oscillations were carried out from 0.2 to 1.0 nm−1using a sine window. Fitting was performed in the R-range from 0.1 to 0.45 nm using k1, k2, and k3weights.
■
ASSOCIATED CONTENT*
S Supporting InformationThe Supporting Information is available free of charge on the
ACS Publications website at DOI: 10.1021/acsome-ga.8b02748.
Details on electrode preparation for ex situ XAS measurements; infrared spectra of pristine phases; additional cycling data; complementary XRD data; tables with EXAFS fitting data; details about the Pd L3-edge XAS data; XRD patterns of pristine powders
and electrodes of ZnNCN and Ag2NCN; galvanostatic profiles of ex situ XAS samples (PDF)
■
AUTHOR INFORMATION Corresponding Authors *E-mail:drons@HAL9000.ac.rwth-aachen.de (R.D.). *E-mail:lorenzo.stievano@umontpellier.fr(L.S.). *E-mail:moulay-tahar.sougrati@umntpellier.fr(M.T.S.). ORCID Richard Dronskowski:0000-0002-1925-9624 Lorenzo Stievano:0000-0001-8548-0231 Moulay Tahar Sougrati: 0000-0003-3740-2807Notes
The authors declare no competingfinancial interest.
■
ACKNOWLEDGMENTSThe authors are grateful to Joël Couve for technical help in the TGA measurements. ALISTORE-ERI is warmly thanked for financing the Ph.D. grant of J.J.A. Alan Chadwick and Giannantonio Cibin are gratefully acknowledged for providing access to beamline B18, Diamond Synchrotron, via the Block Allocation Group“Materials in Energy Applications”.
■
REFERENCES(1) Nitta, N.; Yushin, G. High-Capacity Anode Materials for Lithium-Ion Batteries: Choice of Elements and Structures for Active Particles. Part. Part. Syst. Charact. 2014, 31, 317−336.
(2) Cabana, J.; Monconduit, L.; Larcher, D.; Palacín, M. R. Beyond Intercalation-Based Li-Ion Batteries: The State of the Art and Challenges of Electrode Materials Reacting Through Conversion Reactions. Adv. Mater. 2010, 22, E170−E192.
(3) Keppeler, M.; Srinivasan, M. Interfacial Phenomena/Capacities Beyond Conversion Reaction Occurring in Nano-Sized Transition-Metal-Oxide-Based Negative Electrodes in Lithium-Ion Batteries: A Review. ChemElectroChem 2017, 4, 2727−2754.
(4) Poizot, P.; Laruelle, S.; Grugeon, S.; Dupont, L.; Tarascon, J.-M. Nano-Sized Transition-Metal Oxides as Negative-Electrode Materials for Lithium-Ion Batteries. Nature 2000, 407, 496−499.
(5) Grugeon, S.; Laruelle, S.; Dupont, L.; Tarascon, J.-M. An Update on the Reactivity of Nanoparticles Co-Based Compounds towards Li. Solid State Sci. 2003, 5, 895−904.
(6) Pelliccione, C. J.; Ding, Y.; Timofeeva, E. V.; Segre, C. U. In Situ XAFS Study of the Capacity Fading Mechanisms in ZnO Anodes for Lithium-Ion Batteries. J. Electrochem. Soc. 2015, 162, A1935−A1939. (7) Son, D.; Kim, E.; Kim, T.-G.; Kim, M. G.; Cho, J.; Park, B. Nanoparticle Iron-Phosphate Anode Material for Li-Ion Battery. Appl. Phys. Lett. 2004, 85, 5875−5877.
(8) Shao, L.; Shu, J.; Ma, R.; Shui, M.; Hou, L.; Wu, K.; Wang, D.; Ren, Y. Electrochemical Characteristics and Intercalation Mechanism of Manganese Carbonate as Anode Material for Lithium-Ion Batteries. Int. J. Electrochem. Sci. 2013, 8, 1170−1180.
(9) Shao, L.; Wang, S.; Wu, K.; Shui, M.; Ma, R.; Wang, D.; Long, N.; Ren, Y.; Shu, J. Comparison of (BiO)2CO3to CdCO3as Anode
Materials for Lithium-Ion Batteries. Ceram. Int. 2014, 40, 4623−4630. (10) Shao, L.; Ma, R.; Wu, K.; Shui, M.; Lao, M.; Wang, D.; Long, N.; Ren, Y.; Shu, J. Metal Carbonates as Anode Materials for Lithium Ion Batteries. J. Alloy Compd. 2013, 581, 602−609.
(11) Yan, X.; Tong, X.; Wang, J.; Gong, C.; Zhang, M.; Liang, L. Hydrothermal-Synthesized NiO Nanowall Array for Lithium Ion Batteries. J. Alloy. Compd. 2013, 556, 56−61.
(12) Aldon, L.; Jumas, J.-C. Lithium-Induced Conversion Reaction in Wüstite Fe1−xO Studied by57Fe Mössbauer Spectroscopy. Solid
State Sci. 2012, 14, 354−361.
(13) Kim, Y.; Goodenough, J. B. Lithium Insertion into Transition-Metal Monosulfides: Tuning the Position of the Transition-Metal 4s Band. J. Phys. Chem. C 2008, 112, 15060−15064.
(14) Qin, D.; Yan, P.; Li, G.; Wang, Y.; An, Y.; Xing, J. Synthesis of Hierarchical CoO Nano/Microstructures as Anode Materials for Lithium-Ion Batteries. J. Nanomater. 2014, 2014, 1−5.
(15) Wang, J.; Wang, G.; Yang, L.; Ng, S. H.; Liu, H. An Investigation on Electrochemical Behavior of Nanosize Zinc Sulfide Electrode in Lithium-Ion Cells. J. Solid State Electrochem. 2006, 10, 250−254.
(16) Petnikota, S.; Marka, S. K.; Banerjee, A.; Reddy, M. V.; Srikanth, V. V. S. S.; Chowdari, B. V. R. Graphenothermal Reduction Synthesis of‘Exfoliated Graphene Oxide/Iron (II) Oxide’ Composite for Anode Application in Lithium Ion Batteries. J. Power Sources 2015, 293, 253−263.
(17) Grugeon, S.; Laruelle, S.; Herrera-Urbina, R.; Dupont, L.; Poizot, P.; Tarascon, J.-M. Particle Size Effects on the Electrochemical Performance of Copper Oxides toward Lithium. J. Electrochem. Soc. 2001, 148, A285−A292.
(18) Laruelle, S.; Grugeon, S.; Poizot, P.; Dollé, M.; Dupont, L.; Tarascon, J.-M. On the Origin of the Extra Electrochemical Capacity Displayed by MO/Li Cells at Low Potential. J. Electrochem. Soc. 2002, 149, A627−A634.
(19) Liu, C.; Zhang, C.; Fu, H.; Nan, X.; Cao, G. Exploiting High-Performance Anode through Tuning the Character of Chemical Bonds for Li-Ion Batteries and Capacitors. Adv. Energy Mater. 2017, 7, No. 1601127.
(20) Eguía-Barrio, A.; Castillo-Martínez, E.; Klein, F.; Pinedo, R.; Lezama, L.; Janek, J.; Adelhelm, P.; Rojo, T. Electrochemical Performance of CuNCN for Sodium Ion Batteries and Comparison with ZnNCN and Lithium Ion Batteries. J. Power Sources 2017, 367, 130−137.
(21) Eguía-Barrio, A.; Castillo-Martínez, E.; Liu, X.; Dronskowski, R.; Armand, M.; Rojo, T. Carbodiimides: New Materials Applied as Anode Electrodes for Sodium and Lithium Ion Batteries. J. Mater. Chem. A 2016, 4, 1608−1611.
ACS Omega Article
DOI:10.1021/acsomega.8b02748
ACS Omega 2019, 4, 4339−4347
(22) Sougrati, M. T.; Darwiche, A.; Liu, X.; Mahmoud, A.; Hermann, R. P.; Jouen, S.; Monconduit, L.; Dronskowski, R.; Stievano, L. Transition-Metal Carbodiimides as Molecular Negative Electrode Materials for Lithium- and Sodium-Ion Batteries with Excellent Cycling Properties. Angew. Chem., Int. Ed. 2016, 55, 5090− 5095.
(23) Liu, X.; Decker, A.; Schmitz, D.; Dronskowski, R. Crystal Structure Refinement of Lead Cyanamide and the Stiffness of the Cyanamide Anion. Z. Anorg. Allg. Chem. 2000, 626, 103−105.
(24) Zhao, W.; Pan, J.; Huang, F. Nonaqueous Synthesis of Metal Cyanamide Semiconductor Nanocrystals for Photocatalytic Water Oxidation. Chem. Commun. 2018, 54, 1575−1578.
(25) Kubus, M.; Castro, C.; Enseling, D.; Jüstel, T. Room Temperature Red Emitting Carbodiimide Compound Ca-(CN2):Mn2+. Opt. Mater. 2016, 59, 126−129.
(26) Meng, H.; Li, X.; Zhang, X.; Liu, Y.; Xu, Y.; Han, Y.; Xu, J. Fabrication of Nanocomposites Composed of Silver Cyanamide and Titania for Improved Photocatalytic Hydrogen Generation. Dalton Trans. 2015, 44, 19948−19955.
(27) Becker, M.; Nuss, J.; Jansen, M. Kristallstruktur und schwingungsspektroskopische Daten von Silbercyanamid/Crystal Structure and Spectroscopic Data of Silver Cyanamide. Z. Naturforsch., B 2000, 55, 383−385.
(28) Down, M. G.; Haley, M. J.; Hubberstey, P.; Pulham, R. J.; Thunder, A. E. Synthesis of the Dilithium Salt of Cyanamide in Liquid Lithium; X-Ray Crystal Structure of Li2NCN. J. Chem. Soc., Chem.
Commun. 1978, 52−53.
(29) Auchmoody, L. R.; Wendel, G. W. Effect of Calcium Cyanamide on Growth and Nutrition of Plan Fed Yellow-Poplar Seedlings; Res. Pap. NE-265. Uppdr Darby, PA, Forest Service, Northeastern Forest Experiment Station; U.S. Department of Agriculture, 1973; pp 1−11. (30) Krings, M.; Montana, G.; Dronskowski, R.; Wickleder, C. α-SrNCN:Eu2+A Novel Efficient Orange-Emitting Phosphor. Chem.
Mater. 2011, 23, 1694−1699.
(31) Giorgetti, M.; Stievano, L. X-Ray Absorption Spectroscopy Study of Battery Materials. In X-ray Characterization of Nanostructured Energy Materials by Synchrotron Radiation; Khodaei, M., Petaccia, L., Eds.; InTech: Rijeka, 2017; pp 51−75.
(32) Becker, M.; Jansen, M. Zinc Cyanamide, Zn(CN2). Acta
Crystallogr., Sect. C: Cryst. Struct. Commun. 2001, 57, 347−348. (33) Le Bail, A. Whole Powder Pattern Decomposition Methods and Applications: A Retrospection. Powder Diffr. 2005, 20, 316−326.
(34) Leriche, J.-B.; Hamelet, S.; Shu, J.; Morcrette, M.; Masquelier, C.; Ouvrard, G.; Zerrouki, M.; Soudan, P.; Belin, S.; Elkaïm, E.; et al. An Electrochemical Cell for Operando Study of Lithium Batteries Using Synchrotron Radiation. J. Electrochem. Soc. 2010, 157, A606− A610.
(35) Ravel, B.; Newville, M. ATHENA, ARTEMIS, HEPHAESTUS: Data Analysis for X-Ray Absorption Spectroscopy Using IFEFFIT. J. Synchrotron Rad. 2005, 12, 537−541.
(36) Berger, U.; Schnick, W. Syntheses, Crystal Structures, and Vibrational Spectroscopic Properties of MgCN2, SrCN2, and BaCN2.
J. Alloy. Compd. 1994, 206, 179−184.
(37) Deb, S. K.; Yoffe, A. D. Inorganic Cyanamides. Physical and Optical Properties, and Decomposition. Trans. Faraday Soc. 1959, 55, 106−113.
(38) Morita, K.; Mera, G.; Yoshida, K.; Ikuhara, Y.; Klein, A.; Kleebe, H. J.; Riedel, R. Thermal Stability, Morphology and Electronic Band Gap of Zn(NCN). Solid State Sci. 2013, 23, 50−57. (39) Li, Q.; Feng, C. Electrochemical Performance of Nano-structured PbO@C Obtained by Sol−Gel Method. J. Electron. Mater. 2016, 45, 3127−3133.
(40) Cignini, P.; Pistoia, G. Discharge Behaviour of AgO and Ag2O
Cathodes in Lithium Cells. Electrochim. Acta 1978, 23, 1099−1101. (41) Liu, W.; Ma, B.; Fu, Y.; Zhang, K.; Mezaal, M. A.; Li, F.; Zhao, X.; Lei, L. Electrochemical Property of α-PbO Prepared from the Spent Negative Powders of Lead Acid Batteries. J. Solid State Electrochem. 2017, 21, 35−46.
(42) Wood, S. M.; Powell, E. J.; Heller, A.; Mullins, C. B. Lithiation and Delithiation of Lead Sulfide (PbS). J. Electrochem. Soc. 2015, 162, A1182−A1185.
(43) Martos, M.; Morales, J.; Sánchez, L. Lead-Based Systems as Suitable Anode Materials for Li-Ion Batteries. Electrochim. Acta 2003, 48, 615−621.
(44) Morales, J.; Sánchez, L.; Martín, F.; Ramos-Barrado, J. R.; Sánchez, M. Synthesis, Characterization, and Electrochemical Proper-ties of Nanocrystalline Silver Thin Films Obtained by Spray Pyrolysis. J. Electrochem. Soc. 2004, 151, A151−A157.
(45) Li, H.; Wang, Y.; He, P.; Zhou, H. A Novel Rechargeable Li− AgO Battery with Hybrid Electrolytes. Chem. Commun. 2010, 46, 2055−2057.
(46) Wan, H.; Han, P.; Ge, S.; Li, F.; Zhang, S.; Li, H. Development Zinc Oxide−Cotton Fibers as Anode Materials for Lithium-Ion Batteries. Int. J. Electrochem. Sci. 2018, 13, 4115−4122.
(47) Zhao, Y.; Wang, L. P.; Sougrati, M. T.; Feng, Z.; Leconte, Y.; Fisher, A.; Srinivasan, M.; Xu, Z. A Review on Design Strategies for Carbon Based Metal Oxides and Sulfides Nanocomposites for High Performance Li and Na Ion Battery Anodes. Adv. Energy Mater. 2017, 7, No. 1601424.
(48) Marino, C.; Fraisse, B.; Womes, M.; Villevieille, C.; Monconduit, L.; Stievano, L. At the Heart of a Conversion Reaction: An Operando X-Ray Absorption Spectroscopy Investigation of NiSb2,
a Negative Electrode Material for Li-Ion Batteries. J. Phys. Chem. C 2014, 118, 27772−27780.
(49) Wood, S. M.; Pham, C. H.; Heller, A.; Mullins, C. B. CommunicationStages in the Dynamic Electrochemical Lithiation of Lead. J. Electrochem. Soc. 2016, 163, A1027−A1029.
(50) Martos, M.; Morales, J.; Sánchez, L.; Ayouchi, R.; Leinen, D.; Martin, F.; Barrado, J. R. R. Electrochemical Properties of Lead Oxide Films Obtained by Spray Pyrolysis as Negative Electrodes for Lithium Secondary Batteries. Electrochim. Acta 2001, 46, 2939−2948.
(51) Bouad, N.; Chapon, L.; Marin-Ayral, R.-M.; Bouree-Vigneron, F.; Tedenac, J.-C. Neutron Powder Diffraction Study of Strain and Crystallite Size in Mechanically Alloyed PbTe. J. Solid State Chem. 2003, 173, 189−195.
(52) Pelton, A. D. The Ag−Li (Silver−Lithium) System. Bull. Alloy Phase Diagrams 1986, 7, 223−228.
(53) Pavlyuk, V. V.; Dmytriv, G. S.; Tarasiuk, I. I.; Chumak, I. V.; Pauly, H.; Ehrenberg, H. Polymorphism of LiAg. Solid State Sci. 2010, 12, 274−280.
(54) Hwa, Y.; Sung, J. H.; Wang, B.; Park, C.-M.; Sohn, H.-J. Nanostructured Zn-Based Composite Anodes for Rechargeable Li-Ion Batteries. J. Mater. Chem. 2012, 22, 12767−12773.
(55) Pereira, N.; Klein, L. C.; Amatucci, G. G. The Electrochemistry of Zn3N2 and LiZnN A Lithium Reaction Mechanism for Metal
Nitride Electrode. J. Electrochem. Soc. 2002, 149, A262−A271. (56) Krott, M.; Houben, A.; Müller, P.; Schweika, W.; Dronskowski, R. Determination of the Magnetic Structure of Manganese Carbodiimide with Diffraction Experiments Using Polarized Neu-trons. Phys. Rev. B 2009, 80, No. 024117.
(57) Sougrati, M. T.; Arayamparambil, J. J.; Liu, X.; Mann, M.; Slabon, A.; Stievano, L.; Dronskowski, R. Carbodiimides as Energy Materials: Which Directions for a Reasonable Future? Dalton Trans. 2018, 47, 10827−10832.