To cite this document:
Villeneuve, Éric and Béler, Cédrick and Peres, François and Geneste, Laurent
Hybridization of Bayesian networks and belief functions to assess risk. Application to
aircraft deconstruction. (2011) In: International Conference on Industrial Engineering
and Systems Management (IESM 2011), 25-27 May 2011, Metz, France.
Open Archive Toulouse Archive Ouverte (OATAO)
OATAO is an open access repository that collects the work of Toulouse researchers and
makes it freely available over the web where possible.
This is an author-deposited version published in:
http://oatao.univ-toulouse.fr/
Eprints ID: 6621
Any correspondence concerning this service should be sent to the repository
administrator:
[email protected]
International Conference
on Industrial Engineering and Systems Management
IESM 2011
May 25 – May 27, 2011 METZ - FRANCE
Hybridization of Bayesian networks and belief
functions to assess risk.
Application to aircraft deconstruction.
*
Éric VILLENEUVE
a, Cédrick BELER
a,
François PERES
a, Laurent GENESTE
aa Université de Toulouse – École Nationale d'Ingénieurs de Tarbes (ENIT) – Laboratoire Génie de Production
Abstract
This paper aims to present a study on knowledge management for the disassembly of end-of-life aircraft. We propose a model using Bayesian networks to assess risk and present three approaches to integrate the belief functions standing for the representation of fuzzy and uncertain knowledge.
Key words: Bayesian networks, belief functions, risk assessment, knowledge management, aeronautical deconstruction.
1 Introduction 1.1 General overview
The disassembly of end-of-life aircraft shows nowadays a rapid growth for several reasons. Firstly, the aircraft fleet ageing raises substantially the number of aircraft arriving at their end-of-life period. In addition, the recent changes in regulations significantly increase the manufacturer liability regarding the management of the end of life of their aircraft. Finally current environmental concerns encourage aircraft manufacturers to integrate the environmental dimension in their industrial strategies.
This paper aims to present a study on knowledge management for the disassembly of end-of-life aircraft. Our work is part of a project called “DIAGNOSTAT”. This project, supported by the Aerospace Valley cluster, is funded by the “Fond Unique Interministériel” (FUI). In this context we wish to develop decision-support mechanisms using the experience feedback to perform risk assessments on critical areas of an aircraft.
1.2 Problematic
The DIAGNOSTAT project focuses on two specific aspects of aircraft deconstruction which are, first, the recovery and the certification of parts for reuse as spares, and, secondly, the knowledge capitalization on airplane status (in particular its critical areas) to improve aircraft design and maintenance.
In this context, we focus specifically on the capitalization of the knowledge generated during aircraft deconstruction. We aim the establishment of an information system to facilitate knowledge management used in the aircraft deconstruction and particularly during the inspection phase of the plane. We first planned to build an
*This paper was not presented at any other revue. Corresponding author E. VILLENEUVE Tel. +33 (0)5 62 44 27 00. Email addresses: [email protected] (Éric VILLENEUVE), [email protected] (Cédrick BELER),
IESM 2011, METZ – FRANCE, May 25 - 27
inspection procedure to collect and formalize knowledge in a systematic way. These data should be stored in the information system. Finally, a module will be developed to analyse, capitalize and take advantage of the knowledge generated during the inspection or the data analysis. This experience feedback tool should provide the opportunity to match the living and using conditions of the aircraft with the different defects on an airplane critical areas through statistical and expert analysis.
This framework allows to developing an application to assess the risk on critical parts and areas of an airplane. This tool will use a database and a statistical analysis module that will be deployed in the project DIAGNOSTAT. It will use the information system to exploit the knowledge resulting from the disassembly of end-of-life aircraft.
This database will contain: the references of each aircraft (type, option, ...), the living and using conditions (long-haul or national flights, weather conditions, maintenance, ...) and the various defects encountered during decommissioning and / or maintenance. The statistical analysis module will put into perspective the information to generate statistics exploitable by the user. We propose to deepen the capabilities of this tool by associating a risk assessment module which, in addition to the raw statistics from the statistical analysis module, integrates knowledge of experts to provide a risk assessment on a critical areas of the aircraft (Figure 1).
Fig. 1. General mechanism proposed. 1.3 Approach used
To address this issue, a review encompassing the science fields relevant to our work (knowledge management, feedback, risk assessment) has been achieved and the deconstruction process of an airplane has been modelled to get a better understanding of issues and constraints associated with this activity [15]. Subsequently, a risk assessment model was built, based on our review of the literature, to represent the risk. Bayesian networks were used for their ability to simply model a risk situation and we expanded it to reach a generic risk assessment model. However, the uncertainty modelling is complex because of the limitations imposed by the Bayesian networks and more particularly by the probabilistic mechanisms they are associated with. Within this framework, belief functions can be of a great help. We decided consequently to consider their integration into Bayesian networks model.
This communication is divided into three parts. We develop, firstly, the concepts useful for understanding the decision support mechanisms presented in this paper. We begin with concepts related to risk assessment and explain the notions associated with Bayesian networks. Then we propose a model that uses Bayesian networks to assess risk and detail its various applications and limitations. Finally, we introduce belief functions, which can overcome the limitations imposed by Bayesian networks, and propose three approaches to integrate belief functions in the risk assessment model together with the opportunities offered by these mechanisms.
2 Key concepts
2.1 Risk assessment
The different concepts useful for understanding the mechanisms of risk assessment are presented in this section. We start by defining the concept of risk, before analysing in details the risk assessment process. Then, we analyse the risk assessment phase, which is part of risk management process [2] that we will not further develop here. Finally, we present the architecture of the selected risk representation.
The various definitions found in the literature generally present the risk as a combination of hazard and vulnerability. It is seen as the product between the occurrence probability of a negative event (the hazard) and the estimated severity of the event (vulnerability) [4]. However, this definition does not take into account the notions of causes and consequences presented by [9] as risk attributes. Therefore, we adopt the definition proposed by [6] which defines the risk that an event occurs as the association of the “cause events” characterized by their occurrence (P), and the “consequence events” (effects) characterized by their severity or impact (I). The risk can be so determined by R = f (occurrence, impact) = f (P, I) (Figure 2).
Fig. 2. Characterization of a risk by [6]. 2.1.2 Risk assessment
According to risk management process, risk assessment consists in comparing the observed state of the system with other known situations. There are two main categories of tools to achieve this assessment: the ranking and the referential.
The ranking is a method that aims to make a relative positioning of the studied situation with respect to a set of standard situations. However a lack of precision can be noted for this representation since it can include some atypical risks considered as the most dangerous (e.g. a risk with a significant occurrence probability and a strong impact). To fill these gaps, some risk referentials allows the positioning of the risk according to a combination of its occurrence probability and its severity (Figure 3).
Fig. 3. Representations 3D, 2D and simplified 2D of risk referential.
The risk referential offers a more comprehensive representation of risk, which can easily be adapted to each situation by altering the calculation function of risk. The risk is traditionally defined by the relation R = P x I, but the literature offers many other formulations. For example, to highlight the risks with a knock-on impact, the formula R = P x Ik [14] may be used.
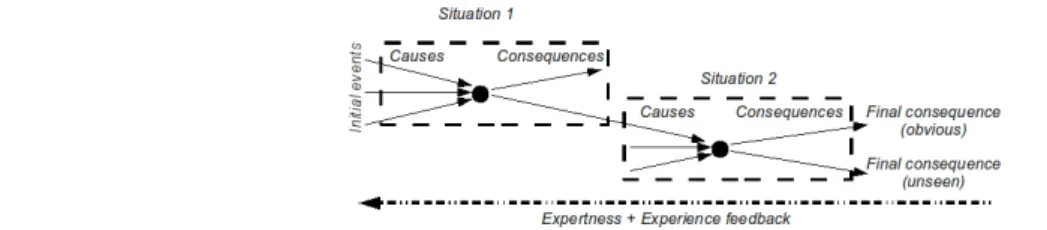
2.1.3 Architecture used
The vision of the risk, presented in the part “2.1.1” of this communication (Figure 2), can easily be extended to more complex risks by using the event sequence described above. Each situation is composed of “cause events”, “consequence events” and a “target event”. It is possible to scan a chain of situations (a “cause event” of a situation is a “consequence event” of another, and vice versa) to study the root causes or the ultimate consequences. This representation of risk in sequence (Figure 4) allows formalizing the knowledge from the deconstruction and the maintenance of an aircraft. The expertise will be used in parallel with the experience feedback to find the classic event sequence and thus to determine the root causes that lead to visible consequences in fine. This diagnostic step is dedicated to the search of the origin of the problem but also to the definition of the succession of events that could potentially lead to a feared event.
IESM 2011, METZ – FRANCE, May 25 - 27
Fig. 4. Representations 3D, 2D and simplified 2D of risk referential.
2.2 Bayesian networks
2.2.1 Principles
Bayesian networks [10] are graphical models used to formalize knowledge. They are directed and acyclic graphs where knowledge is represented by variables. Each node in the graph represents a variable and the arcs represent probabilistic dependencies between these variables. According to [11], if {Xi, i = 1, ..., n} is the set of network variables, then pa(Xi) is the set of parents (also known as predecessors or causes) of Xi. A Bayesian network is composed of:
• variables X1, …, Xn represented by nodes,
• arcs between variables which represent causal links and to form a directed acyclic graph,
• probability tables related to each variable X according to its parents, P(Xi | pa(Xi)). Thus all probabilities define the joint probability distribution for the network:
The conditional probability tables can also represent deterministic rules. Such as “if X = a1 then Y = b1”. These
rules can be used to model logic gates or constraint satisfaction problems.
The information propagation in the network uses Bayesian inference. This approach allows calculating or revising the assumptions probabilities of the network based on probability tables and knowledge acquired over time. The Bayesian inference mechanisms [8] use rules for combining probabilities from the Bayes theorem [1], which will not be reminded here.
2.2.2 Influence diagrams
The influence diagrams [7] are used to represent decision issues by the way of graphs. This generalization of Bayesian networks provides opportunities to model and solve not only probabilistic problems but also decision support problems.
To achieve this goal, two additional types of nodes are available compared to Bayesian networks. There are three kinds of nodes in an influence diagram [5]:
• Chance nodes represent the different variables of the problem. These are the same nodes in Bayesian networks.
• Decision nodes are used to model the various alternatives available to the decision maker for each problem decision.
• Utility nodes allow to evaluate these alternatives according to an optimisation criterion. This criterion is often represented as a cost.
In an influence diagram, the arc meaning differs according to the nodes that are put in relation:
• When an arc connects two chance nodes, it has the same meaning as in a Bayesian network, i.e. it represents the causal link between two variables.
• When an arc points to a chance node from a decision node, each alternative decision node influences the different values likely to be taken by the variable represented by the chance node.
• When an arc points to a decision node, the decision requires knowledge corresponding to the value of the origin node of the arc.
• When an arc points to a utility node, a value is sent to the utility table standing for the loss or benefit generated by the previous decisions.
P X
1,... , X
n=
∏
i =1 n
3 Proposed model
3.1 Presentation
To build the risk assessment model, we chose to use the representation of risks in sequence (Figure 4). However, some changes have been introduced in the model since, in the considered case, the feared event is not the defect, but relates to the consequences of this defect which are often more destructive than the defect itself.
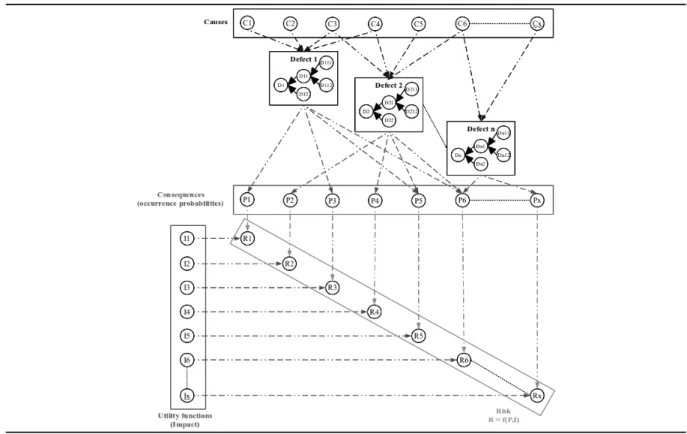
The model (Figure 5) uses the principles of influence diagram and respects the construction rules of this formalism to provide a risk assessment on a part or a sub-assembly. It is divided into two sub-models. The first one only uses Bayesian networks to represent the risk and calculate the occurrence probability of dangerous events. The second one uses the probabilities calculated by the first sub-model and the influence diagram concepts of utility and decision to assess the risks.
Fig. 5. Risk assessment model.
The fist sub-model is structured in three layers. This phase of data processing only uses Bayesian networks and the inference mechanisms to propagate information in the three layers namely:
• the causes: events that lead to the defect. The causes may result from the life of the aircraft before its deconstruction but also from the consequences of another defect. Thus the defect consequences may influence the occurrence of another failure. For readability, these links are not shown in Figure 5. • the defects: physical phenomena observed on a part or a sub-assembly of the plane. Hierarchical defects
have been considered in order to meet the studied system structure. Therefore, a system composed of two parts will be represented by three potential defects (one per part and one for the complete system). The presence of the defect on a piece necessarily implies that the defect is also present on the entire system. Conversely, the presence of the defect on the system can not be propagated into because of the impossibility to determine which one is actually affected.
• the consequences: dangerous events induced by the defect(s). As we stated previously, a consequence of a defect can also be the cause of another one.
The occurrence probabilities are associated with the defects, their causes and their consequences. The inference mechanisms allow the change of these probabilities based on observations and therefore the certitudes acquired during inspection and recertification tests on parts or sub-assemblies.
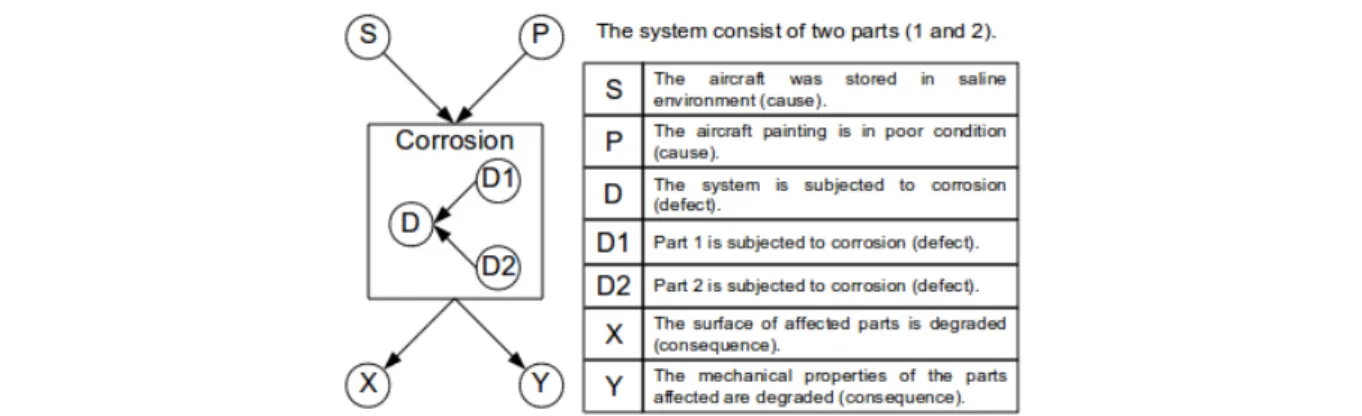
IESM 2011, METZ – FRANCE, May 25 - 27
Fig. 6. Example of model application on a simplified case of corrosion.
The causes are characterized by their occurrence probabilities (for example, there are 80% of chance that the cause S is true). The defects and the consequences are defined by conditional probability tables containing information on the impact of different causes on the defect occurrence (e.g. if S and P are true, then there is a 95% of chance that D is true or if D is true then there is a 90% of chance that X is true). With respect to the defects in particular, they are also subject to rules that affect the occurrence of an event to the parent level (for example, if D1 is true then D is true).
The second part of the model allows the risk assessment by introducing the specific elements of influence diagrams. Utility nodes are used to quantify the impact of consequences. Each consequence is coupled with a specific utility node through a decision node which allows to assess the risk by using a function like “Risk = Probability x Impact”.
3.2 Possible use cases
The primary use of this model is the risk assessment during aircraft deconstruction. The user will be able to quickly assess whether the part or sub-assembly could be reusable or whether it should be sent directly to materials recycling. The objective is then to provide a quick risk assessment based on information resulting from the aircraft life (logbook, maintenance record, ...) and superficial observations made during the plane inspection. It may avoid a set of expensive tests for deconstruction and recertifying a part in the case where the model indicates that the risk of reintroducing a used part is too high. Moreover, following the deconstruction progression and the data-gathering, the assessment will be refined which will enable the decision-maker's to validate its choice.
This kind of representation also provides a number of additional operating possibilities. First, it will be possible, from the visible consequences of an event, to determine the probable presence of hidden consequences which result from the dynamics that led to the defect. For example, if a user has to certify a part which is slightly corroded at the surface, he may be informed of a probable deterioration of the mechanical properties of the part because the experience acquired in the past has shown the association between these two phenomena.
In addition, this type of model allows the introduction of statistical and probabilistic knowledge coming from a database in order to refine and consolidate the expert knowledge. In this way, users have additional tools to assist them in decision-making. The application can then issue statistical information about a particular event, indicating, for example, that a visible consequence is associated in 80% of cases with another hidden or visible consequence. The reaction may be then adapted, as appropriate, to achieve better phenomena management. If the data are used in maintenance, the tool can be used to adapt the maintenance actions with respect to the aircraft life, focusing on some sensitive areas for specific mission profiles or engaging additional checks when phenomena usually associated with critical defects are detected.
Similarly, in the context of use for the certification of second-hand parts, the user may request additional verifications resulting from events suggesting larger problems. He can also decide to put off a part on the basis of superficial observations because the risk is too important.
Finally, the use of the model may be helpful during aircraft design. In this case, the model will support the risk assessment for critical part failure during its design for a particular mission profile and thus adapt the technical solutions (choice of materials or geometry, for example). The goal is to make the part more resistant to stresses that it will encounter in real use. This type of experience feedback seems less relevant because the current
technologies used to design an aircraft are often different from those used 30 years ago, as it is the case for most aircraft deconstructed today. However, there are notable exceptions in cases of aircraft deconstructed much earlier in their life cycle, for example, those involved in accidents for which the cost of repairs exceeds the value of the aircraft.
3.3 Limits of use
One of the first problems encountered is that it is impossible to meet, in a single model using influence diagrams, knowledge of several experts and data obtained from a statistical database. However, this feature is one major objective of our research which will lead to merge explicit and tacit information inside a same model. In addition, Bayesian networks operate from input information modelled as probability distributions. However, we intend to model information reflecting expertness. If the probability theory can be used to quantify the randomness of the information (variability), it does not allow the integration of epistemic information (incompleteness, imprecision). Indeed, the principle of symmetry or indifference (equiprobability) does not permit to make a difference between the representation of a random situation and a partially described context [3].
4 Integration of belief functions
Consequently, belief functions have been selected, and in particular the Transferable Belief Model (TBM), to represent the epistemic character of expert information. This rich and flexible framework enable the generalization of probability and possibility theories.
Below, we briefly introduce the TBM with an emphasis on different ways of representing information. The interested reader can refer in particular to [13] for a further description of the TBM.
4.1 The Transferable Belief Model
The TBM interprets a belief function as representing the views of a rational agent based on the belief or state of knowledge of the individual, even if it is inaccurate or incomplete.
4.1.1 Credal and pignistic levels
The transferable belief model assumes that reasoning under uncertainty (credal level) and decision making (pignistic level) are two different cognitive tasks:
• the credal level corresponds to the representation and manipulation of belief states without simplification (e.g. without the use of equiprobable distribution).
• the pignistic level corresponds to the decision-making. It consists in transforming the subjective measures of non-probabilistic belief in a probability measure called pignistic (BetP).
The pignistic transformation is irreversible but only intervenes during decision-making and does not alter the credal level.
4.1.2 Basic belief assignment
The modelling of belief functions is based on the allocation of a non-additive subjective measure of the chance of an event to occur. Contrary to the Dempster-Schafer (DST) which is the TBM origin, this representation exists without reference to a probability or a family of underlying probabilities.
The basic belief assignment (bba) of a mass m results in a state of partial knowledge about the value of a variable belonging to Ω and the definition domain called frame of discernment. If wi are the atomic elements and
Ai are subsets of Ω, we have:
Thus, the belief assignment is a distribution of a unit mass on the parts of Ω (power set), i.e. on the subsets of the frame of discernment (for a set of size n, it can represent 2n elements). The notation is P(Ω) or 2Ω. The ability to
assign masses to the made assumptions, and therefore to work on 2Ω rather than Ω, is one of the advantages of
this theory. This used to represent partial knowledge.
IESM 2011, METZ – FRANCE, May 25 - 27
mΩ(A) corresponds to the “belief part” allocated by source S to the assumption w ∈ A and no more restrictive
assumption. mΩ is given by the following formula:
4.1.3 Credibility and plausibility measures
From a mass distribution which is a strict belief that one can not specify, it is possible to get one-to-one manner of different but semantically equivalent representations. The most important are the dual functions of credibility (denoted Cr) and plausibility (denoted Pl).
The credibility Cr reflects the minimum belief in an information (minimal likelihood). It is given by the following formula:
The plausibility Pl reflects the maximum belief in an information (maximum likelihood). These are all beliefs that do not contradict A. It is given by the following formula:
4.2 Integration of belief functions
4.2.1 Fusion of belief functions
A given belief state at a given moment can change according to a new information or to be combined, merged with compatible knowledge states (same problem and same frame of discernment). The fusion operation is to combine several information covering the same question in a new belief structure defined on the same universe. This operation is performed using combination operators which can exploit the redundancy and the overlap of multiple information sources.
We want to use these characteristics of TBM to merge the opinion of several experts (Figure 7). The database is in this case considered as an expert and expresses an opinion from the extracted statistics. This opinion is then transformed into belief function with respect to the number of situations related to the problem studied in order to estimate a confidence degree in the statistical value extracted. The expert opinions are directly expressed as belief functions. All these belief functions are then merged and weighted according to the system confidence in each expert (including the database).
Fig. 7. Fusion of belief functions. 4.2.2 Integration of belief functions into the model
• Pre-processing of belief functions:
The first solution envisaged is to deal separately with the belief functions and the Bayesian network model. This method is synthesized in Figure 8.
Fig. 8. Pre-processing of belief functions.
2
Ω={
A⊆Ω}={∅ , {w
1}
, ... , {w
n}
,{w
1∪
w
2}
, ... , {Ω }}
m
Ω=
{
2
Ω[
0,1]
∑
A∈ 2Ωm
Ω
A=1
}
∀
A⊆Ω ,Cr A=
∑
B⊆ A , B≠∅m B
∀
A⊆Ω , Pl A=
∑
B∩ A≠∅m B
After merging the different belief functions representing expert and database opinions (4.2.1), the resulting belief function is transformed into a pignistic probability (4.1.1). This probability is then directly inserted into the Bayesian network.
The main advantage lies in the fact that this method does not require any adaptation of the model since the Bayesian networks naturally use probabilities. Therefore, the pignistic probability integration is not a problem. However, the pignistic transformation causes a loss of information especially with respect to uncertainty which is not propagated and is therefore invisible in the model. The extracted result ignores this uncertainty.
• Discretization of belief functions:
To fill this gap, we can choose to discretise the belief function resulting from the fusion. This approach is presented in Figure 9.
Fig. 9. Discretization of belief functions.
For this, several noteworthy values are chosen for each resulting belief function. It is possible to retain credibility, plausibility and the average of these two values for each belief function and use it as a probability in Bayesian networks. So there is a Bayesian network by value and by belief function.
The main difficulty which is encountered at this stage, is the combinatorial explosion in the number of Bayesian networks required to deal with a problem with multiple variables and therefore several belief functions. Indeed, if k is the number of values selected for each belief function and v the number of variables, then the number of networks N is given as follows: N = kv. A mechanism to reduce the combinatorial problem to limit the number of
Bayesian networks to be performed should therefore be provided. In addition, this method requires a final synthesis to bring together the results of all the Bayesian networks and facilitate the result readability to the user. The advantage of this approach lies in obtaining a probability range for representing uncertainty expressed by experts at the decision-making instant. However, the discretization also leads to a loss of information compared to the resulting belief function. This information loss is less than in the pignistic transformation case but can be nevertheless.
• Bayesian networks based on belief functions:
The latter approach that we present (Figure 10), solves the problems introduced by the two previous methods. It involves inserting the belief functions directly into a Bayesian network modified to handle such data.
Fig. 10. Bayesian networks based on belief functions.
The main problem with this approach lies in adapting Bayesian networks to the treatment of belief functions. The formalism of the model variables must be reviewed so that they are no longer represented by probabilities, but by belief functions. The Bayesian inference mechanisms must also be adapted to allow the information propagation in the network from these belief functions and the consideration of uncertainty.
The most significant advantage is the deferral of the conversion to a decision level (pignistic level) until the last moment. This method is a priori, the most interesting because the inherent modelling error in the pignistic transformation, and therefore the decision-making level, is delayed to the maximum.
We wish to couple the Bayesian networks with TBM and to this purpose, two features of TBM are important and should be the starting point in order to redefine the inference mechanisms of Bayesian networks. First, probabilities and belief functions are expressed from a unit mass distribution on a set of possible values. However, the TBM allows more choices. Finally, in an analogous way to the conditional probabilities,
IESM 2011, METZ – FRANCE, May 25 - 27
conditional beliefs have been defined [16] and the Generalized Bayes Theorem (GBT) is the extension of the Bayes Theorem to belief functions [13].
In addition, there are some recent works dealing with the problematic of combined use of Bayesian networks and TBM. We have identified two promising approaches. The first is the hybridization by redefining the conditional probability tables from the basic belief assignment. This approach involves constructing tables of belief mass distribution over all subsets of the domain. In [12], the table construction is simplified because it is associated with binary states and known variation laws (AND, OR and XOR gates). The second consists in redefining Bayesian inference mechanisms in the light of the Generalized Bayes theorem (GBT) [13]. In this context, recent studies define oriented credal networks, similar to Bayesian networks, but based on belief functions [17].
5 Conclusion
This paper proposes a model for risk assessment based on experts advice and statistical data for decision support during the deconstruction of end-of-life aircraft.
This proposition is based on the joint use of Bayesian networks and representation by the Transferable Belief Model. We describe three methods of hybridization of these two approaches. The perspectives on this work are various:
• consolidate processing algorithms for hybrid models,
• refine the mechanisms to acquire expertise from the database and expert advice, • test out the proposal by using a dedicated demonstrator.
6 References
[1] Bayes T., An essay towards solving a problem in the doctrine of chances, Philosophical Transactions of the Royal Society of London, vol. 53, pp 370-418, 1763.
[2] Courtot H., La gestion des risques dans les projets, Economica, 1998.
[3] Dubois D. and H. Prade, Représentation formelles de l'incertain et de l'imprécis, Concepts et méthodes pour l'aide à la décision - outils de modélisation, D. Bouyssou, D. Dubois, M. Pirlot, et H. Prade (Eds.), Lavoisier, vol. 1, pp 111-171, 2006.
[4] Favre J., G. Brugnot, J. Gresillon and M. Jappiot, Évaluation des risques naturels : une approche probabiliste?, Techniques de l'ingénieur, 1998.
[5] Godichaud M., Outils d'aide à la décision pour la séléction des filières de revalorisation des produits issus de la déconstruction des systèmes en fin de vie : application au domaine aéronautique, Institut National Polytechnique de Toulouse, 2009.
[6] Gouriveau R., Analyse des risques : formalisation des connaissances et structuration des données pour l'intégration des outils d'étude et de décision, Institut National Polytechnique de Toulouse, 2003. [7] Howard R.A. and J.E. Matheson, Influence diagrams, Decision Analysis, vol. 2, pp 127-143, 2005. [8] Naïm P., P. Wuillemin, P. Leray, O. Pourret and A. Becker, Réseaux bayésiens, Eyrolles, 2004.
[9] O'Shaughnessy W., La faisabilité de projet : une démarche vers l'efficience et l'efficacité, Les éditions SMG, 1992.
[10] Pearl J., Probabilistic reasoning in intelligent systems: networks of plausible inference, Morgan Kaufmann Publishers Inc., 1988.
[11] Piombo C., Modélisation probabiliste du style d'apprentissage et application à l'adaptation de contenus pédagogiques indexés par une ontologie, Institut National Polytechnique de Toulouse, 2007.
[12] Simon C., P. Weber and E. Levrat, Bayesian networks and evidence theory to model complex systems reliability, Journal of Computers, Volume 2, N°1, pp 33-43, 2007.
[13] Smets P. and R. Kennes, The transferable belief model, Artificial Intelligence, Volume 66, pp 191-234, 1994.
[14] Villemeur A., Sûreté de fonctionnement des systèmes industriels : fiabilité, facteurs humains, informatisation, Eyrolles, 1988.
[15] Villeneuve É., F. Peres and L. Geneste, An approach to improve risk assessment using experience feedback, Doctoral Spring Workshop – "Product and Asset Lifecycle Management" – Islantilla (Spain), 2010.
[16] Xu H. and P. Smets, Evidential reasoning with conditional belief functions, Proceedings of the 10th Conference on Uncertainty in Artificial Intelligence, pp 598-605, 1994.
[17] Yaghlane B.B., P. Smets and K. Mellouli, Directed evidential networks with conditional belief functions, Lecture Notes in Computer Science, vol. 2711, pp 291-305, 2004.

![Fig. 2. Characterization of a risk by [6].](https://thumb-eu.123doks.com/thumbv2/123doknet/3659874.108134/4.892.97.809.266.357/fig-characterization-risk.webp)