O
pen
A
rchive
T
OULOUSE
A
rchive
O
uverte (
OATAO
)
OATAO is an open access repository that collects the work of Toulouse researchers and
makes it freely available over the web where possible.
This is an author-deposited version published in :
http://oatao.univ-toulouse.fr/
Eprints ID : 15165
To link to this article : DOI :10.1007/s12678-013-0150-5
URL :
http://dx.doi.org/10.1007/s12678-013-0150-5
To cite this version : Groenen-Serrano, Karine and Weiss-Hortala,
Elsa and Savall, André and Spiteri, Pierre Role of hydroxyl radicals
during the competitive electrooxidation of organic compounds on a
boron-doped diamond anode. (2013) Electrocatalysis, vol. 4 (4). pp.
346-352. ISSN 1868-2529
Any correspondance concerning this service should be sent to the repository
administrator:
[email protected]
Role of Hydroxyl Radicals During the Competitive
Electrooxidation of Organic Compounds on a Boron-Doped
Diamond Anode
K. Groenen-Serrano&E. Weiss-Hortala&A. Savall&
P. Spiteri
Abstract A numerical model has been developed to estimate the role of hydroxyl radicals in the competition of organic compounds during electrolysis using a boron-doped diamond (BDD) anode. It is well established that hydroxyl radicals are generated during water discharge. These radicals are free at the surface and act locally, their sphere of activity was estimated by the model to be 20 nm maximum from the anode. The imple-mentation of the model taking account the presence of one and then two organic compounds in the solution can be used to predict the variation of the concentration of each organic with time during the electrolysis and their space profile in the electro-chemical reactor too without using adjustable parameters. The role of hydroxyl radicals was highlighted in the competitive reaction with organics: the electrolysis of a solution containing an equimolar mixture of formic acid (FA) and maleic acid (MA) shows that FA oxidation only began when the MA had complete-ly disappeared. The numerical model is in good agreement with the experiment and is thus suitable to describe the competition of two organics during electrolysis with a BDD anode.
Keywords Boron-doped diamond . Hydroxyl radicals . Numerical model . Electrooxidation of organics . Wastewater treatment
Abbreviations
C Concentration (in mole per cubic meter) C° Initial concentration (in mole per cubic meter)
Di Diffusion coefficient of the compound i (in square meter
per second)
j Current density (in Ampere in square meter)
jlim Limiting current density (in Ampere in square meter)
J Flux (in mole per square meter per second) kd Mass transfer coefficient (in meter per second)
ki Rate constant of chemical reaction involving•OH and
the organic compound i
L Thickness of the diffusion layer (in meter)
Mi Molar mass of the compound i (in grams per mole)
S Electrode area (in square meter) VT Volume of the solution (in square meter)
V Volume of the electrochemical reactor (in square meter) x Distance (in meter)
αi Number of electrons involving per molecule of the organic compound i
δ Thickness of the reaction layer
Introduction
The extraordinary properties of the boron-doped diamond (BDD) are due, in particular, to its capacity to generate free hydroxyl radicals. These hydroxyl radicals formed by water oxidation, weakly adsorbed at the electrode diffuse into the solution:
H2O→•OHþ Hþþ e ð1Þ
Because they are highly reactive, they recombine according to Eq.2
2•OH →k•OHH
2O2 ð2Þ
K. Groenen-Serrano (*)
:
E. Weiss-Hortala:
A. SavallUPS, CNRS, INPT, Laboratoire de Génie Chimique, Université de Toulouse, 118 Route de Narbonne, 31062 Toulouse, France e-mail: [email protected]
P. Spiteri
IRIT-ENSEEIHT, CNRS, 2 rue Camichel, B.P. 7122, 31071 Toulouse-Cedex, France
Present Address: E. Weiss-Hortala
Mines Albi, CNRS UMR 5302, Centre RAPSODEE, Campus Jarlard, Université de Toulouse, 81013 Albi Cedex 09, France
The rate constant of Eq. 2 is very high (k•OH¼ 5:50% 109mol−1L s−1) [1], the radicals act locally near the electrode. On the basis of these properties, questions relative to the per-formance of the BDD electrode arise: how far can the hydroxyl radicals (•OH) diffuse into the solution? What is the thickness of the zone where they can react chemically with organic com-pounds? Is it possible to quantitatively predict how two organics present simultaneously in the solution compete in reaction with hydroxyl radicals? Only a numerical model taking into account the diffusion of these radicals in the solution as well as the reaction rate of Eq.2will allow these questions to be answered. Various mathematical models describing the evolution of an organic compound during electrolysis with a BDD anode exist in the bibliography [2–5]. Until now, almost all of those based on the mineralization of solutions by electrooxidation were performed with solutions containing only a single compound. Wastewater composition is vastly more complex. It will there-fore be convenient to express the changes occurring in electro-lyzed real wastewater with the variations of global parameters such as the chemical oxygen demand or total organic carbon. However, we can expect variations in the concentration of every compound. Some experimental data have highlighted the sig-nificant difference of the oxidation rate between two species contained in a solution during its electrolysis [6,7]. To limit electric energy consumption, the strategy would be to partially mineralize an effluent up to its detoxification as a preliminary step before traditional biological treatment. It could contribute to developing the use of electrochemical processes in the field of wastewater treatment. The aim of this paper is to establish a theoretical model to estimate the competition of two species. This numerical model, without adjustable parameters, was val-idated with experimental data [7,8].
Published Experimental Results
Experimental data obtained from the electrolysis of solutions containing maleic acid (MA) or phenol (PH) and a mixture of MA and formic acid (FA) have been used to validate the numerical model. Experiments showed that hydroxyl radicals attack the carboxylic acids practically without formation of intermediate species diffusing back towards the bulk solution [7, 8]. Electrolyses were performed in a one-compartment electrolytic flow cell under galvanostatic conditions. Diamond was used as anode and zirconium as cathode. All electrodes were disks with a geometric area of 50 cm2each. Other details of the cell and setup were given previously [7].
Mathematical Model
Various mathematical models exist in the bibliography on the electrooxidation of organics at BDD anodes. A first model
was presented by Panizza et al. which predict the evolution of the chemical oxygen demand (COD) of a solution containing one organic compound during electrochemical oxidation on a BDD anode [2]. This model which provides a macroscopic view is very useful to assess the electrical charge necessary to remove a given COD value.
Canizares et al. presented a model describing the evolution of the concentration of an organic compound and the amount of carbon dioxide release during electrolysis [3]. In this model, the space between the anode and cathode is divided into three zones. Two electrochemical zones are close to electrodes and their thicknesses were assumed to be equivalent to the Nernst diffusion layer. The third zone, called the “chemical reaction zone”, corresponds to the bulk; the concentration of each compound is taken as the value measured experimentally. In the three zones, the concentration of each compound is consid-ered to be independent of the position and depend only on time. Mascia et al. [4] refined the approach in modeling by considering the phenomena taking place in the neighborhood of the anode: production of hydroxyl radicals, their reaction on organic compounds, and on themselves. Beyond this zone, called the diffusion zone, no radicals exist and the concentra-tion of organics is the same as that in the bulk. This model describes the chances occurring in the concentration of the organic compound in the solution. The approach of this group was to highlight the effects of the process parameters such as the hydrodynamic of the cell, the current density, and the presence of chlorides on the kinetic of the phenolic com-pounds oxidation [9]. The main intermediates appearing dur-ing the electrolysis at low current density were quantified.
In 2008, Kapalka et al. [5] proposed a model to describe the temporal and spatial variations of an organic compound dur-ing its oxidation. In this model, only one zone is considered between electrode and solution. They show the comparison of
•OH concentration profile for solutions containing formic
acid, methanol, and phenol; this profile has been used to predict the shift of the current–potential curves.
The aim of the present model is to establish numerical solutions of the equations to predict the temporal and space profile of the hydroxyl radicals and the organics present in the solution during a galvanostatic electrolysis using BDD anode under mass transfer control. The numerical model was devel-oped in three steps:
1. First, only the generation of the hydroxyl radicals and their recombination were taken into account. In the ab-sence of organic compounds, this first result allowed us to define the maximal thickness (δ) of the reaction zone. 2. The model was then implemented by adding an organic
compound in the solution.
3. The case of the electrolysis of a solution containing two different organic compounds was considered to predict their competition in relation to oxidation.
The numerical predictions of both steps were compared with experimental data from galvanostatic electrolysis of so-lutions containing either maleic acid or phenol or a mixture of maleic acid and formic acid [7,8].
Concentration Profile of the Hydroxyl Radicals
Considering electrolysis in an inert electrolyte without organic compounds it is assumed that on a BDD anode,•OH, which are formed from water discharge according to Eq.1, are free on the surface and diffuse into the solution. Because the radicals are highly reactive, in the absence of organic compounds, they can react with each other to form hydrogen peroxide (Eq.2).
By applying Fick’s law referring to molecular diffusion in a stagnant layer, the local molar balance for hydroxyl radicals is the following: ∂C•OH ∂t ¼ D•OH ∂2C•OH ∂x2 |fflfflfflfflfflfflfflffl{zfflfflfflfflfflfflfflffl} diffusion − k•OHC2•OH |fflfflfflfflfflffl{zfflfflfflfflfflffl} reaction ð3Þ
The initial condition is written by Eq.4:
C•OHð∀x≠0;t¼ 0Þ ¼ 0 ð4Þ
δ is defined as the boundary between the reaction zone and the diffusion zone. At this distance, the concentration of hydroxyl radicals is 0:
C•OHðx¼ δ; ∀tÞ ¼ 0 ð5Þ
while at the electrode (x=0), there is a surface concentration CS•OH:
Cs•OHðx¼ 0; ∀tÞ ¼ 0 ð6Þ
The expression of Cs•OH refers to the chemical reaction
given in Eq.2and the molecular diffusion in a stagnant layer at steady state: 0¼ D•OH ∂2C•OH ∂x2
j
x¼0−k•OHC 2 •OH ð7ÞThe flux of hydroxyl radicals at the electrode surface can be expressed following Eqs.8and9:
J•OH
j
x¼0¼ D •OH ∂C•OH ∂xj
x¼0 ð8Þ J•OHj
x¼0¼ j F ð9Þwhere j the applied current density (in Ampere per square meter).
From Eqs. 7–9, the surface concentration of hydroxyl radicals can be obtained:
C•OHðx¼ 0; ∀tÞ ¼ C s •OH¼ ffiffiffiffiffiffiffiffiffiffiffiffiffiffiffiffiffiffiffiffiffiffiffiffiffi 1:5 j2 F2D•OHk•OH 3 s ð10Þ In order to obtain the concentration profile of hydroxyl radicals with respect to time and space, Eq. 3 was solved numerically. The discretisation of the boundary value prob-lems was achieved using the finite difference method. More precisely, the spatial part was discretised by the classical discretisation scheme and the time-dependent part was discretised by an implicit time marching scheme. Classically, such schemes ensure the unconditional numerical stability of the numerical scheme. Then, after discretisation of each boundary value problem, at each time step, an algebraic system has to be solved. Due to the nonlinear terms contained in the boundary value problems, the numerical solution of the associated algebric system was obtained using, at each time step, the classical Newton–Raphson method corresponding to a local linearization at the current point of computation.
Figure1 shows the variation of the concentration of hy-droxyl radicals as a function of the distance from the anode surface during 2 s. The thickness of the reaction zone was estimated by Mascia et al. [4], the value of δ was fixed at 100 nm. Figure1 shows that the zero concentration of hy-droxyl radicals is reached at a distance of the electrode less than 20 nm. The hypothesis widely expressed in the bibliog-raphy, that the radicals which are not adsorbed at the electrode do not reach the heart of the solution, is well verified here.
Beyond a few dozen nanometers, the hydroxyl radicals are no longer present in the solution, this δ can probably be even more reduced in the presence of an organic compound for which the rate constants ki is higher than k•OH, as shown
Kapalka et al. [5]. Other tests were carried out and showed that the size of δ does not change whatever the concentration of hydroxyl radicals (or the applied current density).
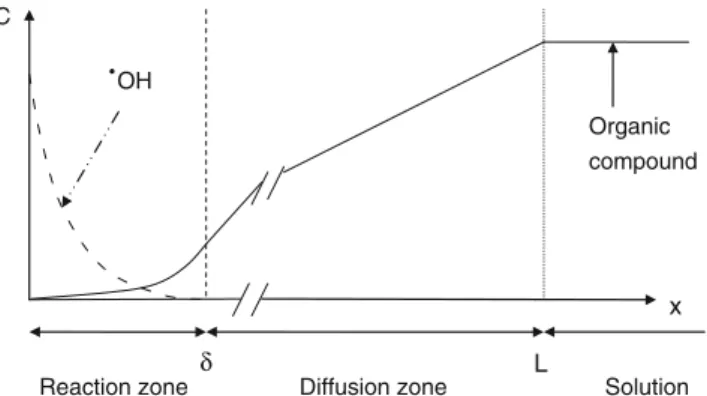
To highlight the zone where hydroxyl radicals act, three zones have to be considered as presented in Fig.2.
1. Very close to the electrode (x<δ), the hydroxyl radicals are formed by water oxidation and react with organic compounds or recombine.
2. An intermediate zone (δ<x<L) where the electroactive species diffuse towards the anode and the concentration of hydroxyl radical equals zero.
3. Beyond (x>L), the concentrations are those in the reser-voir which can be compared with experimental values. In the Presence of One Organic Compound in the Solution The model was implemented by adding an organic compound to the solution. The hydroxyl radicals can react with the organic compound following Eq.11:
CxHyOz→
•OH
products →•OHxCO2þwH2O ð11Þ
Thus, in the reaction zone (0<x<δ), Eqs. 2 and 11 were taken into account. In general, chemical reaction modeling is formulated assuming a second*order rate expression depending on the concentration of the•OH radicals and the organic com-pound (i=1) and its possible intermediates (1<i≤n):
Reaction rate¼ k•OHC2•OHþ
X
i¼1 i¼n
kiC•OHCi ð12Þ
Mineralization is observed during electrochemical oxida-tion of phenol or other organic compounds when the process is controlled by mass transfer; in this case, the current density is higher than the limiting current density, jlim defined by
Eq.13[2]:
jlim¼ 4 F kdCOD ð13Þ
Where kd(in meter per second) is the mass transfer
coeffi-cient estimated by the hydrodynamics of the cell [10] and COD is the chemical oxygen demand of the solution expressed in mole of O2per cubic meter.
Under these experimental conditions, the flux of ·OH rad-icals is always higher than that required for the chemical
reaction with organics. As it was shown that the quantity of intermediates is negligible during electrolysis at high current density on the BDD anode [8, 11,12], the second term of Eq.12can be rewritten:
X
i¼1 i¼n
kiC•OHCi¼ α1k1C•OHC1 ð14Þ
where α1represents the number of electrons (hydroxyl radicals)
involved in the chemical reaction per molecule of organic compound 1. As a first assumption, the value of α is taken as the number of electrons necessary to obtain complete mineral-ization (without formation of by-products). It was assumed that the beginning of the oxidative attack of an organic molecule is located at an active site where the mineralization continues via hydroxyl radicals which are free on the BDD surface.
Based on the considerations reported in Eqs.12and14, the
•OH radicals balance is therefore the following:
∂C•OH ∂t ¼ D•OH ∂2C•OH ∂x2 − k•OHC 2 •OH−α1k1C•OHC1 |fflfflfflfflfflfflfflfflfflfflfflfflfflfflfflfflfflfflffl{zfflfflfflfflfflfflfflfflfflfflfflfflfflfflfflfflfflfflffl} reaction ð15Þ
The organic compound 1 balance, 1, is given by Eq.16: ∂C1
∂t ¼ D1 ∂2C1
∂x2 −k1C•OHC1 ð16Þ
It is important to note that the disappearance of a molecule of organic compound is effective as soon as it reacts with an
•OH radical:
CxHyOzþ•OH → k1
CxHy−1Oz•þ H2O ð17Þ
Consequently, the rate of disappearance of the organic compound does not depend on the number of radicals reacting on it but on the mass transport rate which results from hydro-dynamic conditions. 0 0.04 0.08 0.12 0 10 20 30 40 50 H y d rox y l ra d ic a ls con ce n tr a ti o n / m M Distance/nm Time
Fig. 1 Simulated concentration profiles of hydroxyl radicals according to Eqs.3–10. Electrolysis conditions— kd=2×10⁻⁵m s−1, j=400 A m−2
Reaction zone Diffusion zone Solution Organic compound x C •OH δ L
Fig. 2 Schematic representation of concentration profiles of hydroxyl radicals and of an organic compound using the BDD anode
The rate constants for reactions kiwith hydroxyl radicals
have been determined in aqueous solution by pulse radiolysis for a great number of organic compounds. Table1 presents some values of rate constants used in our calculations.
The initial condition for the organic compound is the following:
C1ð∀x; t¼ 0Þ ¼ C '
1 ð18Þ
Taking into account the results obtained in the “ Concentra-tion Profile of the Hydroxyl Radicals” section (Fig.1), the boundary conditions are defined in the reaction zone (0≤x≤δ) and the diffusion zone (δ≤x≤L) by Eqs.19and20.
At the electrode surface, the flux of organic compound equals zero:
dC1
dx
j
x¼0¼ 0 ð19ÞIn the diffusion layer (δ<x<L), there are no hydroxyl radicals; only the diffusion of the organic compound has to be considered with the boundary conditions given by Eq.20: D1 S V dC1 dx
j
x¼Lþ dC1 dtj
x¼L¼ 0 ð20ÞThis model does not require experimental values and de-pends only on the input parameters corresponding to the organic compound (°C1,D1,k1)and the electrolysis conditions (j, kd).
For example, in the case of MA, the number of electrons (α) necessary to mineralize one molecule equals 12 (Eq.21).
C4H4O4þ4H2O→4CO2þ12Hþþ 12e ð21Þ
This α value implies that one molecule of MA which diffuses into the reaction layer (δ, ~20 nm) exchanges 12 electrons indirectly by reaction with hydroxyl radicals without possible escape before reaching its complete mineralization. The thickness of the reaction zone is identical to that obtained without organic species.
The diffusion layer can be estimated: L¼DMA kd ¼
4:96%10 −10 2%10−5
≈2:5% 10−5m:All the values of these input parameters of organics and hydroxyl radicals are given in Table1.
Figure3 shows the calculated temporal concentration of maleic acid and hydroxyl radicals on the anode surface during an electrolysis run. The concentration trend of MA is not linear and tends to be zero because of its depletion at the surface. Simultaneously, the hydroxyl radical concentration increases with time, also because of the depletion of MA close to the electrode.
In the Presence of Two Organic Compounds in the Solution Previous electrolyses performed with a solution containing two different organic compounds highlighted the competition of organics for reaction with hydroxyl radicals [6, 7]. For instance, galvanostatic electrolysis was carried out using a solution containing MA and FA at equimolar initial concen-trations [7]. At the beginning of the electrolysis, MA was rapidly oxidized (90 % removal) whereas the amount of FA decreased only by 20 %. The model was implemented to predict the variation of the concentration of two organic compounds simultaneously present in the solution and which enter competition to consume the •OH radicals. In
practice, with this model, the possibility of a selective treat-ment of an effluent containing several compounds can be envisaged.
The molar balance for organics (compounds 1 and 2) and for hydroxyl radicals are represented by Eqs.22–24.
Table 1 Values of the input parameters for the model
Value Reference DFA(m2s−1) 1.7×10⁻⁹ [1] DMA(m2s[FA]1) 4.96×10⁻¹⁰ [13] D·OH(m2s−1) 2.80×10⁻⁹ [14] DPH(m2s−1) 1.00×10⁻⁹ [15,16] kFA(L mol−1s−1) 1.3×10⁸ [1] kMA(L mol−1s−1) 6.0×10⁹ [17] k·OH(L mol−1s−1) 5.5×10⁹ [1] kPH(L mol−1s−1) 6.6×10⁹ [18] α FA 2 α MA 12 α PH 28 0 0.04 0.08 0.12 0 2 4 6 C s/m M Time /h [ OH] [MA]
Fig. 3 Temporal concentration variation of maleic acid and hydroxyl radicals at the electrode surface (x=0) during electrolysis using the BDD
anode. Electrolysis conditions—[MA]°=0.09 M, [HClO4]=1 M,
∂C1 ∂t ¼ D1 ∂2C1 ∂x2 −k1C•OHC1 ð22Þ ∂C2 ∂t ¼ D2 ∂2C2 ∂x2 −k2C•OHC2 ð23Þ ∂C•OH ∂t ¼ D•OH ∂2C•OH ∂x2 −k•OHC 2 •OH−α1k1C•OHC1−α2k2C•OHC2 ð24Þ
The values of α1 and α2 are taken as the number of
electrons necessary to obtain complete mineralization per molecule of compounds 1 and 2, respectively (Table1).
Model Validation
Experimental data obtained from electrolysis of solution con-taining MA or PH and a mixture of MA and FA were used to validate the numerical model.
Presence of One Organic Compound
Electrolyses were performed with solutions containing MA or PH taken as model pollutants present in most effluents. Aro-matic compounds are generally toxic and those having a quinone structure have very high toxicities. MA is one of the main intermediates formed during the oxidation of the aro-matic compounds contained in aqueous wastes.
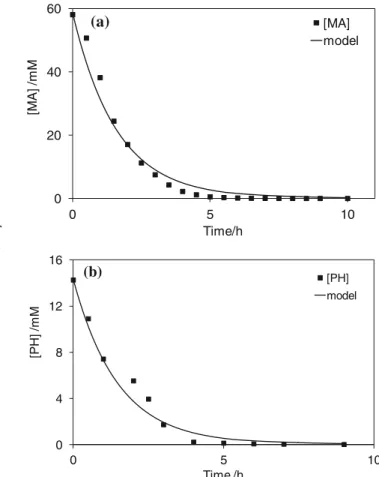
MA was oxidized in 1 M perchloric acid under a constant current density of 40 mA cm−2. Figure4ashows the variation of the experimental MA concentration during electrolysis on BDD. Calculations made by numerical resolution of Eqs.14 and15give a curve in good agreement with the experimental points. Another comparison between the numerical model and experiments was performed during galvanostatic electrolysis of a 20 mM phenol solution at 47 mA cm−2(Fig. 4b). In accordance with the stoichiometry of Eq. 25, the value of αPH=28 gives a good fit between the calculated curve and experimental points.
C6H5OHþ 11H2O→6CO2þ28Hþþ 28e ð25Þ
In both cases, comparison of numerical and experimental results shows good agreement. Other current densities were tested and, in each case, the numerical curve is well superimposed with the experimental points (not shown). This model seems to be suited to describing the variations occur-ring in the concentration of an organic compound duoccur-ring electrolysis with a BDD anode.
In the Presence of Two Organic Compounds
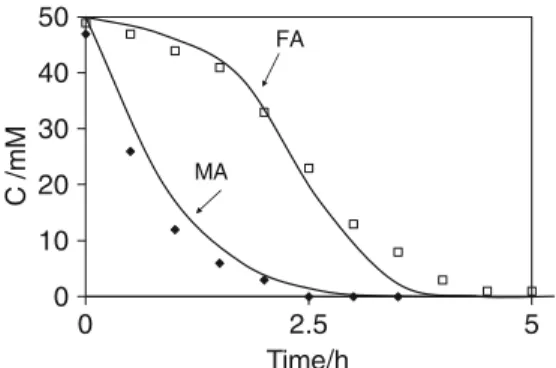
Figure 5 shows the experimental data obtained during the electrolysis of a solution initially containing MA and FA, both at an initial concentration of 0.05 M. At the beginning of electrolysis, MA was rapidly oxidized while FA was slowly oxidized. For a charge of 7 Ah L−1, the MA concentration decreased by as much as 87 % while the FA decreased by only 20 %. The results presented in Fig.5show that the competitive reaction between organics and hydroxyl radicals is in favor of MA and in complete agreement with the value of the ratio between rate constant kMA and rate constant kFA (kMA/
kFA=46). The numerical values are in good agreement with
the experimental value with αMA=12 for MA (Eq.21) and
αFA=2 for FA (Eq.26).
CH2O2→CO2þ2Hþþ 2e ð26Þ
These results are in good agreement with the assumed mechanism involving homogeneous-like reactions between
0 20 40 60 0 5 10 [M A ] /m M Time/h [MA] model
(a)
0 4 8 12 16 0 5 10 [P H ] /m M Time /h [PH] model (b)Fig. 4 a Numerical (line) and experimental (symbol) variation of MA concentration during electrolysis of a solution containing MA.
Electrol-ysis conditions—[MA]°=0.05 M, [HClO4]=1 M, kd=2×10⁻⁵ m s−1,
j=400 A m−2, αMA=12, T=20 °C, VT=1 L; anode, BDD; cathode, Zr.
b Numerical (line) and experimental (symbol) variation of phenol con-centration during electrolysis of a solution containing phenol. Electrolysis
conditions—[phenol]=0.02 M, [H2SO4]=0.1 M, kd=2×10⁻⁵ m s−1,
an organic compound and hydroxyl radicals in the very thin reaction layer close to the BDD anode; it suggests also that it is possible to model competing oxidation reactions taking place on BDD by using the rate constant of pure homogeneous reactions between organic and hydroxyl radicals. In the case of competition between MA and FA, the kinetic data from pulse radiolysis measurements (Table1) are suitable to predict the competition occurring between two compounds with re-spect to the electrochemical oxidation on the BDD anode.
Conclusion
The numerical model proposed in this paper sheds light on the role of hydroxyl radicals during the electro-oxidation of or-ganics on a BDD anode:
1. It is shown that the region of chemical activity of hydroxyl radicals is very close to the BDD surface (less than 20 nm). The hydroxyl radicals are not adsorbed on the surface; they are available to react chemically with the organics present in the solution and which diffuse to the anode. BDD is more effective for mineralization than other electrodes which are more selective (like PbO2).
This specific electrocatalytic activity results from to the number of electrons exchanged (α in the model) which is close to its maximum theoretical value.
2. The absence of intermediate species in the bulk during oxidation suggests that a molecule arriving in contact with the BDD surface is completely mineralized in the same site.
3. The model estimates the competition between two organic compounds simultaneously present in the same solution
and predicts the rate of oxidation of each. Naturally; this model could be developed with more than two com-pounds. Without the need for adjustable parameters, this model presents progress compared with models existing in the bibliography.
It can be useful for the study of the electrochemical treat-ment of wastewater containing at least one biorefractory com-pound. As an example, persistent organic pollutants (POPs) like pharmaceuticals or metabolites which are not removed by biological processes persist and accumulate in the ment and have potential significant impacts on the environ-ment and on human health. By developing this kind of model, it could be possible, for example, to evaluate the electrical charge necessary to remove the POPs before further biological treatment and discharge.
References
1. G.V. Buxton, C.L. Greenstock, W.P. Helman, A.B. Ross, J. Phys. Chem. Ref. Data 17, 513 (1988)
2. M. Panizza, P.A. Michaud, G. Cerisola, C.H. Comninellis, J. Electroanal. Chem. 507, 206 (2001)
3. P. Canizares, J. Garcia-Gomez, J. Lobato, M.A. Rodrigo, Ind. Eng. Chem. Res. 43, 1915 (2004)
4. M. Mascia, A. Vacca, S. Palmas, A.M. Polcaro, J. Appl. Electrochem. 37, 71 (2007)
5. A. Kapalka, G. Foti, C.H. Comninellis, Electrochim. Acta 54, 2018 (2009)
6. B. Marselli, J. Garcia-Gomez, P.-A. Michaud, M.A. Rodrigo, C.H. Comninellis, J. Electrochem. Soc. 150(3), D79 (2003)
7. E. Weiss, K. Groenen-Serrano, A. Savall, C.H. Comninellis, J. Appl. Electrochem. 37, 1337 (2007)
8. E. Weiss, K. Groenen-Serrano, A. Savall, J. Appl. Electrochem. 38, 329 (2008)
9. M. Mascia, A. Vacca, A.M. Polcaro, S. Palmas, J. Rodriguez Ruiz, A. Da Pozzo, J. Hazard. Mater. 174, 314 (2010)
10. C. Flox, E. Brillas, A. Savall, K. Groenen-Serrano, Curr. Org. Chem. 16, 1960 (2012)
11. A.M. Polcaro, M. Mascia, S. Palmas, A. Vacca, J. Appl. Electrochem. 33, 885 (2003)
12. P. Cañizares, J. Lobato, R. Paz, M.A. Rodrigo, C. Sáez, Water Res. 39, 2687 (2005)
13. V.G. Gurjar, I.M. Sharma, J. Appl. Electrochem. 19, 113 (1989) 14. A.J. Elliot, Rate constants and G-values for the simulation of the
radiolysis of light water over the range 0–300 °C (AECL report 11073, Ontario, 1994)
15. Q. Fulian, R.G. Compton, Anal. Chem. 72(8), 1830 (2000) 16. A. Plugatyr, I. Nahtigal, I.M. Svishchev, J. Chem. Phys. 124, 024507
(2006)
17. D.E. Cabelli, B.H.J. Bielski, Z. Natürforsch. 40b, 1731 (1985) 18. R.J. Field, N.V. Raghavan, J.G. Brummer, J. Phys. Chem. 86, 2443
(1982) 0 10 20 30 40 50 0 2.5 5 C / m M Time/h MA FA
Fig. 5 Numerical (lines) and experimental (symbols) variation of con-centration during electrolysis of a solution containing MA and FA.
Electrolysis conditions—[MA]°=0.05 M, [FA]°=0.05 M, [HClO4] =
1 M, kd=2×10⁻⁵m s−1, j=400 A m−2, αMA=12, αFA=2, T=20 °C,