HAL Id: hal-00572425
https://hal-mines-paristech.archives-ouvertes.fr/hal-00572425
Submitted on 1 Mar 2011
HAL is a multi-disciplinary open access
archive for the deposit and dissemination of
sci-entific research documents, whether they are
pub-lished or not. The documents may come from
teaching and research institutions in France or
abroad, or from public or private research centers.
L’archive ouverte pluridisciplinaire HAL, est
destinée au dépôt et à la diffusion de documents
scientifiques de niveau recherche, publiés ou non,
émanant des établissements d’enseignement et de
recherche français ou étrangers, des laboratoires
publics ou privés.
occurring in a unidirectional carbon/epoxy composite
identified in a multi-scale micro-mechanical model with
that of experimental observations using high resolution
computed tomography
A.E. Scott, I. Sinclair, S.M. Spearing, M. Mavrogordato, Anthony R. Bunsell,
Alain Thionnet
To cite this version:
A.E. Scott, I. Sinclair, S.M. Spearing, M. Mavrogordato, Anthony R. Bunsell, et al.. Comparison of
the accumulation of fibre breaks occurring in a unidirectional carbon/epoxy composite identified in
a multi-scale micro-mechanical model with that of experimental observations using high resolution
computed tomography. Matériaux 2010, Oct 2010, Nantes, France. 9 p. �hal-00572425�
Comparison of the accumulation of fibre breaks occurring in a
unidirectional carbon/epoxy composite identified in a multi-scale
micro-mechanical model with that of experimental observations using
high resolution computed tomography
A.E.Scotta, I.Sinclaira, S.M.Spearinga, M.M avrogordatoa
and
A.Bunsellb,A.T hionnetb,c
a - School of Engineering Sciences, University of Southampton, United-Kingdom
e-mail : a.scott@soton.ac.uk, i.sinclair@soton.ac.uk, s.m.spearing@soton.ac.uk, m.mavrogordato@soton.ac.uk b - Mines ParisTech, Centre des Matériaux, CNRS UMR 7633, BP 87, 91003 Evry cedex, France
e-mail : alain.thionnet@ensmp.fr, anthony.bunsell@ensmp.fr c - Université de Bourgogne, Mirande, BP 47870, 21078 Dijon, France
e-mail : alain.thionnet@u-bourgogne.fr
ABSTRACT
A model to predict fibre break accumulation that takes into account all physical phenomena at the origin of the fibre break (i.e. the random nature, stress transfer due to breaks, fibre debonding and viscosity of the matrix) shows clearly that the failure of a unidirectional composite structure results in the formation of random fibre breaks which at higher loads coalesce into clusters of broken fibres.
The object of the study is to experimentally confirm this scenario. Many techniques exist to detect the failure of carbon fibre composites, however none of them offer a resolution that allows this goal to be achieved in a non-destructive manner and in three dimensions.
High resolution computed tomography has been used to confirm the scenario modelled. A sample was tested and observed in-situ at the European Synchrotron Research Facilities, ESRF, Grenoble. All fibre breaks arising in the vicinity of the final rupture of a unidirectional composite have been detected and the formation of clusters can be observed.
MOTS-CLES : high resolution computed tomography, fibre break, multi-scale modelling, unidirectional composite, micromechanics.
1
Introduction
Many micromechanical theories exist to predict the failure of unidirectional composites. In tension, the failure of fibres is the critical damage mechanism, since the strength of an axially loaded unidirectional composite is dominated by the strength of the fibres. These simulations tend to include the statistical nature of fibre [1], calculation of the stress transfer coefficient around a fibre break [2] [3] [4] and coalescence of broken fibres into a critical cluster size resulting in final failure [5].
Experimental work to confirm the underpinning assumptions made in these theories however is limited and hence the true validity of the work has not yet been fully determined. The microscopic structure and complex nature of the failure process of composite laminates is difficult to characterise entirely. Previous work uses methods such as microscopy and acoustic emission sensing, to capture damage initiation and progression found in loaded composite structures. These methods however are limited. Microscopy is typically time consuming, with resultant images yielding a 2D representation of 3D processes [6]. Whilst offering good in-situ sensing, acoustic emission offers poor spatial resolution (in the order of mm) with potential ambiguity in interpretation. High resolution computed tomography, CT, is gaining interest as an ideal tool for material mechanics studies [7]. It is a non-invasive method and provides 3D images in the micrometer and sub-micrometer range, of internal characteristics of materials and structures. CT can also be identified with what we are calling a data rich mechanics approach, where huge amounts of information of the micromechanical structure and behaviour can be identified in a relatively short space of time, depending of the equipment used, anything between a few minutes and an hour can yield two thousand 2D projections.
In the present work, high-resolution synchrotron radiation CT results have been obtained for carbon/epoxy [90°/0°]s composite laminates subject to in-situ loading to failure. Due to the failure process, the data from
these samples can be used to compare with a unidirectional laminate. It can be seen in the results that matrix damage occurs in advance to fibre breaks and in fact decouples the 90° plies from the 0° plies. The fibre breaks then occur at higher loads in only the 0° plies.
The images enable individual fibres breaks to be identified and quantified. Providing a data set for existing predictive models to be compared and validated. The results give a unique physical insight into the failure process and enables the critical cluster size of fibre breaks to be identified.
2
Experimentation
Laminated [0°/90°]s T700 aerospace grade carbon fibre pre-preg specimens were provided by Airbus and
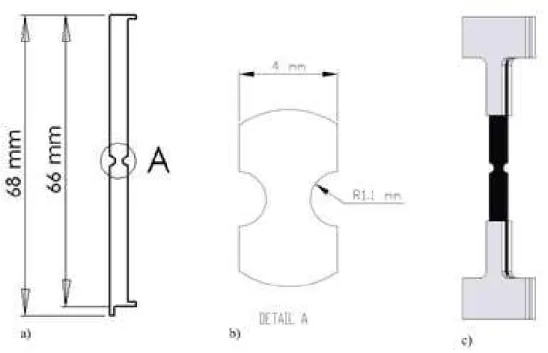
prepared by Wright et al. [8] for tensile loading. The double edge notches were machined using an abrasive waterjet to the geometry shown in Figure 1. The notched samples were used to ensure all damage mechanisms close to final failure could be captured. A sparse population of small aluminium particles (≈ 4µm) were embedded into the laminates for fiducial markers.
A screw driven load frame, Figure 2 was used to load the samples in situ to failure. The samples were taken to incremental loads up to final failure. At each load step the samples were imaged at ID19 beamline at the European Synchrotron Radiation Facilities (ESRF) in Grenoble.
ID19 beamline routinely achieves resolutions of 300nm and with specialised optics can achieve even high resolutions. The optics used in this studied enabled a voxel resolution of 1.4µm to be achieved. The coherent beam available from the synchrotron makes it possible for phase contrast imaging to be used, so an edge detection method can be exploited. This enables a crack opening of 1/10th of the voxel size to be distinguishable and assists in finding small features such as fibre breaks.
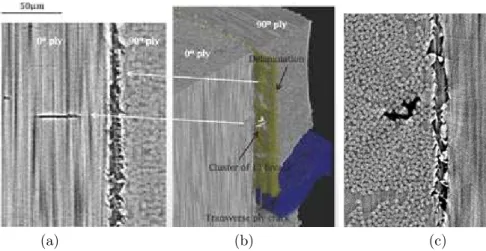
High resolution is achieved via the high beam flux falling on a very high resolution detector system. In this experiment a FReLoN (Fast Read-out, Low Noise) detector attached to a 2048 × 2048 pixel CCD camera was used. In comparison to conventional micro focus CT this enables relatively short exposure times (approximately 5 minutes a scan), so scans take a matter of minutes rather than hours. The detector measures the intensity distribution of the X-ray beam transmitted through the sample, which is proportional to the material density and also carries an energy dependence that is a function of the material composition [9]. The X-ray absorption is represented by corresponding grey scales and thus material and features such as cracks, voids and fibre breaks can be distinguished via a characteristic grey scale level shown in Figure 3. The result of the phase contrast imaging can also be seen in Figure 3, as black and white fringes surrounding the voids. Further details of the imaging setup can be found at [8].
The data was reconstructed using ESRF in-house software and the resulting 3D volumes were analysed using the software VG studio to segment and highlight regions of interest, such as cracks and fibre breaks, to present 3D images of the data.
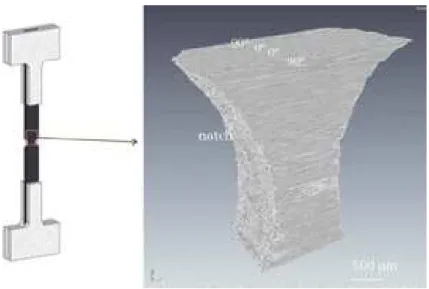
Figure 4 shows the location in which the sample has been analysed and identifies the ply layup on a 3D reconstructed volume. The in-situ loading enables the damage progression to be identified up to failure, where Figure 5 shows the crack propagation in the same sample taken up to failure at 10% increments of the ultimate tensile strength, UTS. The transverse ply cracks occur early on in loading at 30% of the UTS. Further loading induces 0° splits which are then followed by delaminations.
Analysis of the in-situ samples shows the matrix cracking occurs in advance to fibre breaks and decouples the 90° plies from the 0° plies. There is no correlation between the fibre breaks and the matrix cracking and therefore the fibre breaks are the dominant damage mechanism.
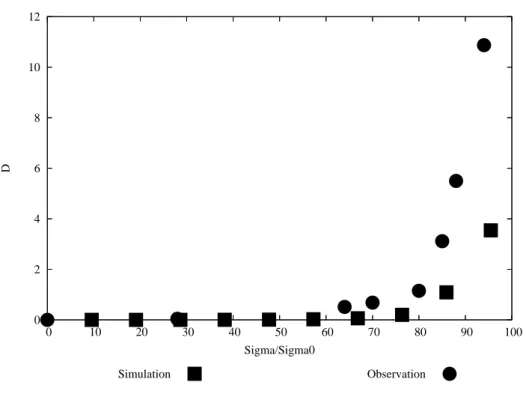
The 3D capabilities of the CT imaging enables all fibre breaks to be identified in the sample through out the whole imaged volume. Figure 6 shows fibre breaks in exactly the same sample at two load increments. The same locations can be found in both samples using the marker particles. It is possible to see the accumulation of fibre breaks occurring with increasing load. Figure 7 shows a graph of the accumulation fibre breaks occurring in the samples with increasing load. The results show a distinct acceleration of fibre breaks occurring in the last 90% of loading.
It has also been possible to capture the growth of fibre clusters. Table 1 shows the cluster formation with increasing load. At 94% of the failure load 3 large clusters where found, consisting of 6, 8 and 12 neighbouring fibres. The largest of which can be seen in Figure 8. Where is is possible to view the clusters at all orientations and in 3 dimensions.
3
Modelling the phenomenon of fibre breakage and the comparison
with experimental observations obtained by CT
The failure of unidirectional composite specimens has been studied for many years, with both analytical and statistical approaches being adopted, however few numerical models have been developed which take into account the viscoelastic behavior of the matrix. The following works can be cited, for example : Rosen [1], Cox [10], Zweben [11], Hedgepeth [3], Ochiai et al. [12], Goree and Gross [13], Harlow and Phoenix [2] [14], Scop and Argon [15] [16], Kong [17], Batdorf [5] [18], Nedele and Wisnom [19] [20], Hedgepeth and Van Dyke [4], Baxevanakis [21], Landis et al. [22] [23], Phoenix et al. [24] [25], Wisnom [26], Van Den Heuvel et al. [27] [28], Lipschitz and Rotem [29], Lagoudas et al. [30], Beyerlein et al. [31].
In this work, the phenomenon of fiber breakages in a unidirectional composite is studied at a microscopic scale, where the fibres and matrix are considered to be homogeneous materials.
The works of Blassiau et al. [32] [33] [34] [35] and those of Baxevanakis [21] initially identified the micro-structure of the representative volume element (RVE) of the healthy material (i.e., not damaged and with out fibre breaks) symbolized by the cell called CS32, which contains 32 fibres.
At the microscopic scale a model of the phenomenon of fibre breakages and its consequences was constructed [32] [33] [34] [35] that takes into account :
– the random and inhomogenous nature of failure strength along the fibre axis. The variation of the Wei-bull modulus when only a small population, compared to a much larger population which leads to a deterministic value of the modulus, is considered, has also been taken into account [36] ;
– the number of broken fibres in the RVE through five states that allow damage to move from healthy microstructure to totally damaged. These five states of damage are symbolized by the representative cell of their RVE. These cells are named : C32, C16, C8, C4, C2. They containN = 1, 2, 4, 8, 16 broken fibres respectively among the 32 fibres present in the CS32 cell ;
– axial stress transfer from broken fibres to intact fibres ;
– axial stress transfer induced by the debonding of the fibre/matrix interface around the fibre break ; – axial stress transfer induced by the viscoelastic behavior of the matrix (assumed linear).
The simulations have been carried out by the Finite Element Method (Figure 9) employing the Zebulon code developed at the Mines Paristech using a simplified F E2
multiscale process [37]. There is good correlation between the observations and simulations. In addition, the simulations show that close to the final fracture of the sample, the fibre breaks no longer appear at random but group to form clusters which indicate the beginning of (unstable) rupture of the sample [37].
4
Conclusion
A notched [90°/0°]s laminate has been used to gather a data set of damage mechanisms that occur in-situ
loading to failure. Matrix crack formation occurs in the 90° plies prior to fibre breakages. As the load is increased the 90° plies become decoupled from the 0° plies and no relationship has been found between the matrix cracks and fibre breaks. Therefore it is evident that this sample layup can be used to inform a unidirectional model as to exact fibre break numbers, location and spatial distribution.
The accumulation of fibre breaks with load can be captured, where an acceleration of fibre breaks occurs beyond 90% of the failure load. The formation of fibre clusters is also identified, where the largest cluster was found to be 12 neighbouring fibre breaks at 94% of the failure load.
The data that can be extracted from these samples using the techniques included in this paper can be used with confidence ; all fibre breaks and other damage mechanisms are easily distinguished and segmentable. Highly detailed quantification of material characteristics and failure mechanisms found in composite structures can been identified, which can then be used to inform and validate predictive modelling methods.
The fibre breaks observed by CT appear in an identical manner to the modelling predictions : in a state close to the utimate failure of the sample, the fibre breaks no longer appear at random but group together to form clusters. This validates the relevance of the model and the assumptions with which is was built. Intralaminar cracks are also highlighted in the CT observations. They are not currently taken into account. However, it is highly likely that if these effects are taken into account the agreement between experiment (Figure 7) and model would be even closer. In fact, the intralaminar cracks that appear in the à 90° layers will degrade the properties of the plies and hence increase the stress of the à 0° plies : the fibre breaks will then occur earlier and faster.
Références
[1] B.W. Rosen. Tensile failure of fibrous composites. AIAA journal, 2 :1985–1991, 1964.
[2] D.G. Harlow and S.L. Phoenix. The chain-of-bundles probability model for the strength of fibrous materials 1 : Analysis and conjectures. Journal of composite materials, 12 :195–213, 1978.
[3] J.M. Hedgepeth. Stress concentrations in filamentary structures. Rapport, NASA TND882, Langley research center, 1961.
[4] J.M. Hedgepeth and P. Van Dyke. Local stress concentrations in imperfect filamentary composite materials. Journal of composite materials, 1 :294–309, 1967.
[5] S.B. Batdorf. Tensile strength of unidirectionally reinforced composites - 1. Journal of reinforced plastics and composites, 1 :153–163, 1982.
[6] F. Desplenterre, S.V. Lomov, D.L. Woerdeman, I. Verpoest, M. Wevers, and A. Bogdanovich. Micro-ct characterization of variability in 3d textile architecture. Composites Science and Technology, 65 :1920–1930, 2005.
[7] P. Wright, X. Fu, I. Sinclair, and S.M. Spearing. Ultra high resolution computed tomography of damage in notched carbon fibre-epoxy composites. Journal of Composite Materials, 42 :1993–2002, 2008.
[8] P. Wright, A. Moffat, I. Sinclair, and S.M. Spearing. High resolution tomographic imaging and modelling of notch tip damage in a laminated composite. Composites Science and Technology, In press, 2010. [9] ASTM. Standard guide for computed tomography (ct) imaging. ASTM Report, E1441-00, 2007.
[10] H.L. Cox. The elasticity and strength of paper and other fibrous materials. British journal of applied physics, 12 :72–79, 1951.
[11] C. Zweben. Tensile failure of fibers composites. AIAA journal, 6 :2325–2331, 1968.
[12] S. Ochiai, K. Schulte, and P.W. Peters. Strain concentration for fibers and matrix in unidirectional com-posites. Composites science and technology, 41 :237–256, 1991.
[13] J.G. Goree and R. Gross. Stresses in a three-dimensional unidirectional composite containing broken fibers. Engineering fracture mechanics, 13 :395–405, 1980.
[14] D.G. Harlow and S.L. Phoenix. The chain-of-bundles probability model for the strength of fibrous materials 2 : a numerical study of convergence. Journal of composite materials, 12 :314–334, 1978.
[15] P.M. Scop and A.S. Argon. Statistical theory of strength of laminated composites. Journal of composite materials, 1 :92–99, 1967.
[16] P.M. Scop and A.S. Argon. Statistical theory of strength of laminated composites 2. Journal of composite materials, 3 :30–44, 1969.
[17] P. Kong. A monte carlo study of the strength of unidirectional fiber-reinforced composites. Journal of composite materials, 13 :311–327, 1979.
[18] S.B. Batdorf. Tensile strength of unidirectionally reinforced composites - 2. Journal of reinforced plastics and composites, 1 :165–175, 1982.
[19] M.R. Nedele and M.R. Wisnom. Three dimensional finite analysis of the stress concentration at a single fibre break. Composites science and technology, 51 :517–524, 1994.
[20] M.R. Nedele and M.R. Wisnom. Stress concentration factors around a broken fibre in a unidirectional carbon fibre-reinforced epoxy. Composites, 25 :549–557, 1994.
[21] C. Baxevanakis. Comportement statistique à rupture des composites stratifiés. Thèse, Ecole des Mines de Paris, 1994.
[22] C.M Landis and R.M. McMeeking. Stress concentrations in composites with interface sliding, matrix stiffness and uneven fiber spacing using shear lag theory. International journal of solids and structures, 36 :4333–4361, 1999.
[23] C.M Landis, I.J. Beyerlein, and R.M. McMeeking. Micromechanical simulation of the failure of fiber reinforced composites. Journal of the mechanics and physics of solids, 48 :621–648, 2000.
[24] S.L. Phoenix. Statistical issues in the fracture of brittle matrix fibrous composites : localized load-sharing and associated size effects. International Journal of Solids and Structures, 34 :2649–2668, 1997.
[25] S.L. Phoenix and I.J. Beyerlein. Statistical strength theory for fibrous composite materials. in Compre-hensive composite materials, Pergamon-Elsevier Science, A. Kelly and C. Zweben editors :559–639, 2000.
[26] M.R. Wisnom and D. Green. Tensile failure due to interaction between fibre breaks. Composites, 26 :499– 508, 1995.
[27] P.W.J. Van den Heuvel, S. Goutianos, R.J. Young, and T. Peijs. Failure phenomena in fibre-reinforced composites part 6 : a finite element study of stress concentrations in unidirectional cfr epoxy composites. Composites science and technology, 64 :645–656, 2004.
[28] P.W.J. Van den Heuvel, M.K Wubbolts, R.J. Young, and T. Peijs. Failure phenomena in two-dimensional multi-fibre model composites : 5. a finite element study. Composites A, 29 :1121–1135, 1998.
[29] J.M. Lifschitz and A. Rotem. Time-dependent longitudinal strength of unidirectional fibrous composites. Fibre science and technology, 3 :1–20, 1970.
[30] D.C. Lagoudas, C.Y. Hui, and S.L. Phoenix. Time evolution of overstress profiles near broken fibers in a composite with a viscoelastic matrix. International journal of solids and structures, 25 :45–66, 1989. [31] I.J. Beyerlein, C.H. Zhou, and L.S. Schadler. Time evolution of stress redistribution around multiple fiber
breaks in a composite with viscous and viscoelastic matrices. International journal of solids and structures, 35 :3177–3211, 1998.
[32] S. Blassiau. Modélisation des phénomènes microstructuraux au sein d’un composite unidirectionnel car-bone/époxy et prédiction de durée de vie : contrôle et qualification de réservoirs bobinés. Thèse, Ecole des Mines de Paris, 2005.
[33] S. Blassiau, A. Thionnet, and A. Bunsell. Micromechanisms of load transfert in a unidirectional carbon-fibre epoxy composite due to carbon-fibre failures. part 1 : Micromechanisms and 3d analysis of load transfert, the elastic case. Composite Structures, 74 :303–318, 2006.
[34] S. Blassiau, A. Thionnet, and A. Bunsell. Micromechanisms of load transfert in a unidirectional carbon-fibre epoxy composite due to carbon-fibre failures. part 2 : Influence of viscoelastic and plastic matrices on the mechanism of load transfert. Composite Structures, 74 :319–331, 2006.
[35] S. Blassiau, A. Thionnet, and A. Bunsell. Micromechanisms of load transfert in a unidirectional carbon-fibre epoxy composite due to fibre failures. part 3 : multiscale reconstruction of composite behaviour. Composite Structures, 83 :312–323, 2008.
[36] M.H. Berger and D. Jeulin. Statistical analysis of the failure stresses of ceramic fibres : Dependence of the weibull parameters on the gauge length, diameter variation and fluctuation of defect density. Journal of Materials Sciences, 38 :2913–2923, 2003.
[37] A. Thionnet, A.R. Bunsell, S. Camara, and D.H. Allen. A simplified fe2 model of fibre failure and conse-quences applied to the design of composite pressure vessels. 17th international conference on composite materials, Edimburg, Scotland, page paper B2.1, 2009.
Fig.1 – Notched sample specimen, a) and b) dimensions of the sample, c) illustration of end tabs used to grip during load.
Fig.2 – Screw driven loading device.
Fig.4 – 3D reconstruction of notched sample.
Fig. 5 – In-situ loading of sample. Composite made partially transparent. Transverse ply cracks in green, 0° splits in red and delamination in blue.
0 2 4 6 8 10 12 0 10 20 30 40 50 60 70 80 90 100 D Sigma/Sigma0 Simulation Observation
Fig. 7 – Density of fibre breaks (D, nb/mm3
) versus the increasing load (Sigma/Sigma0, Sigma0 = UTS). Comparison between observation and simulation.
Numbers of cluster / Load (% of UTS) 0 28 64 70 80 85 88 94 1plet 0 1 6 10 15 58 98 151 2plet 3 3 6 6 9 13 3plet 1 3 7 4plet 1 3 5plet 6plet 2 7plet 8plet 1 9plet 10plet 11plet 12plet 1
(a) (b) (c)
Fig. 8 – Fibre break identification, a) view of cluster aligned with fibres, b) 3D view, part of composite made transparent to reveal cluster, c) view of cluster face onto fibres.