HAL Id: hal-00153811
https://hal.archives-ouvertes.fr/hal-00153811
Submitted on 10 Mar 2020HAL is a multi-disciplinary open access
archive for the deposit and dissemination of sci-entific research documents, whether they are pub-lished or not. The documents may come from
L’archive ouverte pluridisciplinaire HAL, est destinée au dépôt et à la diffusion de documents scientifiques de niveau recherche, publiés ou non, émanant des établissements d’enseignement et de
POROUS SILICON AMMONIA GAS SENSOR
Annick Chaillou, Joël Charrier, Nathalie Lorrain, Michel Sarret, Lazhar Haji
To cite this version:
Annick Chaillou, Joël Charrier, Nathalie Lorrain, Michel Sarret, Lazhar Haji. POROUS SILI-CON AMMONIA GAS SENSOR. SPIE Photonics Europe 2006, Mar 2006, Strasbourg, France. �10.1117/12.663636�. �hal-00153811�
POROUS SILICON AMMONIA GAS SENSOR
A. Chaillou
a, J. Charrier
a, N. Lorrain
a, M. Sarret
b, L. Haji
aa
Laboratoire d’Optronique, UMR 6082, BP 80618, 6 rue de Kerampont, 22 305 LANNION
(France)
b
Institut d’Electronique et de Télécommunications de Rennes, UMR 6164, 263 av du Général
Leclerc, CS 74205, 35042 RENNES (France)
ABSTRACT
A planar optical waveguide is manufactured by the functionnalisation of oxidised mesoporous silicon with Bromothymol Blue to achieve a sensitive ammonia sensor suitable for low gas concentrations. The propagated light intensity is measured at the output of the waveguide. The sensitivity at low concentrations and the short time of reaction of the sensor are enhanced by a confinement effect of the gas molecules inside the pores. The dependence of the output signal with gas concentration is demonstrated. When the ammonia flow is stopped, the reversibility of the initial characteristics of the propagated light is naturally obtained with the disappearance of the gas molecules.
Keywords : Ammonia, Gas sensor, Waveguide, Porous silicon, Bromothymol blue, Indicator dye
1. INTRODUCTION
Various optical sensors have been proposed for ammonia detection [1]. They have several specific assets compared to conventional sensors [2 - 5]. The major advantages are their small size, absence of electrical interference, remote sensing, low cost … [6].
The main principle of these sensors is based on the change of color of the detecting molecule immobilized in the optical structure in the presence of gas. Several devices have been proposed either using an active film coated on substrates [7, 8], or on fibers [9, 10]. For these coated structures, the detection can be generally done by the variation in the electric field of the evanescent wave when ammonia is present [11, 12].
One other means is to use an optical waveguide based on oxidised porous silicon whose pores are impregnated by the active molecule [13]. Due to the open pore structure, gas can diffuse and react with active molecules in the whole volume and not only at the surface, like for film structures. In these porous optical structures, the propagated signal intensity at the output is modified by the absorption of the molecule.
This paper reports the development of a porous silicon waveguide sensor impregnated with Bromothymol blue (BTB) molecules to detect ammonia. As shown in a previous study, indicator dye covers the pores over all the thickness of the waveguide and a homogeneous structure can be achieved [13]. The advantage of such a porous structure is its very high specific area. A good sensitivity can be expected because gas molecules are confined within the pores and can react with this highly active specific area impregnated with BTB molecules.
BTB is a weak acid pH indicator whose color changes in the range of 6 – 7.6 pH from yellow to blue due to the deprotonation of the HB acidic form to the B- basic form when ammonia is present:
800808 15KV X50.8I( 600n.
HB (yellow) + NH3 NH4+ + B- (blue) (1)
The optical absorption of BTB depends on the amount of the ratio between HB and B-. With an aqueous acidic solution, the acidic form (HB) is preponderant, no absorption is obtained for wavelengths higher than 500nm. In a solution with ammonia, the pH value increases, a maximum of absorption is obtained around 620 nm due to the predominance of the basic form B-. This behaviour indicates that BTB is suitable to perform a NH3 chemosensing waveguide. In this way, a He-Ne laser which the work wavelength is λ = 633 nm is used to detect the presence of NH3 gas molecules.
The optical properties of the functionnalized layers are characterised by means of reflectance UV-Vis spectroscopy and by the m-lines method. The sensor characterisation is performed by an in-situ optical transmission measurement in presence of different NH3 gas concentrations.
2. EXPERIMENTAL
Mesoporous silicon is obtained by anodisation of highly doped p-type (100) oriented c-Si substrates in a HF(50%): H2O: ethanol (2: 1: 2) electrolyte. Porous silicon planar waveguides are made using two consecutively current densities (50 and 80 mA/cm2). Two layers (5 µm thickness) with different porosities (i.e. different refractive index) are obtained [14].
The observation of the porous structure of the waveguide is achieved by means of a S-2500 Hitachi SEM. The network of the porous structure which will be functionnalised later is well observed in the Fig.1. The open structure is well visible on the micrography of the surface. On the cross-section, the columnar pore structure perpendicular to the surface is well observed. Due to the difference of porosity, the two porous layers can be well identified in the cross-section micrography. Pores with a mean diameter of 20 nm have been formed in the guiding layer, while in the cladding layer, the mean diameter is about 25 nm. The porous silicon waveguides were then oxidised at 900°C for 1h under O2 flow after a pre-treatment at 300°C for 1h. This thermal oxidation allows a stable waveguide to be obtained with a lower absorption coefficient than for a non-oxidised one, principally in the visible wavelengths [15]. After oxidation, due to the thermal silica expansion, a decrease of the mean diameter is observed.
Silicon substrate Cladding layer Guiding layer
The Functionnalized Waveguide (FWG) is obtained by impregnating the oxidised porous silicon waveguide with a solution of (0.05g/l) Bromothymol Blue (BTB) in deionized water. The pore filling is improved because oxidised porous silicon is more hydrophilic than porous silicon.
UV-Vis reflectivity spectra of functionalized layers have been recorded using a spectrophotometer equiped with a specular reflectance module.
The refractive index for each oxidised singlelayer before and after introduction of BTB has been measured by m-lines at λ = 633 nm as a function of BTB concentrations. Five tests have been performed at different sample surface, the mean value and the standard deviation are presented below.
A schematic view of the experimental set-up for the in-situ measurements is shown in Fig.2. The propagated light intensity at the output of the sensor is measured by a silicon photodiode under controlled gas flow. Diluted NH3 gas in dried N2 has been used to work in the 1000 to 1 ppm NH3 range. Each gas flow is regulated by a flow meter controller, the gases are mixed before injection in the chamber. The NH3/ N2 reactive gas is introduced in the closed chamber above the FWG at atmospheric pressure and ambient temperature with a 73% RH.
Light from a 633nm He-Ne laser beam is injected by an optical fiber into the FWG and the propagated light intensity is measured at the output of the sample by a silicon photodetector.
The test procedure has been perfected :
- a vacuum up to 50mbar is carried out for ten minutes to evacuate contaminated molecules of gas. The chamber is then returned to atmospheric pressure by introduction of ambient air.
- NH3/N2 gas is continuously introduced to the testing chamber at a constant flux of 200 sccm, instead of a pulsed flux, to obtain a good signal to noise ratio [16].
- then a new test is performed with a different NH3/N2 concentration. The same FWG sample has been used for all the cycles presented in this paper.
Mass controller Gas outlet He-Ne Laser @ 633 Primary gauge FWG Rotary pump Multimeter IEEE-BUS Si Photodiode NH3 / N2 N2
3. EXPERIMENTAL RESULTS
3.1 UV-Vis reflectance spectra and refractive index of the functionnalized layers
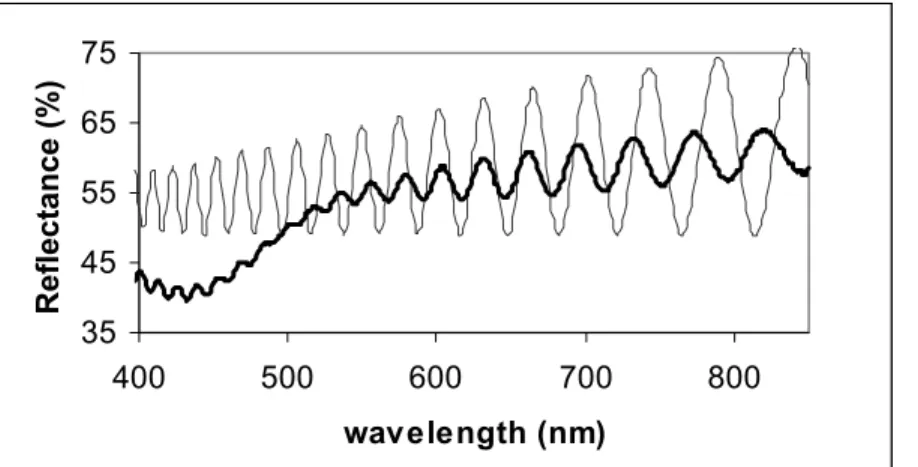
The reflectivity spectra of oxidised porous silicon single layers before and after functionnalisation with BTB are presented on Fig.3. Samples with the same porosities as those used for the guiding and the cladding layers of the waveguide have been studied.
Before functionnalisation, the reflectivity is relatively higher for the single layer with the lowest porosity (the highest refractive index). However, for functionnalized ones, an important decrease in the reflectivity is observed below 550 nm.
The comparison with the BTB properties described in Eq. 1 and the reflectance spectrum of layer impregnated by BTB shows that the absorption properties of the BTB dye are retained when it is dried and confined in the pores. Only, a very low absorption of BTB can be expected at 633 nm for the FWG in an inert atmosphere.
The real part of the refractive indexes measured by m-lines are presented in Fig.4 for the two single layers as a function of BTB concentrations. The refractive index of the guiding layer is higher than that of the cladding one before impregnation. For the impregnated layers, the refractive index does not vary in a significant way for the two tested concentrations of BTB. The introduction of BTB, in its protonated form HB, does not affect the refractive index of the oxidised porous silicon, due to the very small amount of dye introduced into the pores.
35 45 55 65 75 400 500 600 700 800 wavelength (nm) Reflectance (%)
Figure 3 : Reflectivity of the oxidised porous silicon: before (thin line) and after functionnalisation with 0.5 g/l of BTB (thick line)
1,2 1,22 1,24 1,26 1,28 1,3 1,32 0 0,2 0,4 0,6 BTB concentration(g/l) Refractive Index 50mA/cm2 80mA/cm2
The m-line results have shown that the refractive indexes of the functionnalized layers are very close to those of the non-impregnated layers. Gas detection can be only expected by the increase of the dye absorption at 633 nm (Fig.2) which affects the complex refractive index.
3.2 Sensor characterisation
The optical intensity at the exit of the FWG is measured by a silicon photodiode (Si-PD). The output voltage (V) is recorded as a function of time when the FWG is exposed to ammonia gas. Without ammonia, the recorded signal (Vmax) is maximum because the dye is in its protonated form and it does not absorb at 633 nm as shown in Fig.2.
The variation of the normalized (V/Vmax) signal ratios as a function of the time for decreasing NH3 concentrations is shown in Fig.5. As soon as the gas is introduced, the transmitted light from the FWG decreases leading to a reduction in the output voltage. The diffusion of the gas into the pores is instantaneous because of the open structure of the porous material. The small diameter of the pores does not hamper the diffusion of the gas inside the pores. The optical properties of the BTB molecules are retained when they are confined in the waveguide. When the sensor is exposed to the gas, the chemical reaction Eq. 1 moves toward the right part, the concentration of the basic form B- increases, the dye absorbs at 633 nm, the signal (V) quickly decreases.
Between two tests, a rough vacuum evacuates NH3 molecules from the pores, this period has been symbolized by thin broken lines on the spectrum (Fig.5). For the highest concentration (1000 ppm of NH3), the light has been completely absorbed in 27 seconds. As observed from Fig.5, the decrease in the ratio V/Vmax is a function of the NH3 concentration of the gas. The higher the NH3 concentration, the lower the propagated light intensity becomes. The chemical reaction between NH3 and BTB molecules can occur even at low concentrations because entrapped gas particles inside the pores react directly with BTB molecules fixed along the pores: 1 ppm ammonia was detected by the sensor with a 15% variation in the initial signal value. Two different behaviors can be observed on the curves: after a fast decrease, the transmission through the FWG leads to a constant value Vmin (final state). Vmin decreases when NH3 concentration increases. The ratio between [HB] and [B-] concentrations is a function of NH3 concentration in the injected gas.
First, the forward reaction Eq.1 is dominating, the indicator is easily dissociated. Then, the reaction tends to the equilibrium between the protonated and the deprotonated form of the indicator because the reaction is incomplete as expected in the case of a weak acid. Hu and al. [16] have proposed a mathematical model based on the mechanism of NH3 molecule adsorption on film sites, to explain that the signal reaches a constant value which depends on the gas concentration. 0 20 40 60 80 100 0 200 400 600 800 1000 Time (s) V / Vmax (%) 1000 500 250 100 10 5 2.5 1 ppm ppm ppm ppm ppm ppm ppm ppm Vmin 100 s
Figure 5 : V/Vmax output ratios as a function of time for different NH3 concentrations. The thin broken lines correspond to the vacuum period
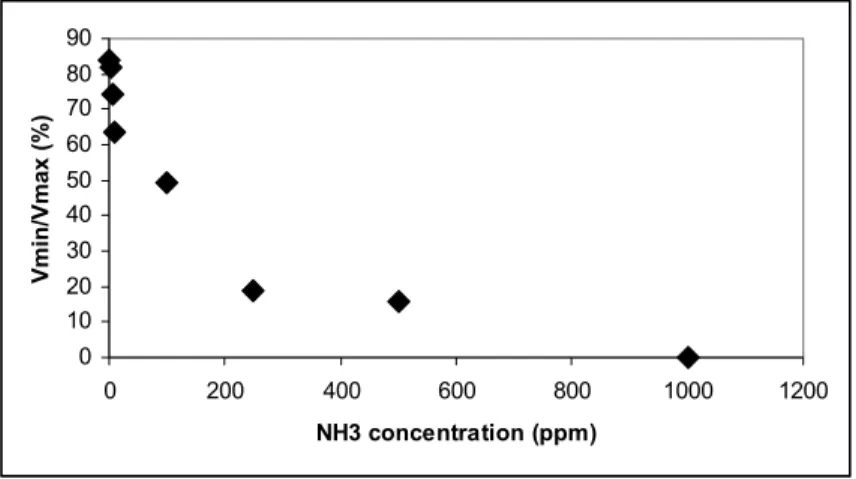
Fig.6 shows the normalized (V/Vmax) signal ratios measured at the final state Vmin as a function of the concentration of ammonia. A dependence of the final value with the concentration of NH3 is well observed for the all gas tested concentrations in this work. This result allows us to assume that Vmin is a suitable magnitude to determine gas concentration. We have shown that the FWG is not only able to detect but can also measure NH3 molecule concentration. A mathematical model to calibrate the sensor response in function of the NH3 concentration in the gas will be exposed in a previous work.
Natural reversibility tests in ambient atmosphere have also been performed with 10 and 1 ppm NH3 concentration. The results are presented in Fig.7. As soon as the gas flow was stopped, the output signal increased, because of the dilution of the NH3 molecules in air. NH3 concentration naturally decreases. The NH4+ decomposes in ammonia plus one proton and restores the acidic form (HB) of the dye. This reversibility is not instantaneous, a slow and progressive recovery of the initial state is obtained. The reverse reaction rate constant of Eq.1 is low because only a natural ejection of the gas molecules outside of the pores has been carried on. For the two concentrations, about five minutes was necessary to restore the sensor properties. Two tests at 6 months’ interval have been performed on the same FWG. The same behavior in presence of NH3 has been observed. No bleaching of the dye occurred, showing a high stability of the material with time.
0 10 20 30 40 50 60 70 80 90 0 200 400 600 800 1000 1200 NH3 concentration (ppm) Vmin/Vmax (%)
Figure 6 : Vmin/Vmax output ratios as a function of NH3 concentration
Figure 7 : V/Vmax output ratios as a function of the time for 1 and 10 ppm NH3 gas concentrations – reversibility of the initial propagated light intensity at the output of the FWG after the stop of the injection of the gas
0 2 4 6 8 10 0 20 40 60 80 100 Time (mn) V/Vmax ( % ) Gas inlet Gas stop 1 ppm 10 ppm
4 CONCLUSION
We have studied a NH3 sensor based on a functionnalized optical waveguide. A weak acid dye pH indicator has been selected to be introduced homogeneously inside the pores of the oxidised porous silicon waveguide. Contrary to polymer films, no problem of immobilization of these molecules into the pores has been encountered. With UV-Vis spectroscopy and m-lines method, we have shown that the optical properties of the as-done waveguide are retained under ambient air when dye is introduced. Gas is detected by the important absorption at 633 nm of the deprotonated BTB form. The intensity of the transmitted light through the FWG decreases. A very good correlation has been found between the transmitted signal at the final state and the injected ammonia concentration.
A fast response time of the sensor has been obtained for all the tested NH3 concentrations. Due to the reverse chemical reaction of the dye, a natural reversibility is obtained when NH3 molecules disappear. With the proposed configuration, the detection limit was less than 1 ppm, with a rather good sensitivity. The response times (detection and reversibility) obtained in this work are very encouraging to use this kind of technique to realize such a gas sensor.
An optimization of the introduced dye concentration will allow the detection limit to be decreased. On the other hand, by using ridge waveguides, the sensor characteristics can be expected to be improved. This technology could also be used to detect other gases, using another suitable sensitive molecule.
REFERENCES
1. B. Timmer, W. Olthuis, A. Vanden Berg, “Ammonia sensors and their applications” – a review, Sensors and Actuators B 107, 2005, pp. 666-677.
2. S.E. Lewis, J.E. DeBoer, J. L. Gole, P. J. Hesketh, “Sensitive, selective, and analytical improvements to a porous silicon gas sensor”, Sensors and Actuators B 110, 2005, pp. 54-65.
3. M. Bendahan, P. Lauque, J-L. Seguin, K. Aguir, P Knauth, “Development of an amonia gas sensor”, Sensors and Actuators B 95, 2003, pp. 170-176.
4. G.K. Prasad, T.P. Radha krishnan, D. Sravan Kumar, M. Ghanashyam Krishna, “Ammonia sensing characteristics of thin film based on polyelectrolyte templated polyaniline”, Sensors and Actuators B 106, , 2005, pp. 626-631.
5. K. Zakrzewka, Mixed oxides as gas sensors, Thin solid films, 391, 2001, pp. 229-238.
6. H. Segawa, E. Uhnishi, Y. Arai, K. Yoshida, “Sensitivity of fiber-optic carbon dioxide sensors utilizing indicator dye”, Sensors and Actuators B94, 2003, pp. 276-281.
7. C.R. Lavers,K. Itoh, S.C. Wu, M. Murabayashi, I. Mauchline, G. Stewart, T. Stout, “Planar optical waveguides for sensing applications”, Sensors and Actuators B 69, 2000, pp. 85-95.
8. Yimit, K. Itoh, M. Murabayashi, “Detection of amonia in the ppt range based on a composite optical waveguide pH sensor”, Sensors and Actuators B 88, 2003, pp. 239-245.
9. C. Malins, M. Landl, P. Simon, B.D. MacCraith, “Fiber optic amonia sensing employing novel infrared dyes”, Sensors and Actuators B51, 1998, pp. 359-367.
10. N.K. Sharma, B.D. Gupta, “Fabrication and characterization of pH sensor based on side polished single mode optical fiber”, Optics Communications, vol 216, Issues 4-6, Feb 2003, pp. 299-303.
11. W. Cao, Y. Duan, “Optical fiber-based evanescent ammonia sensor”, Sensors and Actuators B 110, 2005, pp 252-259.
12. Yimit, A. G. Rossberg, T. Amemiya, K. Itoh, “Thin film composite optical waveguides for sensor applications : a review”, Talanta, 65, 2005, pp. 1102-1009.
13. P. Rivolo, P. Pirasteh, A. Chaillou, P. Joubert, M. Kloul, J-F Bardeau, F. Geobaldo, “Oxidised porous silicon impregnated with Congo Red for chemical sensoring applications”, Sensors and Actuators B 100, 2004, pp. 99-102. 14. J. Charrier, E. Le Gorju , L. Haji, M. Guendouz, “Low loss optical wavesguides fabricated from oxidised porous silicon”, Journal of Porous Materials, 2000 , 7, pp. 243-246
15. R. Guerrero-Lemus, F. Ben-Hander, C. Hernandez-Rdriguez, J.M. Martinez-Duart, “Optical and compositional characterisation of stain-etched porous silicon subjected to anodic oxidation and thermal treatments”, Materials Science and Engineering, B101, 2003, pp. 249-254
16. H. Hu, M. Trejo, M.E. Nicho, J.M. Saniger, A. Garcia-Valenzuela, “Adsorption kinetics of optochemical NH3 gas sensing with semiconductor polyaniline films”, Sensors and Actuators B 82, 2002, pp. 14-23.