HAL Id: hal-02960249
https://hal-mines-albi.archives-ouvertes.fr/hal-02960249
Submitted on 4 Dec 2020
HAL is a multi-disciplinary open access
archive for the deposit and dissemination of
sci-entific research documents, whether they are
pub-lished or not. The documents may come from
teaching and research institutions in France or
abroad, or from public or private research centers.
L’archive ouverte pluridisciplinaire HAL, est
destinée au dépôt et à la diffusion de documents
scientifiques de niveau recherche, publiés ou non,
émanant des établissements d’enseignement et de
recherche français ou étrangers, des laboratoires
publics ou privés.
A comparative study of the crystallinity of
Polyetheretherketone by using density, DSC, XRD, and
Raman spectroscopy techniques
M. Doumeng, L. Makhlouf, Florentin Berthet, O. Marsan, K. Delbé, Jean
Denape, F. Chabert
To cite this version:
M. Doumeng, L. Makhlouf, Florentin Berthet, O. Marsan, K. Delbé, et al.. A comparative study of
the crystallinity of Polyetheretherketone by using density, DSC, XRD, and Raman spectroscopy
tech-niques. Polymer Testing, Elsevier, 2021, 93, pp.1-10/106878. �10.1016/j.polymertesting.2020.106878�.
�hal-02960249�
Polymer Testing 93 (2021) 106878
Available online 2 October 2020
0142-9418/© 2020 Elsevier Ltd. This is an open access article under the CC BY-NC-ND license (http://creativecommons.org/licenses/by-nc-nd/4.0/).
A comparative study of the crystallinity of polyetheretherketone by using
density, DSC, XRD, and Raman spectroscopy techniques
M. Doumeng
a, L. Makhlouf
a, F. Berthet
c, O. Marsan
b, K. Delb´e
a,*, J. Denape
a, F. Chabert
a aLaboratoire G´enie de Production (LGP), Universit´e de Toulouse, INP-ENIT, Tarbes, FrancebCIRIMAT, Universit´e de Toulouse, INP-ENSIACET, Toulouse, France
cInstitut Cl´ement Ader (ICA), Universit´e de Toulouse, ´Ecole des Mines, Albi, France
A R T I C L E I N F O Keywords: PEEK Degree of crystallinity Density DSC XRD Raman spectroscopy A B S T R A C T
A comparative study of the crystallinity of Polyetheretherketone by using density, DSC, XRD, and Raman spectroscopy techniques.
In this work, the microstructure of Polyetheretherketone is first analyzed with usual techniques such as density, Differential Scanning Calorimetry, X-ray Diffraction, and secondly, compared with Raman Spectroscopy. Assessing the degree of crystallinity of PEEK is challenging because of the different interpretation of the crys-tallinity according to each technique. The density measurement gives the highest most trusted absolute uncer-tainty for the degree of crystallinity, around 4%, compared to the other techniques. The Differential Scanning Calorimetry, usually used by the polymer community, overestimates up to 18% the degree of crystallinity due to a competitive phenomenon between crystallization and melting of PEEK over the same temperature range, and a fast crystallization. When Analyzing the X-ray Diffraction data, the degree of crystallinity is underestimated up to 11% as a consequence of the broad amorphous halo. Lastly, our investigation proves that Raman micro-spectroscopy is appropriate to determine the local crystallinity on the sample surface and compares 18 indicators in the same study. The 1651 cm−1 band shift has the highest correlation coefficient of 0.92 with the degree of
crystallinity determined by density. This work attempts to correlate the results of degree of crystallinity of PEEK obtained by these four techniques in order to establish the best evaluation of this fundamental property for numerous applications.
1. Introduction
Polyetheretherketone (PEEK) is a high-performance thermoplastic widely used as a matrix in the growing thermoplastic composite in-dustry. Launched in the ‘80s by Imperial Chemical Industries, PEEK is still a promising material because of its inert response to chemical re-agents and heat resistance, highly elastic modulus and durability in thermo-oxidative conditions. PEEK is synthesized from biphenyl (hy-droquinone) and fluorinated aromatic compound in a polar aprotic solvent (diphenyl sulfone). The fluorinated derivatives are privileged for this synthesis for their better reactivity and higher electronegativity than chlorinated derivatives [1]. The chemical reaction is a nucleophilic substitution obtained by polycondensation between 200 ◦C and 400 ◦C.
The resulting compound, PEEK, is a copolymer composed of ether and ketone groups, as seen in Fig. 1. The ether/ketone ratio units remain equal to two, even if the order of appearance of monomers in the
macromolecular chain differs [1]. The molecular weight varies between 3500 and 50 000 g.−1 [2]. Short molecular chains have higher molecular
mobility which favors the crystallization [3].
Dawson and Blundell [4] were the first ones to describe an ortho-rhombic crystalline unit cell of PEEK from X-ray data. The a- and b-axis in the radial direction and the c-axis in the lamellae thickness direction are determined with the position of stronger peaks corresponding to plan (110), (111), (200) and (211). The cell parameter c-axis coincides to 2/3 of the elementary pattern, as indicated by the crystal structure unit cell which is presented by Kumar et al. [5] and Jin et al. [6]. Two estimations are proposed for this value. Dawson et al. [4] and Hay et al. [7] described it by 2/3 repeat unit of about 1 nm. Ji et al. [8] and Wakelyn et al. [9] reported a c-axis with two repeat units, with the sum of two repeat units amounting to around 3 nm. The crystallographic plane (110) appears to be a preferential growth plan. Dawson and Blundell [4] and Hay et al. [7,10] measured the unit cell dimensions of a
* Corresponding author.
E-mail address: karl.delbe@enit.fr (K. Delb´e).
Contents lists available at ScienceDirect
Polymer Testing
journal homepage: http://www.elsevier.com/locate/polytest
https://doi.org/10.1016/j.polymertesting.2020.106878
disoriented polymer, while Rueda et al. [11] used drawn material. All three denote different values for the unit cell dimensions, which are mentioned in Table 1.
Later, Hay et al. [10] noticed the same dimensions for oriented and disoriented PEEK specimens. The molecular orientation does not affect
the cell parameters. The cell volume is 0.463 ± 0.1nm3. Based on four
equivalent monomer units per unit cell, the crystalline density is calculated at 1.378 ± 0.005 g.−3 and the amorphous density for
quenched PEEK is measured as 1.262 ± 0.001g.−3. The density increases
linearly with the crystalline rate between these two values.
Wakelyn et al. [9] observed that the unit cell dimensions of PEEK decrease systematically with increasing crystallization temperature from amorphous specimens for annealing time of 1 h. When increasing the annealing temperature, there is a progressive change of diffracto-gram toward higher and narrower peaks. A closer look reveals a pro-gressive change of the angular position of the major diffraction reflections toward higher angles, and an increase in crystalline perfec-tion in the sense of a more tightly packed assembling of macromolecular chains. The a-, b-, c-axis for each temperature specimen were calculated using the orthorhombic relation and the appropriate (110), (113), and (213) data. The a-axis remains constant from 189 ◦C to 241 ◦C then
regularly decreases with increasing annealing temperature. There is a general decrease in the b-axis with increasing temperature. The c-axis is not affected. The unit cell parameters were used to calculate the crys-tallographic density values that rises with increasing annealing tem-perature. It appears to agree with a more densely packed assembling of macromolecular chains.
Hay et al. [7] explained that PEK does not exhibit any dependence between unit cell volume and temperature. A change in crystallite size is not correlated with crystallization temperature. These variations are related to higher disorder in the lateral packing of the molecular chains, specifically the increased torsional angle of the phenylene groups along Fig. 1. Chemical formula of PEEK.
Table 1
Extremum of unit cell dimensions of PEEK.
References Unit cell dimensions (nm)
a b c Dawson et al. [4] 0.763–0.775 0.585–0.596 1.000 Rueda et al. [11] 0.775 0.589 0.988 Hay et al. [10] 0.778 0.592 1.006 Shimizu et al. [12] 0.780 0.592 1.000 Fratini et al. [13] 0.783 0.594 0.986 Kumar et al. [5] 0.779–0.783 0.591–0.592 1.000–1.007 Wakelyn et al. [9] 0.773–0.784 0.584–0.593 2.985–3.037 Hay et al. [7] 0.771–0.786 0.587–0.592 0.990–0.998 Pisani et al. [14] 0.743 0.592 3.009
Fig. 2. Unit cell of PEEK reported by a) Fratini [13] and b) Jin [6].
Polymer Testing 93 (2021) 106878
3 the c-axis. Steric effects of the adjacent ortho-hydrogen atoms increase the carbonyl and ether chain angles and widen the c-axis dimension.
Recently, Pisani et al. [14] modeled the optimized structure of PEEK with density functional theory, the density reported being 1.450 g.−3. To
deepen the structure of the PEEK, two organizations of the unit cell are found in the literature. Fratini et al. [13] define the unit cell with a subcell of a two-ring unit repeated three times inside the unit cell, as seen in Fig. 2-a. The crystal density of a subcell is 1.392 g.−3. Jin et al. [6]
define the unit cell with a three-ring repeat unit, as seen in Fig. 2-b. The organization of the lamella is different according to the cooling condi-tions. The lamellar stacks and individual lamellae of 10 nm when the sample crystallized isothermally at 315 ◦C and only lamellar stacks
when the sample is cooled down to ambient temperature.
Unit cell parameters depend on the annealing temperature. Crystal-lization kinetic is deduced from the unit cell parameters. Bas [15] established Time-Temperature-Transformation (TTT) diagrams repre-senting the relative amount of crystallized material according to the crystallization temperature and the time at this temperature (see Fig. 3). Bas defines the relative crystallinity as the relative amount of crystal-lized material over the final value at the end of the test. The TTT diagram highlights that a sample cooled at 320 ◦C from the melted state, reached
5%, 50%, 95% of relative crystallinity for test time of 10, 14, 18 min. Kemmish et al. [16] evaluate the crystallization kinetic of PEEK with the Avrami model. During its crystallization, two competitive mecha-nisms occur, with two constants of Avrami [17]. For example, the experimental exponent value of 2.5 corresponds to spherulitic, diffusion-controlled growth, with thermal nucleation, and the exponent value of 1.5 corresponds to rod-shaped, diffusion-controlled growth, with thermal nucleation. Rod-shaped crystals emerge from fiber surface, and spherulitic crystals emerge in the bulk. The crystallized volume fraction depends on the rate of temperature descent and remains rela-tively high (> 20%) as long as the rate of temperature descent does not exceed 10 K⋅s−1.
Wang et al. [18] also highlight the influence of melting temperature and pre-crystallization conditions on the crystallization behaviour of PEEK.
The properties of PEEK are unanimously recognized to rival those of metals and could replace them in some applications. However its pro-cessing and assembling are still serious challenges that need to be overcome, before a widespread utilization in the industry. For a better understanding of PEEK properties and PEEK based composites, a deep knowledge of its crystalline structure is crucial. Mechanical properties are directly related to the degree of crystallinity and crystalline morphology. Kemmish et al. [16] observed a progressive increase in yield stress under tensile tests at room temperature from 59 MPa for quenched PEEK to 75 MPa for 32% crystalline PEEK. Similarly, as shown by Cebe et al. [19], the elastic modulus is measured at 1.5 GPa and 2.0 GPa for the 22% and the 32% degree of crystalline respectively, also at ambient temperature. The crystalline phase is considered as a rein-forcement in the amorphous phase. Pisani [14] modeled molecular dy-namics: the elastic modulus of PEEK increases from 3.62 GPa to 4.50 GPa for degrees of crystallinity of 0% and 70% respectively.
Measuring the degree of crystallinity χc is a challenging task for in-dustrial quality control. It also gives information about material prop-erties it is also related to material intrinsic propprop-erties. The main techniques are Differential Scanning Calorimetry (DSC), Small Angle X- ray Scattering (SAXS) and density measurement. However, the degree of crystallinity differs according to the technique as each has its limitations.
Mehmet et al. [20] measured the density of PEEK samples and calculated the weight fraction of the degree of crystallinity, using a value for the amorphous density of 1.261 g.−3. Mehmet compared it with the
weight fraction calculated by Wide Angle X-ray Scattering (WAXS) and the melting enthalpy obtained by DSC. Wide differences were observed between similar samples, and with the values obtained by other
methods. When Mehmet examined the crystalline PEEK samples by the light microscope, he observed that polishing reveals extensive amounts of voids within the specimens. Since the PEEK had been extensively dried, the voids were attributed to trapped air or inserted solvent residue.
More recently, Wang et al. [21] performed measurements on injection-moulded PEEK and PEEK reinforced with fullerene nano-particles and graphene nanonano-particles. From their Wide angle X-ray diffraction (WAXD) measurements, they concluded that the process and the nanoparticles do not affect the crystal structure and crystallinity of PEEK.
Thermal analysis with DSC is also used to calculate the degree of crystallinity of PEEK and its composites, but account must be taken for melting and recrystallization that simultaneously occur when heating. Mehmet-Alkan and Hay advice direct measurement of the overall enthalpy change must be performed [22]. Bas et al. [15] note that the double peak observed on the PEEK is linked to two different crystalline structures. Between 175 ◦C and 290 ◦C, the crystallization is fast - it
takes place in a few seconds -, which explains that recrystallization oc-curs when heating during the DSC scan. As a result, the melting enthalpy is a sum of simultaneous melting-recrystallization effects.
Raman spectroscopy is used to investigate the crystallinity of semi- crystalline polymers since 80s. The position and indexation of each peak are reported in Table 2. Only the most intense peaks are identified. All the peaks were identified by Ellis [23].
Conventional dispersive Raman spectroscopy establishes spectra with high fluorescence [24] and a low signal-to-noise that avoid high-precision calculation of the intensity ratio. Agbenyega et al. [25] used Fourier transform Raman spectroscopy to circumvent this negative effect. Briscoe et al. [26] thoroughly analyzed PEEK spectra and iden-tified the strongest peaks at 808, 1146, 1201, 1595, 1606, 1644 and 3068cm−1. Agbenyega et al. [25] and Stuart et al. [27] determined that
the band at 1644 cm−1 is divided into two bands at 1644 cm−1 and 1651
cm−1 which are assigned to the ν
C=O modes for the crystalline part and to the amorphous part respectively. These authors proposed to calculate the degree of crystallinity by using the ratio intensity of these bands normalized with the band at 1595cm−1. Because they assumed this band
is less sensitive to the environment and the crystallinity [26]. The ratio of relative intensities between bands 1595 cm−1 over 1607 cm−1 [23,25,
26] and 1146 cm−1 over 1595 cm−1 [24,26,27] are used to calculate the
degree of crystallinity without destroying the sample.
The degree of crystallinity and crystalline structure depend on pro-cessing conditions similarly to any semi-crystalline polymer. However, for PEEK, the processing temperature has a huge impact on the struc-ture. Numerous authors highlight crystallinity differences depending on whether PEEK is crystallized from the glassy state or from the molten state [15,28–31].
From glassy state, for the different annealing conditions, the increase in crystallinity leads to a decrease in the width at half height in XRD. An Table 2
Raman’s assignment of band for PEEK [23]. γ: out-of-plane bending; δ: bending or scissoring; ν: stretching. Wavenumber Assignment 808 cm−1 γ C− H 882 cm−1 Ring mode 1146 cm−1 δ
C− CO− C or Ring stretching mode or νC− CO− C
1201 cm−1 ν
φ−O
1499 cm−1 Ring stretching mode
1575 cm−1 νC=C 1595 cm−1 νC=C 1607 cm−1 ν C=C 1644 cm−1 ν C=O crystalline 1651 cm−1 ν C=O amorphous M. Doumeng et al.
improvement of the primary lamellae would, therefore, be running during the isothermal treatment [32]. Using small-angle XRD analysis, Fougnies et al. [2] quantify the thickness of the crystalline lamellae of PEEK and follow its evolution during an anisothermal cold crystalliza-tion. Their results also seem to show a refinement of the crystal morphology with time after the growth of the main crystalline network. From the melted state, this morphology appears to be different than the one established on a sample crystallized from the melted state then annealed. By thermal analysis, Ko and Woo [33] showed that annealing from the melted state results in one melting peak for each annealing condition on the thermogram. According to them, each peak corre-sponds to a population of lamellae with their thickness. Being confident in the study of Tardif et al. [34], the minor peak, closest to the main peak, is the consequence of a reorganization.
The paper presented hereby aims to compare the degree of crystal-linity of a commercial PEEK using four techniques: density, DSC, XRD and Raman spectroscopy. It is the first time these techniques are compared on the same PEEK samples. Our work highlights the benefits and drawbacks of the techniques and the specificity of the measurement of PEEK crystallinity. Besides, with Raman spectroscopy, we wanted to propose new criteria characteristic of crystallinity. This analysis has the advantage of being local, whereas the other methods are global. By comparing mode shifts or intensity ratios with the crystallinity obtained by density, we underline the strong correlation of these news parameters with the crystallinity of PEEK.
2. Materials and methods
2.1. Materials
The film of PEEK Aptiv 2000 used in this study was manufactured by Victrex, 250 μm thick. Two experiments were performed: from the glassy state and from the melted state. Based on Martineau’s work [35], films are annealed at 156 ◦C, above the glassy transition temperature,
during 5, 10, 15, 20, 28, 36, 44 and 56 min in the oven of a rheometer to ensure the temperature with the accuracy of 0.1 K. Then, samples are quenched with nitrogen for 1 min and stored at ambient temperature. Crystallization kinetic is thermo-dependent. Tardif and Boyard have shown that no crystallization occurs with a cooling rate of 2000 K/s from the melted state [34]. PEEK is heated at 380 ◦C, then cooled for 5 min at
different temperatures 320, 300, 280, 260 ◦C, about the temperature of
crystallization of PEEK at 300 ◦C. The crystallization is stopped by
cooling it rapidly in nitrogen. 2.2. Density
The density is calculated by an immersion method according to the standard ISO 1183–1:2019. Before weighting, samples are dipped in a mix of water and wetting agent to prevent air bubbles formation on the
sample surfaces. Each sample is weighted three times for reproducibility.
2.3. Differential Scanning Calorimetry
Differential scanning calorimetry - TA Instruments DSC, Q200 - is performed for each sample to estimate the glass transition Tg, melting
Tm, cold crystallization Tcc, hot crystallization Thc temperatures and the degree of crystallinity χc. Samples weighing approximately 10 mg are encapsulated in hermetic aluminum pans, heated with a temperature ramp of 10 K⋅min−1 from 80 ◦C to 380 ◦C, then cooled from 380 ◦C to
80 ◦C and finally heated from 80 ◦C to 380 ◦C under nitrogen flow of 50
mL⋅min−1. Between each step, the temperature is maintained for 1 min.
Each analysis is performed twice. 2.4. X-ray diffraction
X-ray diffraction - Philips, X’Pert Panalytical - is performed to calculate the degree of crystallinity χc of PEEK films. The diffraction angular 2θ is ranged from 5◦ to 40◦ with an increment of 0.01◦. The
diffractometer system uses Cu tube as an X-ray source with an intensity of 40 mA and a tension of 45 kV. The calculation of the degree of crystallinity is obtained by a deconvolution in Gaussian curves, and is performed with 9 curves for the crystalline part and 5 curves for the amorphous part. The degree of crystallinity is the ratio of the sum of the deconvoluted crystalline part over the sum of the crystalline and the amorphous deconvoluted parts. A supplementary data presents the deconvoluted curves for all samples.
2.5. Raman spectroscopy
Raman microspectroscopy provides chemical and structural charac-terizations of the samples. The spectrometer is a Horiba LabRAM HR 800 with a continue He/Ne source laser that emits at 633 nm The analyses are performed with a magnification of 100 with a numerical aperture of 0.9. Consequently, the spot diameter, the axial resolution and the spectral resolution are 858 nm, 2.8 μm and 3 cm−1 respectively. No
surface degradation or debris is detected under these conditions. A confocal hole of 30–35 μm and a holographic network of 600 lines ⋅ /mm are used for spectrum profiles. Mappings of 60 μm × 60 μm are obtained for samples annealed from glassy state. More than 400 spectra were recorded to study statistically the evolution of the PEEK main vibration modes. For samples cooled from melted state, 10 spectra were per-formed on the material surface. Spectra profiles were perper-formed with Fourier Transform Raman spectroscopy, given similar profiles. Then, we considered that polarization unaffected the results.
Table 3
Degree of crystallinity calculated by density and DSC of the PEEK glassy samples. The absolute uncertainties of density and crystallinity are noted in the table. The enthalpy variations are presented with relative uncertainties.
Holding Density DSC - Sample 1 DSC - Sample 2
time ρ χc ΔHcc ΔHm χc ΔHcc ΔHm χc (minute) (g.−1) (%) (J.g−1) (J.g−1) (%) (J.g−1) (J.g−1) (%) ±0.005 ±4 1% 1% ±0.4 1% 1% ±0.4 0 1.263 0 25.5 39.5 10.8 25.1 35.9 8.3 5 1.264 1 25.3 49.8 18.9 24.4 43.5 14.7 10 1.262 0 23.3 43.8 15.7 24.0 48.0 18.4 15 1.258 −4 23.1 39.5 12.6 20.1 39.6 15.0 20 1.279 11 0.0 39.1 30.0 0.0 37.0 28.4 28 1.282 14 0.0 61.4 47.2 0.0 37.9 29.1 36 1.283 15 0.0 34.2 26.3 0.0 44.9 34.6 44 1.281 13 0.0 37.2 28.6 0.0 40.2 30.9 56 1.282 14 0.0 31.4 24.2 0.0 45.1 34.7
Polymer Testing 93 (2021) 106878
5
3. Results
3.1. Density
Density is calculated for all samples by an Archimede’s method (Tables 3 and 4). The density of untreated film PEEK is 1.263 g.−3, the
same as Blundell [36]. When PEEK is heated at 156 ◦C, no significant
density change is detected until 15 min of annealing. The density of the sample annealed during 15 min is 1.258 g.−3 and lower than the
un-treated sample, but the value is in the absolute uncertainty which is 0.005 g.−3. From 20 min, the density increases around 1.279–1.283 g.−3
and does not evolve until an annealing time of 56 min. For the sample cooled from the melted state, the density evolves between 1.300 g.−3 and
1.307 g.−3 for the temperature 260 ◦C, 280 ◦C and 300 ◦C. The density of
1.259 g.−3, lower than the untreated sample, is determined for the
sample cooled at 320 ◦C.
The degree of crystallinity χc is calculated from equation (1) by knowing the theoretical density of the amorphous phase ρa and the crystalline phase ρc, 1.263 g.−3 and 1.400 g.−3 respectively [36]. The
absolute uncertainty is 4% by considering Δρa and Δρc are theories values and equal to zero.
χc= ρ− ρa ρc− ρa
(1) The degree of crystallinity evolves similarly to the density as detailed previously (Fig. 4). For the samples annealed at 156 ◦C, the
crystalli-zation does not begin before 20 min and the degree of crystallinity is around 0%. After 20 min of annealing, the crystallization process begins, and increases until 13.5% for 56 min of annealing. According to the Time-Temperature-Transformation TTT diagram [15], the crystalliza-tion reaches only 50% of the relative crystallinity. For the sample cooled to 320 ◦C from the melted state, the degree of crystallization is 0% and
the same as the unheated film PEEK. When the cooling temperatures are lower, the degrees of crystallization reach 30%. The experiment dura-tion is 5 min, according to the TTT diagram, the crystallizadura-tion starts around 316 ◦C. Below this temperature, the degree of crystallinity
in-creases and the crystallization achieves more than 95% of the relative
crystallinity, two-times higher than for glassy samples. 3.2. Differential Scanning Calorimetry
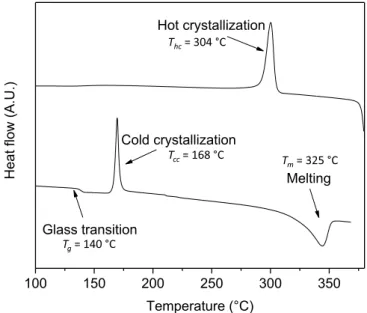
The characteristic temperatures, respectively the glass temperature, the cold crystallization temperature, the melting temperature and the hot crystallization temperature, are evaluated by DSC for the untreated sample (Fig. 5): Tg =140 ◦C, T
cc =168 ◦C, T
m =325 ◦C and T
hc =304 ◦C.
The melting enthalpy ΔHm and the cold crystallization enthalpy ΔHcc during the first heating are used to calculate the degrees of crystallinity from equation (2). The melting enthalpy of an ideal crystal of PEEK ΔH100%m is 130 J.g−1 [36].
Table 4
Degree of crystallinity calculated by density and DSC of the PEEK melted samples.The absolute uncertainties of density and crystallinity are noted in the table. The enthalpy variations are presented with relative uncertainties.
Holding Density DSC - Sample 1 DSC - Sample 2
temp. ρ χc ΔHcc ΔHm χc ΔHcc ΔHm χc (◦C) (g.cm−3) (%) (J.g−1) (J.g−1) (%) (J.g−1) (J.g−1) (%) ±0.005 ±4 1% 1% ±0.4 1% 1% ±0.4 260 1.300 27 0.0 53.7 40.6 0.0 38.5 29.6 280 1.303 29 0.0 40.0 30.8 0.0 61.8 47.5 300 1.307 32 0.0 39.9 30.7 0.0 45.0 38.4 320 1.259 − 3 25.6 37.8 9.4 26.4 50.4 18.4
Fig. 4. Degree of crystallinity calculated from density for PEEK samples obtained: a) from glassy state; b) from melted state. The absolute uncertainty is 4%. Dashed
lines are guides to the eyes.
Fig. 5. Thermogram for the untreated sample of PEEK: 1st heating and cooling.
χc=
ΔHm− ΔHcc
ΔH100%
m
(2) For the glassy samples, a cold crystallization occurs at 168 ◦C during
the first heating for samples annealed until 15 min and evolves between 20.1 and 25.5 J.g−1 (Table 3). The evolution of the melting enthalpy is
not linear according to the holding time. The degree of crystallinity evolves between 8.3% and 18.9% for a holding time from 0 to 15 min. Then, a second level between 24.2% and 47.2% appears for higher holding time (Fig. 6). No cold crystallization occurs after 20 min of annealing.
For the melted samples, during the cooling until 320 ◦C, the hot
crystallization temperature at 304 ◦C is not achieved (Table. 4). The
degree of crystallinity, 9.4% and 18.4%, is in a similar order of magni-tude of the untreated sample. For temperatures lower than 300 ◦C, the
crystallization occurs, and the degree of crystallization increases up to almost 50%.
3.3. X-ray diffraction (XRD)
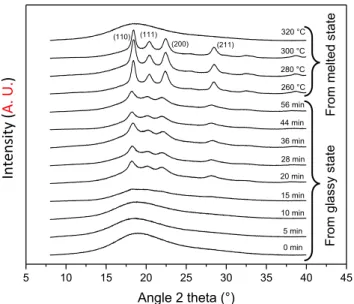
Fig. 7 gathers the X-ray diffractogram for every studied samples with the indexation of crystalline peaks [4]. When the degree of crystallinity is low, no crystalline peak appears. The intensity of crystalline peaks increases and crystalline peaks refine with an increase of χc.
The degree of crystallinity is calculated from the area of crystalline peaks of diffraction Ac and the area of amorphous peaks of diffraction Aa from equation (3).
χc= Ac
Ac+Aa (3)
The crystallinity change is similar to those calculated by density: two levels of crystallinity can be detected and there is a factor of two be-tween the degree of crystallinity of glassy samples and melted samples Fig. 6. Degree of crystallinity calculated by DSC for PEEK sample obtained: a) from glassy state; b) from melted state. Each analysis were performed two times. The
absolute uncertainty is lower than 0.4% and not represented on the graphic. Dashed lines are guides to the eyes.
Fig. 7. Diffractogram for PEEK sample obtained from glassy state and from
melted state.
Fig. 8. Degree of crystallinity calculated by XRD for PEEK samples obtained a) from glassy state; b) from melted state. The absolute uncertainty is lower than 0.5%
and not represented on the graphic. Dashed lines are guides to the eyes.
Table 5
Values calculated from XRD of the PEEK glassy samples. The relative and ab-solute uncertainty are noticed in the table.
Holding time χc a b c Vunitcell ρc
(minute) (%) (nm) (nm) (nm) (nm3) (g.cm−3) ±0.5 2% 2% 2% 6% 6% 20 7.92 0.798 0.587 0.978 0.458 1.392 28 8.33 0.789 0.586 1.004 0.464 1.375 36 7.28 0.785 0.587 0.966 0.445 1.434 44 7.34 0.787 0.584 0.990 0.455 1.403 56 8.02 0.792 0.585 0.989 0.458 1.392
Polymer Testing 93 (2021) 106878
7 (Fig. 8). The crystallinity of the sample annealed until 15 min is almost 0% as there is no crystalline peak in the spectra (Table 5). The detection limit of crystallinity with XRD is reached: this technique is not sensitive for samples with low degrees of crystallinity. On the sample spectra cooled at 320 ◦C from the melted state, no crystallinity peaks appear.
The holding time of 5 min was not long enough for crystallinity formation.
The crystallinity of a polymer could be identified with another method based on the crystalline density calculated from the cell pa-rameters, as Hay et al. did for an amorphous PEEK [7]. This method is possible only when peaks are detectable. In the following, the untreated film of PEEK, glassy samples annealed during 5, 10 and 15 min, and melted sample cooling at 320 ◦C are not studied. In the present study,
parameters a and b are close to the values calculated by Hay for samples performed from a glassy state (Table. 5). Parameters c are dispersed, and the standard deviation is around 0.05 nm. For samples cooled from a melted state, the evolution of parameters is linear and the values of parameters a, b and c are respectively 0.781 nm, 0.593 nm and 1.008 nm for the sample cooled at 260 ◦C (Table. 6), close to the values calculated
by Hay et al.
Then, cell parameters are used to calculate the volume of the orthorhombic cell only for samples with crystalline peaks on the spec-trum (Tables 5 and 6). For the glassy samples annealed during 36–56 min, the unit cell volume evolves between 0.445 3nm and 0.464 3nm.
For the melted samples, unit cell volume is constant, 0.464–0.466 3nm,
regardless the holding temperature ranged from 260 ◦C to 300 ◦C. No
difference appears during a test of 5 min. Hay et al. [7] apply a correction for the unit cell volume. The transparency of the material influences this value and induces asymmetrical deformation of the peak because of the peak at low diffraction angle.
Finally, the density of the crystalline phase ρc is calculated by
dividing the mass by the volume of the unit cell (Tables 5 and 6). Models of Fratini [13] and Jin [6] give similar crystallographic density. For the glassy sample, crystalline density is between 1.398 g.−3 and 1.408 g.−3,
no substantial evolution occurs when the holding time increases up to 56 min, except for the sample annealed during 36 min. For the melted sample, crystalline density is 1.368–1.375 g.−3at 260 ◦C, 280 ◦C and
300 ◦C and lower than the density of the crystalline phase ρ
c. Wakelyn et al. [9] found that crystallographic density increases when the tem-perature of annealing increases. In this study, the annealing time was shorter than in Wakelyn’s study, only 5 min compared to 1 h. Conse-quently, the crystallization did not have enough time to occur, especially at 320 ◦C.
3.4. Raman spectroscopy
Fig. 9 shows the spectrum of the untreated sample obtained by Raman spectroscopy. Mappings were performed on each glassy sample to calculate spatial statistics.
Four characteristics are studied by analyzing Raman spectra: band shift (S), full width at half maximum (FWHM), band intensity (I) and band area (A). We use the wavenumber in agreement with the Ellis assignment (Table 2) [23] to name the indicator with its vibrational mode. For example, S1595 and FWHM1595 denote the band shift and the
full width at half maximum of the νC=C mode at 1595 cm−1, respectively. I1607/1595 signifies the intensity ratio of the νC=C mode at 1607 cm−1 on the one at 1595 cm−1. In the same way, A
1607/1595 symbolizes the area
ratio of these two modes. For the six most intense bands, band shift and band full width at half maximum are determined. The mode at 1595 cm−1 is less sensitive to the environment and less change occurs. We
paid attention to the band at 1146 cm−1, given its dichroic response
according to Everall [37]. Intensity and area ratios are determined for the mode at 1146 cm−1 over mode at 1595 cm−1, mode at 1575 cm−1
over mode at 1595 cm−1 and mode at 1644 cm−1 over mode at 1651
cm−1. Eighteen Raman indicators are calculated. A correlation
coeffi-cient r is determined with a linear regression between Raman indicators and the degree of crystallinity deduced from the density. r is calculated according to the Pearson’s formula and represents for each indicator in
Fig. 10). First results reveal a low Pearson’s coefficient r with all sam-ples. At the scale of our mapping and the size of the probe used to record our spectra, we assume that the crystallinity is heterogeneous. To limit the effect of this heterogeneity, we select samples with low crystallinity - annealed at 156 ◦C during 0, 5, 10 and 15 min- and high crystallinity -
cooled from melted state at 260, 280 and 300 ◦C - are used for the
correlation.
Among the 18 indicators calculated, 4 of them have a correlation with the degree of crystallinity determined by density, superior to the absolute value of 0.8: S1651, A1644/1651, I1644/1651 and I1146/1595 (Fig. 12).
The results concerning the FWHM reveal a low correlation coefficient with the degree of crystallinity. S1651, the band shift of the band
νC=O Amor.which is the amorphous part of the band C––O, has the highest correlation coefficient at − 0.92. This band moves until 10 cm−1 towards
lower wavenumber as the degree of crystallinity increases. Louden [24], Everall [37], Stuart [38] found similar evolution. The shift of the bands Table 6
Values calculated from XRD of the PEEK melted samples. The relative and ab-solute uncertainty are noticed in the table.
Holding temperature χc a b c Vunitcell ρc
(minute) (%) (nm) (nm) (nm) (nm3) (.−3)
±0.5 2% 2% 2% 6% 6%
260 20.67 0.781 0.593 1.008 0.466 1.374
280 21.27 0.781 0.592 1.004 0.464 1.381
300 21.74 0.781 0.591 1.006 0.445 1.378
Fig. 9. Spectrum of the PEEK untreated sample. γ: out-of-plane bending; δ:
bending or scissoring; ν: stretching.
Fig. 10. Absolute values of correlation coefficient of Raman’s indicator with
the degree of crystallinity determined by density: positive value (■) and negative value (□).
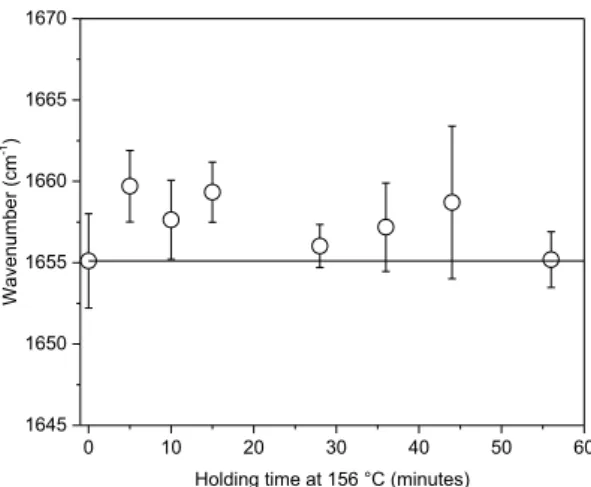
provides information on the local stresses and information of environ-ment. If the band shifts towards lower wavenumber, the measured area of the material can be under tensile stress. Otherwise, the area can be in compression, like the band at 1651 /cm. During the annealing, the de-gree of crystallinity increases, therefore the unit cell lengthens, a network of crystallinity grows. The system, and the constraints are released. When glassy samples are annealed, the shift towards higher wavenumber is noticeable (Fig. 11). During the initial forming of PEEK film, macromolecules are in tensile, the annealing relieves stresses in the material.
Concerning area ratios, A1607/1595 has the better correlation
coeffi-cient at 0.89. When the degree of crystallinity increases, this indicator increases.
Two intensity ratios give high an absolute value of the correlation
coefficients: I1644/1651, I1146/1595 have correlation coefficient of - 0.86
and - 0.83 respectively. I1146/1595 corresponds to the C––O band,
crys-talline and amorphous phase are indexed at 1644 and 1651 /cm respectively. When this ratio increases, the crystalline phase is less important. Ellis [23] found a different result. However, the bands νC=O Crist.and νC=O Amor.are close; the deconvolution of these two bands is difficult and may explain this difference with Ellis’s previous studies (See Supplementary Data). Moreover, when the degree of crystallinity increases, the ratio I1146/1595 decreases, which is in good agreement with
Louden [24] and Stuart [27] works.
4. Discussion and conclusion
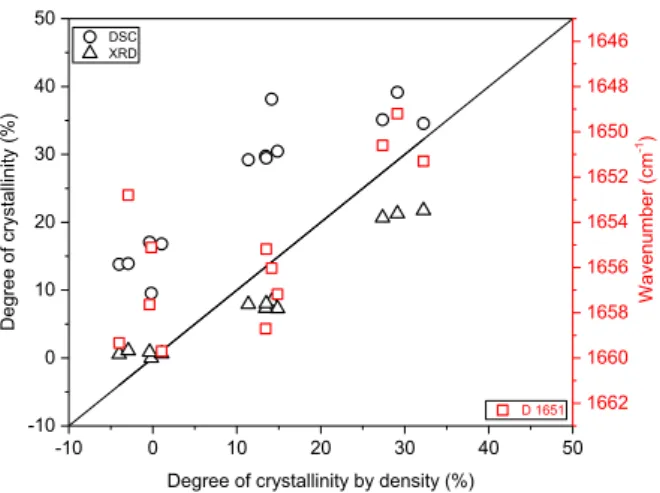
In this work, a comparison of the degrees of crystallinity of PEEK is performed as a function of the thermal history undergone by the ma-terial. For the same thermal history, the degree of crystallinity is measured with four different techniques: density, DSC, XRD and Raman microspectrometry. The benefits and drawbacks of the techniques were highlighted as well as the specificity of the measurement of PEEK crystallinity. Fig. 13 represents, as a function of crystallinity measured by density, the crystallinity obtained by the other techniques (density, XRD and DSC). The best performing indicator calculated by Raman spectroscopy, S1651, has been added.
DSC overestimates degrees of crystallinity of PEEK and gives the highest values, up to 40%. At low degrees of crystallinity, the over-estimation comparing density is around 10%–18%, and more important than at high degrees of crystallinity which is around 2%–10%. This technique is based on the heat exchanges measured during the thermal transitions of the material. The sample is subjected to a temperature ramp causing the crystalline zones to melt. However, the crystallization and melting temperature windows overlap for PEEK. When it is heated, the macromolecules of the amorphous phase have more mobility, which leads to the crystallization before they melt. The measured enthalpy of fusion is thus increased, the sample is heated to measure its fusion enthalpy.
DSC is a destructive method. On the contrary, XRD is non-destructive Fig. 11. The band shift δC− CO− C for glassy samples. The line indicates the values
of the untreated film PEEK. Error bars represented the standard deviation.
Polymer Testing 93 (2021) 106878
9 measurement. The XRD underestimates the degrees of crystallinity which are lower than the values determined by density at high degrees of crystallinity. On the one hand, it is difficult, for low crystallinity rates, to extract the crystalline part hidden by the halo from the amorphous phase. On the other hand, the quantity of amorphous phase is difficult to estimate on the samples of which the crystalline part is important. The degree of crystallinity is possibly lowered. The underestimation is negligible for low degrees of crystallinity and around 7% and 11% for high values.
Raman spectroscopy seems to be a good technique to determine the local crystallinity on the sample surface. A link between crystallinity and Raman spectroscopy was highlighted by Louden [24], Briscoe [26], Stuart [27], Ellis [23] and Everall [37]. They proposed several indicators and they didn’t compare those to each other. Several reasons can be advanced concerning the indicators having a low Pearson’s coefficient. Specifically, Ellis [23] shows that the response of some bands can be affected by polarization effects for the isotropic sample. We note that the low sensitivity of the νC=C modes at 1644 /cm and 1651 / cm affects the estimation of the FWHM and its intensity. Our investigation compares 18 indicators in the same study and proves that the 1651 / cm band shift, S1651, has the highest correlation coefficient with the degree of
crys-tallinity determined by density. Three other indicators, A1607/1595,
I1644/1651 and I1146/1595, have a correlation coefficient with an absolute
value superior to 0.8. Thus, we propose four indicators to determine locally on the PEEK surface the degree of crystallinity with Raman spectroscopy.
CRediT authorship contribution statement
M. Doumeng: Investigation, Methodology, Formal analysis, Writing
- original draft. L. Makhlouf: Investigation, Formal analysis. F. Berthet: Validation, Funding acquisition, Writing - review & editing. O. Marsan: Investigation, Writing - review & editing. K. Delb´e: Project adminis-tration, Supervision, Conceptualization, Methodology, Validation, Re-sources, Funding acquisition, Writing - review & editing. J. Denape: Project administration, Validation, Funding acquisition, Writing - re-view & editing. F. Chabert: Validation, Funding acquisition, Writing - review & editing.
Declaration of competing interest
The authors declare that they have no known competing financial interests or personal relationships that could have appeared to influence
the work reported in this paper.
Acknowledgments
The Occitanie country fund this research in the context a University of Toulouse thesis (APR no ALDOC-000185-2017 001834).
Appendix A. Supplementary data
Supplementary data to this article can be found online at https://doi. org/10.1016/j.polymertesting.2020.106878.
References
[1] T.E. Attwood, P.C. Dawson, J.L. Freeman, L.R.J. Hoy, J.B. Rose, P.A. Staniland, Synthesis and properties of polyaryletherketones, Polymer 22 (1981) 1096–1103. [2] C. Fougnies, M. Dosi`ere, M.H.J. Koch, J. Roovers, Cold crystallization of narrow
molecular weight fractions of PEEK, Macromolecules 32 (1999) 8133–8138. [3] M. Yuan, J.A. Galloway, R.J. Hoffman, S. Bhatt, Influence of molecular weight on
rheological, thermal, and mechanical properties of PEEK, Polym. Eng. Sci. 51 (2011) 94–102.
[4] P.C. Dawson, D.J. Blundell, X-ray data for poly(aryl ether ketones), Polymer 21 (1980) 577–578.
[5] S. Kumar, D.P. Anderson, W.W. Adams, Crystallization and morphology of poly (aryl-ether-ether-ketone), Polymer 27 (1986) 329–336.
[6] L. Jin, J. Ball, T. Bremner, H.J. Sue, Crystallization behavior and morphological characterization of poly(ether ether ketone), Polymer 55 (2014) 5255–5265. [7] J.N. Hay, J.I. Langford, J.R. Lloyd, Variation in unit cell parameters of aromatic
polymers with crystallization temperature, Polymer 30 (1989) 489–493. [8] X.L. Ji, X.F. Qiu, W.J. Zhang, Z.S. Mo, H.F. Zhang, Z.W. Wu, Variation in unit cell
parameters with crystallization temperature in poly(ether diphenyl ether ketone), Polym. J. 30 (1998) 601–603.
[9] N.T. Wakelyn, Variation of unit cell parameters of poly(arylene ether ether ketone) film with annealing temperature, J. Polym. Sci., Part C 25 (1987) 25–28. [10] J.N. Hay, D.J. Kemmish, J.I. Langford, A.I.M. Rae, The structure of crystalline
PEEK, Polym. Commun. 25 (1984) 175–178.
[11] D.R. Rueda, F. Ania, A. Richardson, I.M. Ward, F.J. Balta Calleja, X-Ray diffraction study of die drawn poly(aryletherketone)(PEEK), Polym. Commun. 24 (1983) 258–260.
[12] J. Shimizu, T. Kikutani, Y. Ookoshi, A. Takaku, The crystal structure and the refractive index of drawn and annealed poly(ether-ether-ketone) (PEEK) fibers, Seni Gakkai Shi 41 (1985) T461–T467.
[13] A.V. Fratini, E.M. Cross, R.B. Whitaker, W.W. Adams, Refinement of the structure of PEEK fibre in an orthorhombic unit cell, Polymer 27 (1986) 861–865. [14] W.A. Pisani, M.S. Radue, S. Chinkanjanarot, B.A. Bednarcyk, E.J. Pineda,
K. Waters, R. Pandey, J.A. King, G.M. Odegard, Multiscale modeling of PEEK using reactive molecular dynamics modeling and micromechanics, Polymer 163 (2019) 96–105.
[15] C. Bas, P. Battesti, N.D. Alb´erola, Crystallization and melting behaviors of poly (aryletheretherketone)(PEEK) on origin of double melting peaks, J. Appl. Polym. Sci. 53 (1994) 1745–1757.
[16] D.J. Kemmish, J.N. Hay, The effect of physical ageing on the properties of amorphous PEEK, Polymer 26 (1985) 905–912.
[17] C.N. Velisaris, J.C. Seferis, Crystallization kinetics of polyetheretherketone (peek) matrices, Polym. Eng. Sci. 26 (1986) 1574–1581.
[18] Y. Wang, Y. Wang, Q. Lin, W. Cao, C. Liu, C. Shen, Crystallization behavior of partially melted poly (ether ether ketone), J. Therm. Anal. Calorim. 129 (2017) 1021–1028.
[19] P. Cebe, S.Y. Chung, S.D. Hong, Effect of thermal history on mechanical properties of polyetheretherketone below the glass transition temperature, J. Appl. Polym. Sci. 33 (1987) 487–503.
[20] A.A. Mehmet-Alkan, J.N. Hay, The crystallinity of poly(ether ether ketone), Polymer 33 (1992) 3527–3530.
[21] P. Wang, R. Ma, Y. Wang, W. Cao, C. Liu, C. Shen, Comparative study of fullerenes and graphene nanoplatelets on the mechanical and thermomechanical properties of poly(ether ether ketone), Mater. Lett. 249 (2019) 180–184.
[22] A.A. Mehmet-Alkan, J.N. Hay, The crystallinity of PEEK composites, Polymer 34 (1993) 3529–3531.
[23] G. Ellis, M. Naffakh, C. Marco, P.J. Hendra, Fourier transform Raman spectroscopy in the study of technological polymers Part 1: poly(aryl ether ketones), their composites and blends, Spectrochim. Acta A 53 (1997) 2279–2294. [24] J.D. Louden, Crystallinity in poly(aryl ether ketone) films studied by Raman
spectroscopy, Polym. Commun. 27 (1986) 82–84.
[25] J.K. Agbenyega, G. Ellis, P.J. Hendra, W.F. Maddams, C. Passingham, H.A. Willis, J. Chalmers, Applications of Fourier Transform Raman spectroscopy in the synthetic polymer field, Spectrochim. Acta A 46 (1990) 197–216.
[26] B.J. Briscoe, B.H. Stuart, P.S. Thomas, D.R. Williams, A comparison of thermal- and solvent-induced relaxation of poly(ether ether ketone) using Fourier transform Raman spectroscopy, Spectrochim. Acta A 47 (1991) 1299–1303.
[27] B.H. Stuart, B.J. Briscoe, A Fourier transform Raman spectroscopy study of poly (ether ether ketone)/polytetrafluoroethylene (PEEK/PTFE) blends, Spectrochim. Acta A 50 (1994) 2005–2009.
Fig. 13. Degree of crystallinity according to the technique. S1651: wavenumber
of the band 1651 cm−1. The line indicates the ratio conservation. S1651:
wavenumber of the band 1651 cm−1.
[28] C. Bas, Crystallization kinetics of poly(aryl ether ether ketone) Time-temperature- transformation and continuous-cooling-transformation diagrams, Eur. Polym. J. 31 (1995) 911–921.
[29] P. Cebe, S.D. Hong, Crystallization behaviour of poly(ether-ether-ketone), Polymer 27 (1986) 1183–1192.
[30] C. Fougnies, P. Damman, D. Villers, M. Dosi`ere, M.H.J. Koch, Time-resolved SAXS, WAXS, and DSC study of the annealing of poly(aryl ether ether ketone) (PEEK) from the glassy state, Macromolecules 30 (1997) 1385–1391.
[31] C. Fougnies, P. Damman, M. Dosi`ere, M.H.J. Koch, Time-resolved SAXS, WAXS, and DSC study of melting of poly(aryl ether ether ketone) (PEEK) annealed from the amorphous state, Macromolecules 30 (1997) 1392–1399.
[32] L. Martineau, F. Chabert, G. Bernhart, T. Djilali, Mechanical behavior of amorphous PEEK in the rubbery state, in: Proceedings of the 17th European Conference on Composite Materials ECCM17, vol. 17, Germany, Munich, 2016, p. 10.
[33] T.Y. Ko, E.M. Woo, Changes and distribution of lamellae in the spherulites of poly (ether ether ketone) upon stepwise crystallization, Polymer 37 (1996) 1167–1175. [34] X. Tardif, B. Pignon, N. Boyard, J.W.P. Schmelzer, V. Sobotka, D. Delaunay,
C. Schick, Experimental study of crystallization of PolyEtherEtherKetone (PEEK) over a large temperature range using a nano-calorimeter, Polym. Test. 36 (2014) 10–19.
[35] L. Martineau, F. Chabert, B. Boniface, G. Bernhart, Effect of interfacial crystalline growth on autohesion of PEEK, Int. J. Adhesion Adhes. 89 (2019) 82–87. [36] D.J. Blundell, B.N. Osborn, The morphology of poly(aryl-ether-ether-ketone),
Polymer 24 (1983) 953–958.
[37] N.J. Everall, J.M. Chalmers, R. Ferwerda, J.H. van der Maas, P.J. Hendra, Measurement of poly(aryl ether ether ketone) crystallinity in isotropic and uniaxial samples using Fourier transform-Raman spectrocopy: a comparison of univariate and partial least-squares calibrations, J. Raman Spectrosc. 25 (1994) 43–51. [38] B.H. Stuart, Polymer crystallinity studied using Raman spectroscopy, Vib.
![Fig. 2. Unit cell of PEEK reported by a) Fratini [13] and b) Jin [6].](https://thumb-eu.123doks.com/thumbv2/123doknet/12252474.320156/3.892.56.433.247.416/fig-unit-cell-peek-reported-fratini-b-jin.webp)